HAL Id: hal-00328315
https://hal.archives-ouvertes.fr/hal-00328315
Submitted on 10 Oct 2008HAL is a multi-disciplinary open access
archive for the deposit and dissemination of sci-entific research documents, whether they are pub-lished or not. The documents may come from teaching and research institutions in France or abroad, or from public or private research centers.
L’archive ouverte pluridisciplinaire HAL, est destinée au dépôt et à la diffusion de documents scientifiques de niveau recherche, publiés ou non, émanant des établissements d’enseignement et de recherche français ou étrangers, des laboratoires publics ou privés.
Radiative forcing from particle emissions by future
supersonic aircraft
G. Pitari, D. Iachetti, E. Mancini, V. Montanaro, C. Marizy, O. Dessens, H.
Rogers, J. Pyle, V. Grewe, A. Stenke, et al.
To cite this version:
G. Pitari, D. Iachetti, E. Mancini, V. Montanaro, C. Marizy, et al.. Radiative forcing from particle emissions by future supersonic aircraft. Atmospheric Chemistry and Physics Discussions, European Geosciences Union, 2008, 8 (2), pp.5091-5135. �hal-00328315�
ACPD
8, 5091–5135, 2008 Radiative forcing from particle emissions by future supersonic aircraft G. Pitari et al. Title Page Abstract Introduction Conclusions References Tables Figures ◭ ◮ ◭ ◮ Back CloseFull Screen / Esc
Printer-friendly Version Interactive Discussion
Atmos. Chem. Phys. Discuss., 8, 5091–5135, 2008 www.atmos-chem-phys-discuss.net/8/5091/2008/ © Author(s) 2008. This work is distributed under the Creative Commons Attribution 3.0 License.
Atmospheric Chemistry and Physics Discussions
Radiative forcing from particle emissions
by future supersonic aircraft
G. Pitari1, D. Iachetti1, E. Mancini1, V. Montanaro1, C. Marizy2, O. Dessens3, H. Rogers3, J. Pyle3, V. Grewe4, A. Stenke4, and O. A. Søvde5
1
Dipartimento di Fisica, Universit `a L’Aquila, Italy
2
AIRBUS, Toulouse, France
3
Centre for Atmospheric Science, Department of Chemistry, University of Cambridge, Cambridge, UK
4
Deutsches Zentrum f ¨ur Luft- und Raumfahrt, Institut f ¨ur Physik der Atmosph ¨are, Oberpfaffenhofen, 82230 Wessling, Germany
5
Department of Geoscience, University of Oslo, Norway
Received: 20 December 2007 – Accepted: 9 February 2008 – Published: 7 March 2008 Correspondence to: G. Pitari ([email protected])
ACPD
8, 5091–5135, 2008 Radiative forcing from particle emissions by future supersonic aircraft G. Pitari et al. Title Page Abstract Introduction Conclusions References Tables Figures ◭ ◮ ◭ ◮ Back CloseFull Screen / Esc
Printer-friendly Version Interactive Discussion Abstract
In this work we focus on the direct radiative forcing (RF) of black carbon (BC) and sul-phuric acid particles emitted by future supersonic aircraft, as well as on the ozone RF due to changes produced by emissions of both gas species (NOx, H2O) and aerosol particles capable of affecting stratospheric ozone chemistry. Heterogeneous chemical
5
reactions on the surface of sulphuric acid stratospheric particles (SSA-SAD) are the main link between ozone chemistry and supersonic aircraft emissions of sulphur pre-cursors (SO2) and particles (H2O-H2SO4). Photochemical O3changes are compared from four independent 3-D atmosphere-chemistry models (ACMs), using as input the perturbation of SSA-SAD calculated in the University of L’Aquila model, which includes
10
on-line a microphysics code for aerosol formation and growth. The ACMs in this study use aircraft emission scenarios for the year 2050 developed by AIRBUS as a part of the EU project SCENIC, assessing options for fleet size, engine technology (NOxemission index), Mach number, range and cruising altitude. From our baseline modelling sim-ulation, the impact of supersonic aircraft on sulphuric acid aerosol and BC mass
bur-15
dens is 53 and 1.5 µg/m2, respectively, with a direct RF of −11.4 and 4.6 mW/m2(net RF=−6.8 mW/m2). This paper discusses the similarities and differences amongst the participating models in terms of O3precursors changes due to aircraft emissions (NOx, HOx,Clx,Brx) and stratospheric ozone sensitivity to them. In the baseline case, the cal-culated global ozone change is −0.4±0.3 DU, with a net radiative forcing (IR+UV) of
20
−2.5±2 mW/m2. The fraction of this O3-RF attributable to SSA-SAD changes is, how-ever, highly variable among the models, depending on the NOxremoval efficiency from the aircraft emission regions by large scale transport.
1 Introduction
The growth of the world economy is leading a rapid expansion of aviation, due to the
25
in-ACPD
8, 5091–5135, 2008 Radiative forcing from particle emissions by future supersonic aircraft G. Pitari et al. Title Page Abstract Introduction Conclusions References Tables Figures ◭ ◮ ◭ ◮ Back CloseFull Screen / Esc
Printer-friendly Version Interactive Discussion
creased and are projected to increase by 3% per year in future (IPCC, 1999). Moreover, the request of short travelling times leads to the possibility for the future to develop a fleet of second generation supersonic, high speed civil transport (HSCT) aircraft, in-troducing a considerable uncertainty about the future total aviation emissions. In this paper the effects of the current subsonic aviation fleet are compared to those of a mixed
5
fleet (subsonic and supersonic aircraft), using (direct and indirect) radiative forcing cal-culations (RF) as a climate change index.
Aircraft emit both gases and particles (CO2, NOx, H2O, CO, hydrocarbons, black carbon and sulphate aerosols) directly into the upper troposphere and lower strato-sphere (UT/LS region), where they have an impact on the atmospheric composition.
10
In particular, supersonic aircraft are projected to cruise at an altitude of about 19 km, emitting directly into the stratosphere. HSCT emissions can therefore lead to an ozone column decrease as a result of NOxemissions; moreover, emitted species have longer residence times in the stratosphere, giving a different climate response compared to the subsonic case. Most of the additional radiative forcing due to HSCTs results from
15
accumulated water vapour into the stratosphere as a direct result of emissions from aviation (IPCC, 1999; Grewe et al., 2007). The emissions of NOx into the UT/LS in-creases the efficiency of the catalytic NOx ozone destruction/production cycles, giving a RF which may be either positive or negative depending on the ozone perturbation dis-tribution. Some models predict a clear crossover point between the tropospheric/lower
20
stratospheric O3increase (below about 20 km) and the mid-stratospheric O3decrease (approx. 35 km). Other models however have a stronger downward propagation of the mid-stratospheric O3decrease, without showing a clear crossover point. In this second case the HSCT NOxemissions will always produce a negative O3RF.
For the aerosols we have calculated both the direct forcing (i.e. scattering and
ab-25
sorption of incoming solar radiation) and indirect forcing produced by changes of chem-ical species (i.e. O3) affected by heterogeneous chemical processes on the surface of aerosol particles. Other indirect processes (for example the potential aerosol feedback on the formation of cirrus ice particles in the upper troposphere) have not been taken
ACPD
8, 5091–5135, 2008 Radiative forcing from particle emissions by future supersonic aircraft G. Pitari et al. Title Page Abstract Introduction Conclusions References Tables Figures ◭ ◮ ◭ ◮ Back CloseFull Screen / Esc
Printer-friendly Version Interactive Discussion
into account in the present work.
In section two of this paper we give a brief description of the four chemical-transport models, which are included in this intercomparison. A description of the emission data set is given in section three. In section four we present results for black carbon (BC) and sulphate (SO4) aerosols as simulated in the University of L’Aquila CTM (ULAQ-CTM).
5
The atmospheric impact produced by future supersonic aircraft is discussed in section five: there we first present the radiative forcing calculations with a discussion of the role of different species (CO2, H2O, O3, BC, SO4), before discussing the results of the chemical impact by intercomparing the different models. In section six we summarize the main conclusions of the present work.
10
2 Models description
2.1 ULAQ-CTM
ULAQ-CTM, from the University of L’Aquila, is a low-resolution three-dimensional aerosol-chemistry-transport model that uses a 10×22.5 degree resolution in latitude-longitude and 26 log-pressure levels, from the ground to about 0.04 hPa, with an
ap-15
proximate resolution of 2.84 km. Dynamical fields are taken from the output of a spec-tral general circulation climate model ULAQ-GCM (Pitari et al., 2002). The chemical module contains the most important photolytic, gas phase and heterogeneous reac-tions relevant for stratospheric chemistry, including Ox, HOx, NOy, ClOx, BrOx, CHOx and SOx families. It uses reaction rates from JPL-97 and JPL-2000, the latter for the
20
NOx cycle. Sulphur precursors in the model are SO2, OCS, DMS, H2S, and CS2, with SO2 being the most important species for the sulphur budget into the lower strato-sphere, and OCS for the middle stratosphere. SO2 comes from both natural sources (volcanoes, oceans, biomass burning) and anthropogenic activities (fossil fuel burning, in situ emissions from aircraft) and is efficiently transported from the boundary layer up
25
ACPD
8, 5091–5135, 2008 Radiative forcing from particle emissions by future supersonic aircraft G. Pitari et al. Title Page Abstract Introduction Conclusions References Tables Figures ◭ ◮ ◭ ◮ Back CloseFull Screen / Esc
Printer-friendly Version Interactive Discussion
includes the major components of tropospheric and stratospheric aerosols (sulphate, carbonaceous, dust, sea salt). The size distribution of sulphate and PSC aerosols are calculated using an interactive and mass conserving microphysical code for aerosol formation and growth. The aerosol microphysical code has been described in Pitari et al. (1993); it includes evaporation, condensation, coagulation, gravitational
sedimenta-5
tion, heterogeneous and bimolecular homogeneous nucleation for H2O-H2SO4(Pitari et al., 2002). Sulphate aerosols are allowed in the model to interact with carbonaceous particles, via coagulation and heterogeneous nucleation. On-line prediction of tropo-spheric aerosols should not only allow to calculate realistic extinction and optical depth fields into the troposphere, but also to have a realistic treatment of the lower boundary
10
conditions for stratospheric sulphuric acid aerosols, which in turn largely dominates aerosol mass and extinction into the middle atmosphere. The main removal processes of aerosol particles located in the troposphere (wet-dry depositions and gravitational surface sedimentation) are included. Sulphate aerosol particles are divided in 15 size bins (from 0.4 nm up to 10.24 µm by doubling the radius) and each one of these size
15
categories is transported separately. Sulphate and PSC aerosol surface area density fields needed for heterogeneous chemical reactions are calculated on-line using the predicted aerosol size distributions.
2.2 SLIMCAT
SLIMCAT, from the University of Cambridge (UCAM), is an off-line three-dimensional
20
chemical transport model for the stratosphere, formulated on isentropic surfaces. For this study a T15 resolution is applied. It can be run as a multi-level model, or with just a single layer. Forcing winds from a variety of sources can be used, including ECMWF and UKMO analyses as well as GCM output. The horizontal flow, along the isentropic surfaces, is generally forced from meteorological analyses. However, the
25
cross-isentropic transport is calculated using a radiative transfer scheme, MIDRAD. The model has been used extensively for stratospheric studies (Chipperfield et al., 1995; Chipperfield et al., 1996; Chipperfield and Pyle, 1998; Pyle et al., 1995),
includ-ACPD
8, 5091–5135, 2008 Radiative forcing from particle emissions by future supersonic aircraft G. Pitari et al. Title Page Abstract Introduction Conclusions References Tables Figures ◭ ◮ ◭ ◮ Back CloseFull Screen / Esc
Printer-friendly Version Interactive Discussion
ing investigations of the impact of supersonic aviation (Rogers et al., 2000). The spatial resolution of the model is flexible. A range of studies have been performed at a variety of resolution from T10 to T170 (0.7×0.7). The bottom boundary is usually taken to be the 350 K surface (a surface within the troposphere). Because it is formulated on isen-tropic surfaces, SLIMCAT should have particular advantages in the tropopause region.
5
The default model tracer advection scheme is the second-order moments scheme of Prather (1986) which has relatively low numerical diffusion. In SCENIC configuration the model has been used with a resolution of 18 levels, 24 latitudes and 48 longitudes.
2.3 E39/C
The interactively coupled chemistry-climate model E39/C from the DLR, (Hein et al.,
10
2001; Dameris et al., 2005) consists of the dynamics part ECHAM4.L39 (E39) and the chemistry module CHEM (C). E39/C is a spectral general circulation model with a verti-cal resolution of 39 levels from the surface up to the top layer centered at 10 hPa (Land et al., 2002). With a particular high vertical resolution of 500–800 m in the tropopause region, E39/C is suitable for modelling aircraft effects (Grewe et al., 2002). Water
15
vapour, cloud water and chemical species are advected by the Lagrangian transport scheme ATTILA (Reithmeier and Sausen, 2002, Stenke et al., 2007). E39/C includes state of the art parameterizations of small scale physical processes like convection, cloud formation or vertical turbulent diffusion. Within SCENIC the model is applied with a horizontal resolution of T30, i.e. dynamic processes have a horizontally isotropic
res-20
olution of 6◦. Tracer transport, physical parameterizations and chemical reactions are calculated on the corresponding Gaussian transform grid (3.75×3.75). The chemistry module CHEM (Steil et al., 1998) includes stratospheric homogeneous and heteroge-neous ozone chemistry and tropospheric NOx, HOx, CH4, CO, O3chemistry with 107 photochemical reactions, 4 heterogeneous reactions on PSCs and sulphate aerosols,
25
and 37 chemical species. The used model version considers updates of the reaction rate coefficients (JPL, 2000). The coupled chemistry-climate model E39/C can be run in two different modes: in the off-line mode prescribed climatologies of the radiatively
ACPD
8, 5091–5135, 2008 Radiative forcing from particle emissions by future supersonic aircraft G. Pitari et al. Title Page Abstract Introduction Conclusions References Tables Figures ◭ ◮ ◭ ◮ Back CloseFull Screen / Esc
Printer-friendly Version Interactive Discussion
active gases H2O, O3, CH4, N2O, and CFCs are used as input for the radiation scheme. Concentrations of chemical species as calculated by CHEM do not feedback to the dy-namics part. In the on-line mode, the concentrations of the radiatively active gases as calculated by CHEM are used in the radiative calculations. For this study the off-line mode has been chosen to reduce statistical noise in the differences of two simulations.
5
2.4 OsloCTM2
OsloCTM2, from the University of Oslo (UiO), is a global three-dimensional chemical transport model, with comprehensive tropospheric and stratospheric chemistry. It is driven by meteorological data from the ECMWF Integrated Forecast System model (IFS). The advective transport is done using the highly accurate and low-diffusive
sec-10
ond order momentum scheme (Prather, 1986). The parameterization of transport through deep convection is based on the Tiedke mass flux scheme (Tiedtke, 1989), while boundary layer mixing is treated according to the Holtslag K-profile scheme (Holt-slag et al., 1990). The model is run with 40-layer meteorological data, extending from the surface to 2 hPa (mass center at 10 hPa). Vertical resolution in the tropopause
15
region varies between about 0.8 km in high latitudes and about 1.2 km in low lati-tudes. The horizontal resolution can be varied between T21 (5.5×5.5 degrees), T42 (2.8×2.8 degrees) and T63 (1.9×1.9 degrees). A horizontal resolution of T21 has been used for this study. Calculation of the different schemes in the model is done us-ing operator splittus-ing, with advective transport and chemistry beus-ing treated separately
20
during one hour. The tropospheric chemistry scheme has been thoroughly tested in OsloCTM1 (Berntsen and Isaksen, 1997) and the tropospheric version of OsloCTM2 (Sundet, 1997). Originally, the stratospheric chemistry scheme was developed by Stordal et al. (1985) and later updated to include heterogeneous chemistry (Isaksen et al., 1990). It was also later included in OsloSCTM1 (Rummukainen, 1996;
Rum-25
mukainen et al., 1990). Photodissociation coefficients are calculated from the Fast-J2 method. The numerical integration of chemical kinetics is done applying the Quasi Steady State Approximation (QSSA) (Hesstvedt et al., 1978) with a numerical time
ACPD
8, 5091–5135, 2008 Radiative forcing from particle emissions by future supersonic aircraft G. Pitari et al. Title Page Abstract Introduction Conclusions References Tables Figures ◭ ◮ ◭ ◮ Back CloseFull Screen / Esc
Printer-friendly Version Interactive Discussion
step of 5 min. As an upper boundary, Oslo2D is used. OsloCTM2 has been validated against satellite measurements, sondes and lidar in the Norwegian Coordinated ozone and UV project (COZUV), and also during EU projects (see TRADEOFF, 2003) against satellite and aircraft measurements. The TRADEOFF validation effort is described re-cently by Brunner et al. (2003, 2005). The model has also been evaluated to some
5
extent in Gauss et al. (2003, 2006).
3 Aircraft emission scenarios
This paper is based on the work made during the EU-project SCENIC, using the super-sonic aircraft configurations (SAC) developed by Airbus to quantify emissions produced by commercial mixed fleets, for the year 2025 and 2050 (SCENIC, 2005). For each
10
date, one scenario for the pure subsonic case and a second for the mixed fleet case were provided. All scenarios include emissions of CO2, H2O, SOx, NOx, CO, HC, BC for impact evaluations. Some of these supersonic characteristics could be modified in response to other orientations linking to air traffic demand, technology evolution, eco-nomical benefits or environmental preservation; that is why other supersonic
configura-15
tions have been designed and used to perform perturbation scenarios. Characteristics of these supersonic scenarios are summarised in Table 1. An important underlying assumption is the utilisation of a unique market analysis for all emissions scenarios, which imply a constant number of 250 transported commercial passengers for each of them. Supersonic traffic is defined by looking on each potential route its
competitive-20
ness versus a subsonic flight. This includes time saving, minimum market penetration on the route, ticket price, and diverted distance with associated fuel consumption (over-land flights in supersonic mode have been removed for sonic bang nuisances). For this paper we consider the 2050 scenarios only. The S4 scenario provides a 3-D emissions distribution from a purely subsonic fleet; the S6 scenario provides a 3-D emissions
25
distribution from a mixed fleet where part of commercial subsonic traffic is replaced by supersonic traffic. Aircraft-emitted particles are included in both scenarios S6 and S4,
ACPD
8, 5091–5135, 2008 Radiative forcing from particle emissions by future supersonic aircraft G. Pitari et al. Title Page Abstract Introduction Conclusions References Tables Figures ◭ ◮ ◭ ◮ Back CloseFull Screen / Esc
Printer-friendly Version Interactive Discussion
as well as in the perturbation cases (see below). The supersonic fleet in this mixed scenario fly at Mach 2.0, which implies cruise altitudes between 55 and 65 kft (16.8 km to 19.5 km) and cruising speed varying between 2000 and 2100 km/h.
The P2, P3, P4, P5, P6 scenarios are considered as perturbation scenarios with respect to the base case S6, in which supersonic aircraft parameters are modified
5
to evaluate the potential environmental impact of alternate supersonic designs. P2 scenario is representative of emissions produced by the mixed fleet including the ref-erence HSCT aircraft, for which the mean EI (NOx) has been increased to correspond to a lower technological-level maturity; P3 scenario is representative of emissions pro-duced by the mixed fleet including the reference HSCT aircraft, where the demand for
10
high-speed means of transport is increased; P4 scenario is representative of emis-sions produced by the mixed fleet including a Mach 1.6 supersonic fleet in response to other industrial objectives; P5 scenario is representative of emissions produced by the mixed fleet including a Mach 2.0 supersonic aircraft , for which the range has been increased in response to traffic demand on longer distances; P6 scenario is
represen-15
tative of emissions produced by the mixed fleet including a Mach 1.6 supersonic fleet where cruise altitude has been reduced for environmental consideration. The assump-tions for the commercial passenger fleet (fixed market penetration for a given yr) imply that the selection of a given supersonic configuration may change other factors, i.e. the utilisation of a Mach 1.6 configuration instead Mach 2.0 impacts the route distribution
20
made by this supersonic fleet (some routes are removed other ones are added), the market penetration and the number of aircraft needed to transport these passengers on these routes, the flight cruise altitude, the distance flown, etc., so that geographical emissions distribution is completely different. The percentage of the fleet passenger miles shifted from subsonic to supersonic changes with the scenario (market
penetra-25
tion and routes). As supersonic aircraft cannot be used on all routes, evaluation has been made only on selected supersonic routes. Evaluation in term of Revenue Pas-senger Kilometers (RPKs) for the total fleet gives: 4.1% for S6 and P2, 7.9% for P3, 3.9% for P4 and P6, 4.7% for P5.
ACPD
8, 5091–5135, 2008 Radiative forcing from particle emissions by future supersonic aircraft G. Pitari et al. Title Page Abstract Introduction Conclusions References Tables Figures ◭ ◮ ◭ ◮ Back CloseFull Screen / Esc
Printer-friendly Version Interactive Discussion
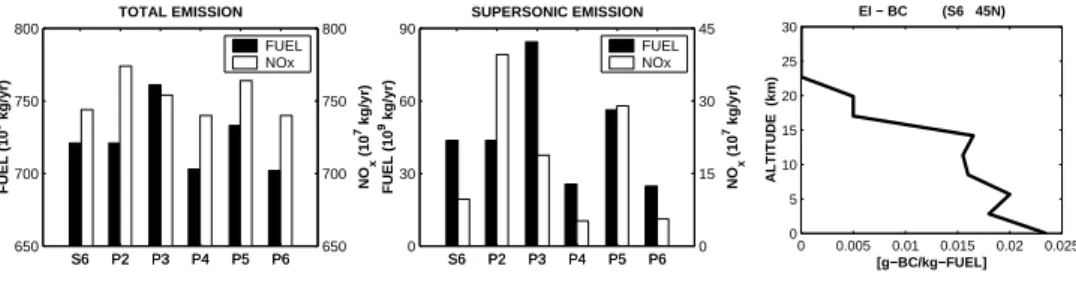
The emission inventories are given on a resolution of 1◦
×1◦ in the horizontal and 1000 ft, corresponding to 305 m, in the vertical. Fuel consumption and distance flown per year per grid cell are also included. Supersonic and total emission of fuel and NOx and EI-BC emission are shown in Fig. 1. From this figure, we see that an average emission index of 0.005 g/Kg-fuel is adopted for black carbon particles in the main
5
emission region of supersonic aircraft (17 to 20 km altitude), with a log-normal size distribution peaked at r=20 nm. Sulphur emissions are divided in two parts: 90% of gas phase SO2 (which is then oxidized to H2SO4 by stratospheric OH) and 10% of H2O-H2SO4ultrafine particles (r=5 nm).
4 Particle perturbations
10
4.1 Validation with stratospheric aerosol observations
ULAQ-CTM calculations of aircraft forced changes of the stratospheric surface area density of sulphate aerosols were used as input for other ACMs, in order to assess the sensitivity between models. The SCENIC emission data were interpolated onto ULAQ-CTM grid and the model was run from 2036 to 2055 with online aerosol microphysics,
15
for two simulations: (a) the pure subsonic and (b) the mixed-fleet case. Results for (a) and (b) were averaged from 2046 to 2055. The initial ten years were used to provide a spin-up period for the model and the following ten years were averaged to minimise interannual variability. The 3-D surface area density fields were then interpolated to a standard grid and made available to the other modellers in the SCENIC consortium.
20
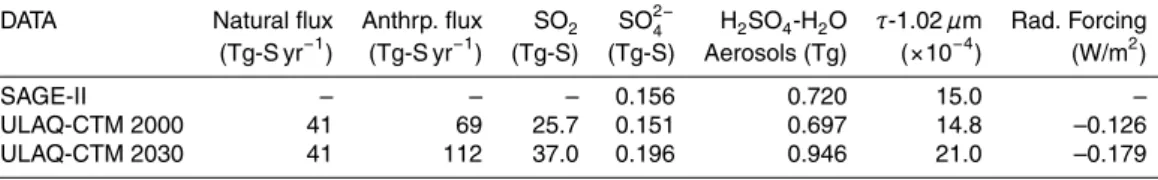
Table 2 summarizes the stratospheric SO2−4 responses when the anthropogenic flux is 69 Tg-S yr−1 for 2000 and is 112 Tg-S yr−1 for 2030. The natural flux is 41 Tg-S yr−1 (26 from DMS, 9.6 from non-explosive volcanoes, 5.4 from soils and biomass burning). The SAGE II derived mass, integrated above the tropopause, is 0.156 Tg-S with an optical depth of 15×10−4 at 1.02 µm and a total H
2SO4-H2O mass of 0.72 Tg (the
25
ACPD
8, 5091–5135, 2008 Radiative forcing from particle emissions by future supersonic aircraft G. Pitari et al. Title Page Abstract Introduction Conclusions References Tables Figures ◭ ◮ ◭ ◮ Back CloseFull Screen / Esc
Printer-friendly Version Interactive Discussion
used, including a 20% correction factor necessary to take into account the 2-km layer immediately above the tropopause, as suggested by the authors). ULAQ-CTM predicts 0.151 Tg-S for 2000 (0.196 Tg-S for 2030), including subsonic aircraft emissions of sulphur dioxide, which agrees well with 0.156 Tg-S, derived from observational data (see above). The radiative forcing reported in the last column of Table 2 is calculated
5
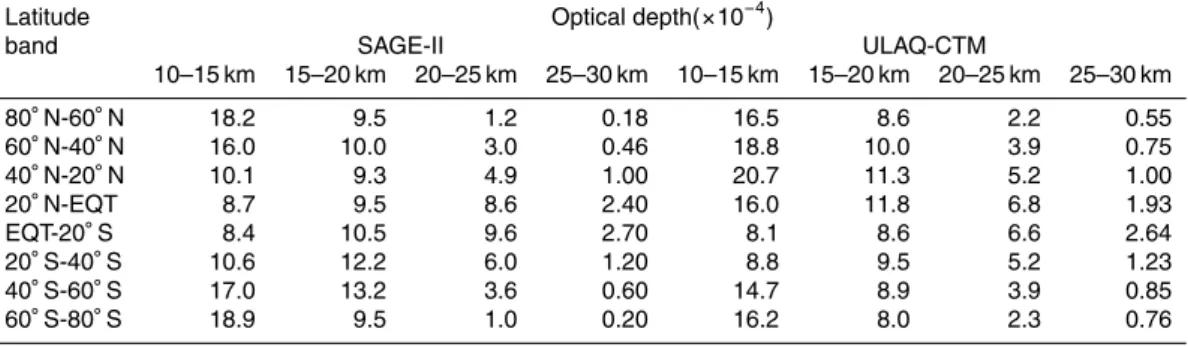
using a well-tested δ-Eddington code for solar radiation scattering (Pitari et al., 2002). Validation of ULAQ-CTM results for a variety of aerosol properties was made using satellite data (SAGE II, HALOE), averaged over volcanically quiet years. A comparison of aerosol optical depths calculated by ULAQ-CTM and those obtained from SAGE II measurements is shown in Table 3: at the tropopause layer (10–15 km) the
opti-10
cal depth has a minimum in the tropics and increases toward the polar regions; the model shows an overestimation of optical depth in the Northern Hemisphere subtropi-cal region, probably due to an unrealistic abundance of dust aerosols coming from the Sahara region. A flatter latitudinal gradient is found in the model results with respect to observations in the region above 25 km.
15
Extinction profiles calculated in the model for several wavelengths are compared to SAGE II and HALOE data (see Weisenstein et al., 2006). In the stratosphere the model shows good agreement at wavelengths in the visible and near infrared, whereas an un-derestimation, of about a factor of 3, is present at λ=5.26 µm above 20 km. The good model performance is confirmed by the comparison of annually and zonally averaged
20
field of sulphate aerosol surface area density (SAD) calculated by the model with the SAGE II derived values (not shown here). Model values are obtained from the cal-culated sulphate aerosol size distribution for particles larger then 0.05 µm, in order to include only the contribution of optically active aerosols in the geometric surface area density. The model is able to reproduce the SAD maximum (about 2×10⁻⁸cm−1) in
25
the layer between 10 and 13 km poleward of 40◦ of both hemispheres. Differences in the polar stratosphere may be due to polar subsidence and/or to local net production processes (homogeneous nucleation in polar vortex, nitric acid nucleation, etc.).
hori-ACPD
8, 5091–5135, 2008 Radiative forcing from particle emissions by future supersonic aircraft G. Pitari et al. Title Page Abstract Introduction Conclusions References Tables Figures ◭ ◮ ◭ ◮ Back CloseFull Screen / Esc
Printer-friendly Version Interactive Discussion
zontal distributions of the sulphate aerosols except for some overestimation of aerosol extinction in the upper troposphere in the subtropical regions and for a too flat latitudinal gradient above 25 km. The stratospheric underestimation of the far infrared extinction with respect to HALOE observation may be an indication of some inconsistencies in the particle size distribution, or of an inconsistency of the imaginary part of the
refrac-5
tion index chosen for the calculation of the Mie scattering efficiency (Weisenstein et al., 2006).
4.2 Mass and surface area density
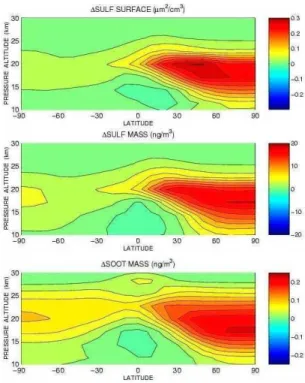
ULAQ-CTM calculated changes in sulphuric acid aerosol surface area and mass den-sities are shown in Fig. 2, as the result of including also supersonic aircraft emissions
10
of sulphur; the surface area density maximum values reach 0.3 µm2/cm3 in 2050 at about 20 km altitude in the North mid-latitudes (approximately 25% of the stratospheric background values). At the same location, the sulphuric acid aerosol mass density in-creases by 15 ng/m3(15% of the background values). Aircraft emissions of carbon soot particles may significantly affect the mass density of carbonaceous particles above the
15
tropopause, becoming potentially important for heterogeneous nucleation of sulphuric acid aerosols. The mass density changes of black carbon are shown in Fig. 2, bottom panel: the stratospheric increase is the direct impact of supersonic aircraft emissions (background values in the stratosphere are negligible).
Comparing these plots with those from other simulations (i.e. IPCC, 1999), it is clear
20
that the distribution of the contours is primarily produced by large scale transport of the ultrafine particles. The absolute magnitude of the change is much less than assumed in the IPCC report mainly for three reasons: (1) the total fuel emission here is much smaller than in the NASA-1992 emission scenarios for HSCT; (2) the assumed fraction of ultrafine particles formed in aircraft plumes is also much smaller here (10% instead
25
of 50%); (3) the emission height is lower, which reduces the residence time of the perturbation. The low soot emission index in the stratosphere (about 0.005 g/kg-fuel) makes the soot mass changes about 100 times smaller than the sulphuric acid mass
ACPD
8, 5091–5135, 2008 Radiative forcing from particle emissions by future supersonic aircraft G. Pitari et al. Title Page Abstract Introduction Conclusions References Tables Figures ◭ ◮ ◭ ◮ Back CloseFull Screen / Esc
Printer-friendly Version Interactive Discussion
increase.
4.3 Size distribution
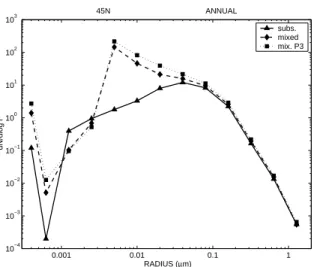
Supersonic aircraft emissions could perturb the global amount and the size distribution of sulphate aerosols mainly via direct plume emission of ultrafine particles (r≃5 nm). Figure 3 shows the aerosol size distribution at 45◦N calculated with ULAQ-CTM for
5
the subsonic fleet (S4) and the mixed fleet (subsonic+supersonic). The latter is for the baseline case (S6) and the doubled number of supersonic flights (P3). The effect of supersonic aircraft sulphur emission is to greatly increase the number of ultrafine particles. In addition, an enhanced accumulation mode is produced by the additional sulphur dioxide released on the large atmospheric scales. This additional sulphur
diox-10
ide enables sulphuric acid production following oxidation. The large increase in the ultrafine particle mode is expected to have a significant impact in the total particle sur-face area density available for heterogeneous chemical reactions.
5 Atmospheric impact
5.1 Radiative forcing
15
The University of L’Aquila general-circulation model (ULAQ-GCM) has been used to calculate the different components of the radiative forcing produced by future super-sonic aircraft, with the 2050 SCENIC emission scenarios (base and sensitivity, with and without aircraft generated SO4 and BC particles). A δ-Eddington approximation is used for evaluating solar radiation scattering/absorption in a multi-layer atmosphere.
20
O3, H2O, BC and SO4 fields are taken from ULAQ-CTM simulations. A more detailed study of the climate impact of supersonic air traffic, looking at the different GHGs and at the sensitivity to emission scenarios, is reported in Grewe at al. (2007).
Supersonic aircraft emit water vapour directly into the stratosphere with a time scale for removal of months to years. Additional water vapour can therefore accumulate
ACPD
8, 5091–5135, 2008 Radiative forcing from particle emissions by future supersonic aircraft G. Pitari et al. Title Page Abstract Introduction Conclusions References Tables Figures ◭ ◮ ◭ ◮ Back CloseFull Screen / Esc
Printer-friendly Version Interactive Discussion
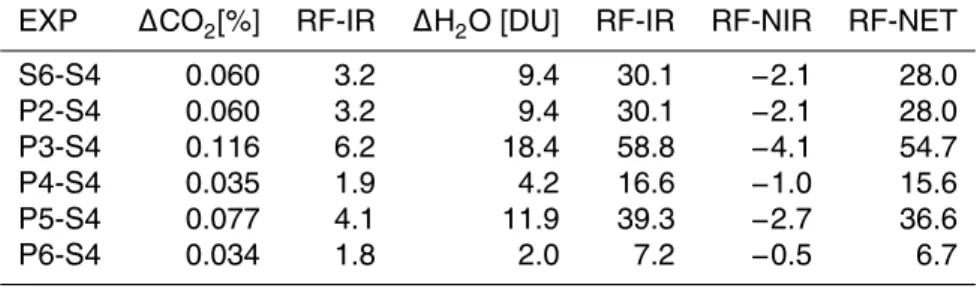
ducing two effects: a direct radiative effect with a consequent influence on climate; and a chemical perturbation of stratospheric ozone via HOxradicals and polar stratospheric clouds at high latitudes. Results from baseline and perturbed experiments suggest that increasing stratospheric water vapour is the dominant HSCT climatic impact, leading to a radiative forcing which ranges from approx. 7 to 55 mW/m2 (Table 4a). The
at-5
mospheric residence time of CO2is of the order of many decades, and as such CO2 emitted by the aircraft (proportional to the amount of fuel burnt) is well mixed in the atmosphere. The stratospheric excess of CO2 emitted by supersonic aircraft gives a RF ranging from about 2 to 6 mW/m2in the year 2050, with a date of HSCT in-service defined to 2015 (hypothesis used in SCENIC project). Results for the radiative
calcu-10
lations of CO2and H2O for base and perturbed scenarios are summarized in Table 4a. The net longwave flux of CO2 is computed using the method given by Ramanathan (1976). The longwave flux and absorptance for H2O are evaluated following Sasamori (1968) and Ramanathan et al. (1983). The calculation of the small amount of strato-spheric heating produced by absorption of solar radiation by H2O and CO2is performed
15
following the parameterizations used by Lacis and Hansen (1974) and Vardavas and Carver (1984) for the most important H2O and CO2 bands in the visible and near-IR range.
The ozone concentration is highly variable with altitude and is controlled by atmo-spheric chemistry and dynamics. NOx emissions by the aircraft accelerate local
pho-20
tochemical production or destruction of O3. The presence of aerosols also affect the chemical balance by providing surfaces on which chemical reactions involving chlorine and bromine compounds can proceed, an effect which is enhanced at lower tempera-tures. The radiative forcing due to ozone changes is greatest when the ozone changes occur near the tropopause, in the upper troposphere and lower stratosphere. In
gen-25
eral a loss of ozone in the UT/LS region will lead to a negative radiative forcing, and an increase to a positive forcing that would tend to warm the surface-troposphere sys-tem. The precise value is a function of the assumed shape of the ozone change with altitude and of the interaction with the ultraviolet and infrared parts of the spectrum. As
ACPD
8, 5091–5135, 2008 Radiative forcing from particle emissions by future supersonic aircraft G. Pitari et al. Title Page Abstract Introduction Conclusions References Tables Figures ◭ ◮ ◭ ◮ Back CloseFull Screen / Esc
Printer-friendly Version Interactive Discussion
shown in Foster and Shine (1997) and Hansen et al. (1997), O3in the troposphere and in the UT/LS acts mainly as a greenhouse gas, so that its interaction with longwave radiation dominates over solar UV absorption. At higher altitudes in the stratosphere the ozone interaction with incoming solar radiation becomes more important and dom-inates above about 30 km altitude. The radiative picture is even more complex since
5
the longwave impact of some changes is rather different in the troposphere and in the stratosphere. In the first case the RF is directly due to O3 changes in the 9.6 µm band (direct effect), whereas in the stratosphere O3perturbations trigger temperature changes which then magnify the instantaneous O3change and the longwave emissions by other greenhouse gases (indirect effect via stratospheric temperature adjustment).
10
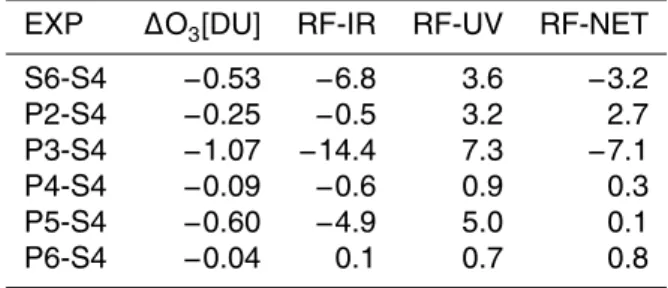
Changes in upper troposphere and lower stratosphere (UT/LS) ozone concentra-tions due to aircraft emissions are highly spatially variable, both regionally and verti-cally, making assessment of global long-term trends extremely difficult. We consider the ozone radiative forcing calculations in the UV and IR regions of the spectrum sepa-rately, and summarize these results in Table 4b. The infrared contribution to the cooling
15
rate in the O3–9.6 µm band has been evaluated following the assumption of cooling to space (Andrews et al., 1987); stratospheric temperatures are adjusted to the O3 per-turbation. O3absorption in the UV and visible wavelengths is calculated from tabulated solar fluxes and cross sections (WMO, 1985). Subsonic aircraft ozone perturbations lead to an increase of the global mean column, due to the increasing tropospheric
20
ozone photochemical production by NOx. Introduction of HSCT aircraft causes a strato-spheric depletion of O3, leading to a net contribution to global RF which ranges from about −7 to 3 mW/m2 (Table 4a). Issues related to model-dependent uncertainties in the ozone perturbation are discussed in the next section.
The direct impact of aircraft sulphate aerosols on the radiative forcing is negative
25
and produced by solar radiation scattering; in comparison direct RF in the longwave spectrum is negligible due to the small size of these particles (see Fig. 3). The param-eterization adopted is that described in Lacis et al. (1992): to a good approximation the climate forcing size dependence can be described by a single parameter, the
area-ACPD
8, 5091–5135, 2008 Radiative forcing from particle emissions by future supersonic aircraft G. Pitari et al. Title Page Abstract Introduction Conclusions References Tables Figures ◭ ◮ ◭ ◮ Back CloseFull Screen / Esc
Printer-friendly Version Interactive Discussion
weighted mean radius. The calculated global mean radiative forcing from sulphate aerosol emissions caused by a partlial substitution of subsonic by supersonic aircraft, ranges from about −23 to −4 mW/m2. Black carbon aerosols normally result in a posi-tive RF since they effecposi-tively also absorb incident solar radiation (the single scattering albedo is close to 0.7, whereas is unity for SO4 particles). As in the case of SO4,
5
the small size of aircraft particles produces a negligible RF in the longwave spectrum. The calculated global mean radiative forcing from aircraft emissions of BC ranges from about 0.4 to 11 mW/m2. All results for radiative calculations of BC and SO4aerosols for base and perturbed scenarios are summarized in Table 4c. The calculated total net RF in 2050 (CO2+H2O+O3+BC+SO4) is summarized in Table 4d for base and sensitivity
10
scenarios. The O3-RF (resulting from often partly compensating IR and UV contribu-tions) is highly variable among scenarios, due to different changes in the profile. In addition, this RF component can be greatly model-dependent, because of different cal-culated O3 profile changes (see Sect. 5.2). ULAQ-CTM tends to keep the emissions more confined than other models and this favours a small positive O3 perturbation
15
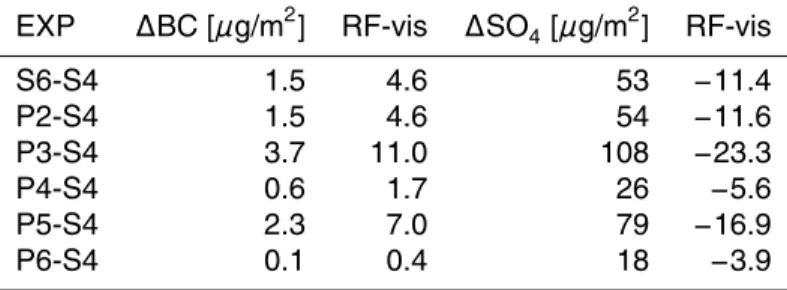
below about 20 km altitude (the so-called turnover point), without aircraft aerosols. Figure 4 summarizes the radiative forcing components in base and perturbed ex-periments as calculated with ULAQ-GCM. The calculated net climate forcing ranges from approximately 6 to 70 mW/m2. The smallest forcings are those associated with the reduction in Mach number (P4) and lower cruise altitude (P6). For ozone and total
20
net RF the change due to the introduction of aircraft particle emissions is shown, with respect to the case without particles. The effect of increasing the surface area density of sulphuric acid aerosols is to enhance the ozone depletion, producing an additional negative forcing, we refer to this as the aerosol indirect RF via heterogeneous chem-istry. It is important to note that this conclusion is reached using ULAQ-GCM radiative
25
code coupled to the ozone profile changes (S6–S4) predicted by ULAQ-CTM alone, since ULAQ-CTM is the only one among these models where the surface area density of sulphuric acid particles is predicted on-line together with O3, NOx, HOx, Clx and Brx. This allows the transport controlled accumulation of aircraft aerosols to remain
ACPD
8, 5091–5135, 2008 Radiative forcing from particle emissions by future supersonic aircraft G. Pitari et al. Title Page Abstract Introduction Conclusions References Tables Figures ◭ ◮ ◭ ◮ Back CloseFull Screen / Esc
Printer-friendly Version Interactive Discussion
consistent with the large-scale changes of the chemical species, which are a function of coupled emission-chemistry-transport mechanisms. The ozone sensitivity to the UT/LS aerosol perturbations, however, are different in other models, since the O3 re-sponse is not as spatially localized as the SSA-SAD rere-sponse, but it is related to that of NOx. The NOx perturbation, in turn, results from coupling of direct aircraft emissions,
5
large scale transport and chemical processing in the atmosphere. The latter is greatly affected by the additional sulphuric particles. The final O3change is connected to the net NOx perturbation and may also have different magnitude in independent models, depending on the strength of the Brewer-Dobson circulation.
Geographical distributions of aircraft BC and SO4accumulated mass burden and
ra-10
diative forcing are shown in Fig. 5 as the S6–S4 difference. As expected, the mass accumulation shows a pronounced interhemispheric asymmetry, since the majority of emissions are localized in the Northern Hemisphere lower stratosphere (see also Fig. 2). The distribution of flight routes is not evident due to the long particle lifetime in the UT/LS (more than 1 yr) which allows efficient horizontal dynamical mixing of the
15
tracers. Table 4c indicates that there is approximately a factor of 35 difference in SO4 and BC burden. Peak values of local concentrations (Fig. 2) show that the SO4/BC ratio is larger and reflects the emission index ratio: 0.4 g-SO2/kg-fuel versus 0.005 g-BC/kg-fuel (see Fig. 1). The smaller SO4/BC ratio in the vertically integrated column is due to the longer BC lifetime into the stratosphere, as the mass weighted mean radius of
20
carbonaceous particles is much smaller than for sulphuric acid aerosols (about 20 nm for BC versus about 200 nm for SO4).
The total radiative forcing of SO4and BC is of opposing sign due to prevailing radi-ation absorption from BC and scattering from sulphuric acid aerosols (here the single scattering albedo is close to unity). RF reflects the mass burden and peak values of
25
S6–S4 differences are approximately −35 mW/m2for SO4and +9 mW/m2for BC. Figure 6 shows the direct and indirect effect of the introduction of aircraft particle emissions. The globally integrated RF values in the left panel are those listed in Ta-ble 4c for S6–S4: the calculated net particle forcing is −6.8 mW/m2 and can be
com-ACPD
8, 5091–5135, 2008 Radiative forcing from particle emissions by future supersonic aircraft G. Pitari et al. Title Page Abstract Introduction Conclusions References Tables Figures ◭ ◮ ◭ ◮ Back CloseFull Screen / Esc
Printer-friendly Version Interactive Discussion
pared with −6.6 mW/m2 obtained subtracting the net ozone radiative forcing of S6* (without aircraft particles, BC+SO4) from the standard S6 simulation (which includes aircraft particle emissions). As discussed above for Fig. 4, these globally integrated RF-O3values are obtained using ULAQ-CTM results alone which will be subtly differ-ent from those calculated from other independdiffer-ent models. Figure 7 shows the (S6–S4)
5
net global RF per component. The bar indicates the range of model variability, since here O3and H2O profile changes have been taken from all four models participating in this work (see next section). H2O and sulphate give the largest contributions to RF (23 and −12 mW/m2, respectively) (Grewe et al., 2007).
5.2 Chemistry
10
The previous section introduced the climate forcing due to ozone changes produced by aircraft emissions of NOx, H2O and sulphate. As discussed, the magnitude and spatial distribution of ozone changes is strongly model-dependent since the transport of aircraft emissions from the source regions is dependent upon model configuration. This in turn impacts the chemically associated ozone perturbations from NOx, HOx
15
and Clx/Brx. In addition, even a similar ozone response in a defined atmospheric box (for example the lower-stratospheric NH mid latitudes where the HSCT emissions are a maximum) can result in a different global signature due to variations in the model Brewer-Dobson circulation. As such, it is important to fully consider the stratospheric behavior of ozone and related chemical species in different ACMs, in order to better
20
understand the degree of variability.
Figure 8 shows the model annually-averaged background (S4) profiles from the four participating ACMs for O3, NOx, ClO, BrO, OH and H2O. A comparison is made with climatological O3 values and NOx from 1993 HALOE data (NASA, 1999). All models show consistent agreement with the observations although SLIMCAT and OsloCTM2
25
models predict higher NOxvalues below 23 km. Some caution should however be used for the NOx observations at these altitudes, since NOx values in 1993 were still
influ-ACPD
8, 5091–5135, 2008 Radiative forcing from particle emissions by future supersonic aircraft G. Pitari et al. Title Page Abstract Introduction Conclusions References Tables Figures ◭ ◮ ◭ ◮ Back CloseFull Screen / Esc
Printer-friendly Version Interactive Discussion
enced by Pinatubo aerosols, which effectively converted NOx into HNO3. In addition, it should be taken into account that models are run for year 2050 chemical conditions, with increased N2O and hence NOy. A more detailed model validation using satellite observations is discussed in SCENIC (2005).
Perturbations of the chemical families directly affected by supersonic aircraft
emis-5
sions are presented in Figs. 9–10 (Fig. 9 does not include the effect of aircraft emitted sulphuric acid aerosols and black carbon). All models consistently show a NOx peak (NO+NO2) at 18 km with a magnitude ranging between 12 and 16%, together with a continual decrease of the perturbation towards zero at altitudes of approximately 12 and 30 km. As expected, the HOxchange (OH+HO2) is anti-correlated with NOx(−8 to
10
−4% at 18 km), since the OH sink from the OH+NO2+M reaction forming HNO3 dom-inates over the additional OH source from direct water vapour emissions by aviation. It should be noted that for the two models with a good vertical resolution of the whole stratosphere (SLIMCAT, ULAQ-CTM) a clear HOx increase is predicted above 22 km (∼+1.5% at 30 km altitude). Here the additional H2O source becomes more important
15
than the NOxinduced sink of HOx. As with HOx, ClO and BrO are also anticorrelated with NOx. The ClO, BrO sinks are due to formation of chlorine and bromine nitrates, respectively (ClO+NO2+M and BrO+NO2+M, forming ClONO2and BrONO2).
Inclusion of aerosol perturbations due to sulphur emissions by aviation has a sig-nificant impact on the results discussed above. Under these conditions the NOx
per-20
turbation is the net result of two opposing effects: (a) a direct increase due to aircraft emissions; and (b) a decrease due to enhanced chemical conversion into HNO3 via heterogeneous chemical reactions of N2O5 and BrONO2 on sulphuric acid particles (other heterogeneous chemical reactions are less important at mid-latitudes). Fig-ure 10 suggests that this balance may change with altitude, being a function of aircraft
25
NOx emissions, aerosol lifetimes and accumulation, and NOx partitioning (N2O5 in-creases with altitude). The peak in the NOx increase discussed in Fig. 9 is reduced due to the inclusion of aerosols by a factor of 3 (even more in OsloCTM2) and above 20 km the NOx decrease prevails in OsloCTM2 and SLIMCAT. In ULAQ-CTM the net
ACPD
8, 5091–5135, 2008 Radiative forcing from particle emissions by future supersonic aircraft G. Pitari et al. Title Page Abstract Introduction Conclusions References Tables Figures ◭ ◮ ◭ ◮ Back CloseFull Screen / Esc
Printer-friendly Version Interactive Discussion
NOxperturbation is always positive, although smaller than in Fig. 9. The E39/C model shows a smaller sensitivity to the additional sulphuric acid particles, with respect to the other models.
The resulting ozone perturbation is presented in Fig. 11. It is important to note that for ozone the effects related to the transport of NOx and H2O throughout the
strato-5
sphere are important, together with the transport of ozone itself (Rogers et al., 2002). With this in mind, it can be seen that the NH mid-latitude ozone profile changes (S6–S4) are consistent between the four models. The two models with a good vertical resolution of the whole stratosphere (SLIMCAT, ULAQ-CTM) predict a mid-upper stratospheric O3 depletion of the order of 0.2–0.5%. This mainly results from the HOx increase
10
discussed in Fig.9 and the upward transport of NOx emissions, the latter being more efficient in SLIMCAT (Rogers et al., 2002).
The calculated globally averaged O3 column change ranges between −0.08 and −0.75 Dobson Units. The variability of the modeled ozone perturbation (S6–S4) is the reason for the associated calculated range of RF reported in Fig. 7 (−0.3 to
15
−4.3 mW/m2).
A comparison of the inter-model consistency with regard to the chemical O3 destruc-tion in the HSCT emission region is made in Fig. 12. Here the annually averaged vertical profiles of O3 loss rates at 45◦N are compared in the pure subsonic case S4 for SLIMCAT and ULAQ-CTM. The comparison is made between 15 and 25 km, the
20
region of the majority of HSCT emissions. The two models show a high level of con-sistency (except for a higher HOx loss in ULAQ-CTM). This confirms that baseline O3 precursors and chemical rates adopted in these models are very similar. The reason for different responses of globally integrated O3to HSCT emissions is therefore due to inter-model differences in large-scale transport. This will produce significant changes
25
in the efficiency of NOx removal from the main emission region (i.e. NH mid-latitude in the lower stratosphere) into the mid-upper tropical stratosphere, where the largest absolute O3perturbation occurs.
ACPD
8, 5091–5135, 2008 Radiative forcing from particle emissions by future supersonic aircraft G. Pitari et al. Title Page Abstract Introduction Conclusions References Tables Figures ◭ ◮ ◭ ◮ Back CloseFull Screen / Esc
Printer-friendly Version Interactive Discussion
6 Conclusions
In this study we have shown results for four independent chemical-transport models used to assess the impact of future supersonic aircraft fleet on the chemical composi-tion of the stratosphere. The aim of the present work was to specifically examine the potential climatic impact of aerosol particles, directly injected by the aircraft or formed
5
after oxidation of gaseous precursors (namely SO2). The climate impact is quantified in terms of the radiative forcing metric. For the aerosols we have calculated both the direct forcing (i.e. scattering and absorption of incoming solar radiation) and indirect forcing produced by changes in chemical species (i.e. O3) affected by heterogeneous chemical processes on the surface of aerosol particles. Other indirect processes (for
10
example potential aerosol feedback on the formation of cirrus ice particles in the upper troposphere) have not been taken into account in this study.
The direct aerosol RF is calculated using the radiative code of ULAQ-GCM and the aerosol formation/growth modelling codes of ULAQ-CTM. The chemical feedback of sulphuric acid aerosols is rather complex to assess, since although the direct impact is
15
on the NOx/HNO3ratio, they also indirectly affect the concentration of HOx, Clx, Brxand finally O3, the latter being a key species for the atmospheric climate system. The four ACMs appear consistent in predicting the ozone perturbation due to a HSCT fleet in 2050, with a globally averaged column change, ranging between −0.08 and −0.75 DU. All models, except E39/C, predict an ozone decrease not only above 20 km altitude,
20
but also in the lower stratosphere (ranging between −0.2% and −1%). The calculated radiative forcing is found to range between −0.3 and −4.3 mW/m2.
From this modelling study, the impact of supersonic aircraft on sulphuric acid aerosol and BC mass burdens is calculated at 53 and 1.5 µg/m2, respectively, with a direct radiative forcing of −11.4 and 4.6 mW/m2, respectively. The indirect aerosol RF due to
25
ozone changes via perturbation of heterogeneous chemistry is highly variable among the models, and depends on the NOx removal efficiency from the aircraft emission re-gion by large scale transport (−6.6 mW/m2in ULAQ-GCM up to +1.8 mW/m2in
SLIM-ACPD
8, 5091–5135, 2008 Radiative forcing from particle emissions by future supersonic aircraft G. Pitari et al. Title Page Abstract Introduction Conclusions References Tables Figures ◭ ◮ ◭ ◮ Back CloseFull Screen / Esc
Printer-friendly Version Interactive Discussion
CAT). As calculated with ULAQ-GCM, the aerosol indirect chemical RF is comparable to the direct RF, both in magnitude and sign. The total net particle-related RF is also found to be the largest component of RF from supersonic aircraft after that of strato-spheric water vapour.
Acknowledgements. We acknowledge the European Commission for providing funds for this
5
work, under contract EVK2-CT2001-00103 (SCENIC). More information on SCENIC related
work can be found onhttp://www-scenic.ch.cam.ac.uk/and in the SCENIC (2005) final report.
References
Andrews, D. G., Holton, J. R., and Leovy, C. B.: Middle atmosphere Dynamics, Academic Press, 490 pp., 1987.
10
Berntsen, T. and Isaksen, I. S. A.: A global 3-d chemical transport model for the troposphere, 1, model description and co and ozone results, J. Geophys. Res., 102, 21 239–21 280, 1997. Brunner, D., Staehelin, J., Rogers, H., K ¨ohler, M., Pyle, J., Hauglustaine, D., Jourdain, L.,
Berntsen, T. K., Gauss, M., Meijer, I. I. E., van Velthoven, P., Pitari, G., Mancini, E., Grewe, V., and Sausen, R.: An evaluation of the performance of chemistry transport models by
com-15
parison with research aircraft observations, Part I: Concepts and overall model performance. Atmos. Chem. Phys., 3, 1609–1631, 2003,
http://www.atmos-chem-phys.net/3/1609/2003/.
Brunner, D., Staehelin, J., Rogers, H., K ¨ohler, M., Pyle, J., Hauglustaine, D., Jourdain, L., Berntsen, T. K., Gauss, M., Meijer, I. I. E., van Velthoven, P., Pitari, G., Mancini, E., Grewe,
20
V., and Sausen, R.: An evaluation of the performance of chemistry transport models, Part II: Detailed comparison with two selected campaigns, Atmos. Chem. Phys., 5, 107–129, 2005,
http://www.atmos-chem-phys.net/5/107/2005/.
Chipperfield, M., Blom, C., Glatthor, N., H ¨opfner, M., Gulde, T., Piesch, C., and Simon, P.: Variability of clono 2 in the arctic polar vortex: Comparison of transall mipas measurements
25
and 3d model results, J. Geophys. Res., 100, 9115–9129, 1995.
Chipperfield, M., Santee, M., Froidevaux, L., Manney, G., Read, W., Waters, J., Roche, A., and Russell, J.: Analysis of uars data in the southern polar vortex in September 1992 using a chemical transport model, J. Geophys. Res., 101, 18 861–18 881, 1996.
ACPD
8, 5091–5135, 2008 Radiative forcing from particle emissions by future supersonic aircraft G. Pitari et al. Title Page Abstract Introduction Conclusions References Tables Figures ◭ ◮ ◭ ◮ Back CloseFull Screen / Esc
Printer-friendly Version Interactive Discussion
Chipperfield, M. and J. Pyle: Model sensitivity studies of arctic ozone depletion, J. Geophys. Res., 103, 28 389–28 403, 1998.
Dameris, M., Grewe, V., Ponater, M., Deckert, R., Eyring, V., Mager, F., Matthes, S., Schnadt, C., Stenke, A., Steil, B., Br ¨ul, C., and Giorgetta, M. A.: Long-term changes and variability in a transient simulation witha chemistry-climate model employing realistic forcing, Atmos.
5
Chem. Phys., 5, 2121–2145, 2005,
http://www.atmos-chem-phys.net/5/2121/2005/.
ECMWF, 2004: IFS documentation CY28R1, The ECMWF Integrated Forecast System (IFS). Foster, P.M. F. and Shine, K. P.: Radiative forcing and temperature trends from stratospheric
ozone changes, J. Geophys. Res., 102, 10 841–10 857, 1997.
10
Gauss, M., Isaksen, I. S. A., Wong, S., and Wang, W.: Impact of H2O emissions from
cryoplanes and kerosene aircraft on the atmosphere, J. Geophys. Res., 108, 4304, doi:10.1029/2002JD002623, 2003.
Gauss, M, Isaksen, I. S. A., Lee, D. S., and Søvde, O. A.: Impact of aircraft NOx emissions
on the atmosphere – tradeoffs to reduce the impact, Atmos. Chemi. Phys., 6, 1529–1548,
15
2006.
Grewe, V., Dameris, M., Fichter, C., and Sausen, R.: Part 1: Interactively coupled climate-chemistry simulations and sensitivities to climate-climate-chemistry feedback, lightning and model resolution, Meteorol. Z., 3, 177–186, 2002.
Grewe, V., Stenke, A., Ponater, M., Sausen, R., Pitari, G., Iachetti, D., Rogers, H., Dessens, O.,
20
Pyle, J., Isaksen, I. S. A., Gulstad, L., Søvde, O. A., Marizy, C., and Pascuillo, E.: Climate impact of supersonic air traffic: an approach to optimize a potential future supersonic fleet -results from the EU-project SCENIC, Atmos. Chem. Phys., 7, 5129–5145, 2007,
http://www.atmos-chem-phys.net/7/5129/2007/.
Hansen, J., Sato, M., and Ruedy, R.: Radiative forcing and climate response, J. Geophys. Res.,
25
102, 6831–6864, 1997.
Hein, R., Dameris, M., Schnadt, C., Land, C., Grewe, V., K ¨ohler, Ponater, I. M., Sausen, R., Steil, B., Landgraf, J., and Br ¨uhl, C.: Results of an interactively coupled atmospheric chem-istry - general circulation model: Comparison with observations, Ann. Geophysicae, 19, 435– 457, 2001.
30
Hesstvedt, E., Hov, O., and Isaksen, I.: Quasi steady-state approximation in air pollution mod-elling: Comparison of two numerical schemes for oxidant prediction, Int. J. Chem. Kinet., X, 971–994, 1978.
ACPD
8, 5091–5135, 2008 Radiative forcing from particle emissions by future supersonic aircraft G. Pitari et al. Title Page Abstract Introduction Conclusions References Tables Figures ◭ ◮ ◭ ◮ Back CloseFull Screen / Esc
Printer-friendly Version Interactive Discussion
Holtslag, A. A. M., DrBruijn, E. I. F., and Pan, H.-L.: A high resolution air mass transformation model for short-range weather forecasting, Mon. Weather Rev., 118, 1561–1575, 1990. Isaksen, I., Rognerud, B., Stordal, F., Coffey, M. T., and Mankin, W. G.: Studies of arctic
stratospheric ozone in a 2-d model including some effects of zonal asymmetries, Geophys. Res. Lett., 17, 557–560, 1990.
5
IPCC, Special report on aviation and the global atmosphere, edited by: Penner, J. E., Lister, D. H., Griggs, D. J. et al., Cambridge University Press, Cambridge, 373 pp., 1999.
JPL, Chemical kinetics and photochemical data for use in stratospheric modelling, JPL publ. 97-4, Pasadena, California, 1997.
Kent, G. S. and McCormick, M. P.: SAGE and SAM II measurements of global stratospheric
10
aerosol optical depth and mass loading, J. Geophys. Res., 89, 5303–5314, 1984.
Lacis, A. and Hansen, J. E.: A parameterization for the absorption of solar radiation in the Hearths atmosphere, J. Atmos. Sci., 31, 118–133, 1974.
Lacis, A., Hansen, J., and Sato, M.: Climate forcing by stratospheric aerosols, Geophys. Res. Lett., 19, 1607–1610, 1992.
15
Land, C., Feichter, J., and Sausen, R.: Impact of the vertical resolution on the transport of passive tracers in the echam4 model, Tellus B, 54, 344–360, 2002.
NASA, The atmospheric effects of stratospheric aircraft: A first program report, edited by: Prater, M. J. et al., NASA Ref. Publ. 1272, 1992.
NASA, Model and Measurements intercomparison II, edited by: Park, J. H. et al.,
NASA/TM-20
1999-209554, 1999.
Pitari, G., Rizi, V., Ricciardulli, L., and Visconti, G.: High speed civil transport impact: role of sul-phate, nitric and trihydrate, and ice aerosol studied with a two-dimensional model including aerosol physics, J. Geophys. Res., 98, 23 141–23 164, 1993.
Pitari, G. and Mancini, E.: Climatic impact of future supersonic aircraft: role of water vapour
25
and ozone feedback on circulation, Phys. Chem. Earth PT C, 26/8, 571–576, 2001.
Pitari, G., Mancini, E., Bregman, A., Rogers, H. L., Sundet, J. K., Grewe, V., and Dessens, O.: Sulphate particles from subsonic aviation: Impact on upper tropospheric and lower strato-spheric ozone, Phys. Chem. Earth PT C, 26/8, 563–569, 2001.
Pitari, G., Mancini, E., Rizi, V., and Shindell, D. T.: Impact of future climate and emission
30
changes on stratospheric aerosols and ozone. J. Atmos. Sci., 59, 414–440, 2002.
Pitari, G., Mancini, E., Rogers, H. L., Dessens, O., Isaksen, I., and Rognerud, B.: A 3-D model intercomparison of the effects of future Supersonic aircraft on the chemical composition of the
ACPD
8, 5091–5135, 2008 Radiative forcing from particle emissions by future supersonic aircraft G. Pitari et al. Title Page Abstract Introduction Conclusions References Tables Figures ◭ ◮ ◭ ◮ Back CloseFull Screen / Esc
Printer-friendly Version Interactive Discussion
stratosphere, Proceedings of the 2003 AAC-Conference, Friedrichshafen, Germany, 166– 172, 2004.
Prather, M.: Numerical advection by conservation of second-order moments, J. Geophys. Res., 91, 6671–6681, 1986.
Pyle, J., Chipperfield, M., Kilbane-Dawe, I., Lee, A., Stimpe, R., Kohn, D., Renger, W., and
Wa-5
ters, J.: Early modelling results from the sesame and ASHOE campaigns, Faraday Discuss., 100, 371–387, 1995.
Ramanathan, V.: Radiative transfer within the Earths troposphere and stratosphere: A simpli-fied radiative convective model, J. Atmos. Sci., 33, 1330–1346, 1976.
Ramanathan, V., Pitcher, E. J., Malone, R. C., and Blackmon, M. L.: The response of a spectral
10
general circulation model to refinements in radiative processes, J. Atmos. Sci., 40, 605–630, 1983.
Reithmeier, C. and Sausen, R.: ATTILA – Atmospheric Tracer transport in a Lagrangian Model, Tellus B, 54(3), 278–299, 2002.
Rogers, H. L., Chipperfield, M., Bekki, S., and Pyle, J.: The effects of future supersonic
air-15
craft on stratospheric chemistry modelled with varying meteorology, J. Geophys. Res., 105, 29 359–29 369, 2000.
Rogers, H. L., Teyssedre, H., Pitari, G., Grewe, V., van Velthoven, P., and Sundet, J.: Model intercomparison of the transport of aircraft-like emissions from sub- and supersonic aircraft, Meteorol. Z., 11, 151–159, 2002.
20
Rummukainen, M., Isaksen, I., Rognerud, B., and Stordal, F.: A global model tool for three-dimensional multiyear stratospheric chemistry simulations: Model description and first re-sults, J. Geophys. Res., 104, 26 437–26 456, 1990.
Rummukainen, M.: Modeling stratospheric chemistry in a global three-dimensional chemical transport model, sctm-1. Model development, Finnish Meteorological Institute Contributions,
25
no. 19, p. 206, 1996.
Sasamori, T.: The radiative cooling calculation for application to general circulation experi-ments, J. Appl. Meteorol., 7, 721–729, 1968.
SCENIC: Scenario of aircraft emissions and impact studies on chemistry and climate, EU con-tract EVK2-2001-00103 (2002–2005), final report, 2005.
30
Steil, B., Dameris, M., Br ¨uhl, C., Crutzen, P., Grewe, V., Ponater, M., and Sausen, R.: De-velopment of a chemistry module for GCMs: first results of a multiannual integration, Ann. Geophysicae, 16, 205–228, 1998.
ACPD
8, 5091–5135, 2008 Radiative forcing from particle emissions by future supersonic aircraft G. Pitari et al. Title Page Abstract Introduction Conclusions References Tables Figures ◭ ◮ ◭ ◮ Back CloseFull Screen / Esc
Printer-friendly Version Interactive Discussion
Stenke, A., Grewe, V., and Ponater, M.: Lagrangian transport of water vapor and cloud water in the ECHAM GCM and its impact on the cold bias, Clim. Dynam., doi:10.1007/S00382-007-0347-5, 2007.
Stenke, A., Grewe, V., and Pechtl, S.: Do supersonic aircraft avoid contrails?, Atmos. Chem. Phys., 8, 955–967, 2008,
5
http://www.atmos-chem-phys.net/8/955/2008/.
Stordal, F., Isaksen, I., and Horntvedt, K.: Adiabatic circulation two-dimensional model with photochemistry: Simulations of ozone and long-lived tracers with surface sources, J. Geo-phys. Res., 90, 5757–5776, 1985.
Sundet, J. K.: Model studies with a 3-d global CTM using ECMWF data, Ph.D. thesis, University
10
of Oslo Norway, 1997.
Tiedtke, M. A.: Comprehensive mass UX scheme for cumulus parameterization on large scale models, Mon. Weather Rev., 117, 1779–1800, 1989.
TRADEOFF: Tradeoff aircraft emissions: Contributions of various climate compounds to changes in composition and radiative forcing – tradeoff to reduce atmospheric impact,
EU-15
contract EVK2-CT-1999-0030 (2000–2003), final report, 2003.
Vardavas, I. M. and Carver, J. H.: Solar and terrestrial parameterizations for radiative-convective models, Planet. Space Sci., 32, 1307–1325, 1984.
Weisenstein, D., Bekki, S., Pitari, G., Timreck, C., and Mills, M.: WCRP/SPARC scientific as-sessment of stratospheric aerosol properties; Chapter 6: Modeling of stratospheric aerosols,
20
edited by: Thomason, L. and Peter, T., WCRP-124, WMO/TD-1295, SPARC report no. 4, 2006.
Williamson, D. L. and Rasch, P. J.: Water vapour transport in the NCAR CCM2, Tellus, 46A, 34–51, 1993.
WMO: Atmospheric Ozone-1985, WMO- Global Ozone Res. Monit. Proj. Rep. 16, Vol.1, World
25
ACPD
8, 5091–5135, 2008 Radiative forcing from particle emissions by future supersonic aircraft G. Pitari et al. Title Page Abstract Introduction Conclusions References Tables Figures ◭ ◮ ◭ ◮ Back CloseFull Screen / Esc
Printer-friendly Version Interactive Discussion
Table 1. Supersonic aircraft configuration and associated commercial traffic for each 2050
mixed fleet scenario. (Scenario S4 corresponds to the pure subsonic case. MTOW=maximum take-off weight, N.M.=nautical mile, RPK=revenue passenger kilometer.)
EXP S6 P2 P3 P4 P5 P6
Supersonic configuration SAC1 SAC2 SAC1 SAC4 SAC3 SAC5 Number of supersonic aircraft 501 501 972 544 558 561 Supersonic cruise speed (Mach) 2.0 2.0 2.0 1.6 2.0 1.6 Supersonic max range (N.M.) 5500 5500 5500 6000 5950 5950 Supersonic cruise min 55 000 55 000 55 000 49 000 55 000 45 000 altitude (ft) max 65 000 65 000 65 000 59 000 65 000 55 000
Supersonic MTOW (tons) 340 340 340 340 408 340
Mean EI(NOx) in supersonic cruise 5 10 5 5 5 5
Number of routes subsonic 29 336 29 336 29 336 29 336 29 336 29 336
supersonic 292 292 323 249 338 249
Mean supersonic market penetration 23.41 23.41 43.88 24.12 22.66 24.12 on selected routes (%)
Number of commercial subsonic 110 189 110 189 109 859 110 257 110 148 110 257 passengers flights supersonic 608.6 608.6 1198.5 490.4 681.8 490.4 (*1e+03) total 110 798 110 798 111 058 110 747 110 830 110 747 Traffic evaluation subsonic 17.11 17.11 16.45 17.15 17.01 17.15 (*1e+12 RPK) supersonic 0.73 0.73 1.41 0.69 0.83 0.69 total 17.84 17.84 17.86 17.83 17.84 17.84
ACPD
8, 5091–5135, 2008 Radiative forcing from particle emissions by future supersonic aircraft G. Pitari et al. Title Page Abstract Introduction Conclusions References Tables Figures ◭ ◮ ◭ ◮ Back CloseFull Screen / Esc
Printer-friendly Version Interactive Discussion
Table 2. Stratospheric sulphate aerosol budget: mass, optical depth and tropopause shortwave
Radiative Forcing.
DATA Natural flux Anthrp. flux SO2 SO2−4 H2SO4-H2O τ-1.02 µm Rad. Forcing (Tg-S yr−1) (Tg-S yr−1) (Tg-S) (Tg-S) Aerosols (Tg) (×10−4) (W/m2
)
SAGE-II – – – 0.156 0.720 15.0 –
ULAQ-CTM 2000 41 69 25.7 0.151 0.697 14.8 –0.126 ULAQ-CTM 2030 41 112 37.0 0.196 0.946 21.0 –0.179
ACPD
8, 5091–5135, 2008 Radiative forcing from particle emissions by future supersonic aircraft G. Pitari et al. Title Page Abstract Introduction Conclusions References Tables Figures ◭ ◮ ◭ ◮ Back CloseFull Screen / Esc
Printer-friendly Version Interactive Discussion
Table 3. Annual mean stratospheric aerosol depth (λ=0.12 µm).
Latitude Optical depth(×10−4)
band SAGE-II ULAQ-CTM
10–15 km 15–20 km 20–25 km 25–30 km 10–15 km 15–20 km 20–25 km 25–30 km 80◦N-60◦N 18.2 9.5 1.2 0.18 16.5 8.6 2.2 0.55 60◦N-40◦N 16.0 10.0 3.0 0.46 18.8 10.0 3.9 0.75 40◦N-20◦N 10.1 9.3 4.9 1.00 20.7 11.3 5.2 1.00 20◦N-EQT 8.7 9.5 8.6 2.40 16.0 11.8 6.8 1.93 EQT-20◦S 8.4 10.5 9.6 2.70 8.1 8.6 6.6 2.64 20◦S-40◦S 10.6 12.2 6.0 1.20 8.8 9.5 5.2 1.23 40◦S-60◦S 17.0 13.2 3.6 0.60 14.7 8.9 3.9 0.85 60◦S-80◦S 18.9 9.5 1.0 0.20 16.2 8.0 2.3 0.76