HAL Id: hal-01893852
https://hal.archives-ouvertes.fr/hal-01893852
Submitted on 6 May 2021HAL is a multi-disciplinary open access archive for the deposit and dissemination of sci-entific research documents, whether they are pub-lished or not. The documents may come from teaching and research institutions in France or abroad, or from public or private research centers.
L’archive ouverte pluridisciplinaire HAL, est destinée au dépôt et à la diffusion de documents scientifiques de niveau recherche, publiés ou non, émanant des établissements d’enseignement et de recherche français ou étrangers, des laboratoires publics ou privés.
Distributed under a Creative Commons Attribution| 4.0 International License
trophic regimes in oceanic waters
Kadija Oubelkheir, Hervé Claustre, Antoine Sciandra
To cite this version:
Kadija Oubelkheir, Hervé Claustre, Antoine Sciandra. Bio-optical and biogeochemical properties of different trophic regimes in oceanic waters. Limnology and Oceanography Bulletin, American Society of Limnology and Oceanography, 2005, 50 (6), pp.1795 - 1809. �10.4319/lo.2005.50.6.1795�. �hal-01893852�
1795
Bio-optical and biogeochemical properties of different trophic regimes
in oceanic waters
Kadija Oubelkheir, Herve´ Claustre,
1Antoine Sciandra, and Marcel Babin
Laboratoire d’Oce´anographie de Villefranche-sur-Mer, CNRS and Universite´ Pierre et Marie Curie, 06238 Villefranche-sur-Mer, France
Abstract
To examine the source and magnitude of the variability of bio-optical properties in open ocean, we simultaneously measured inherent optical properties (IOPs) and biogeochemical quantities during late summer from the eutrophic waters of the Moroccan upwelling to the oligotrophic waters of the northwestern Mediterranean and the ultraoli-gotrophic waters of the eastern Mediterranean. Vertical distributions of spectral absorption and attenuation coeffi-cients were measured with a high-resolution in situ spectrophotometer (WETLabs ac9) together with biogeochemical measurements that included phytoplanktonic pigments and particulate organic carbon concentrations, particle size distributions, and picoplankton abundance. The variability in specific IOPs (i.e., per unit of biogeochemical con-stituent concentration) was examined, and an optical index of particle size was derived. The fine-scale vertical distributions of various biogeochemical properties were thus described from ac9 profiles. Particle attenuation and carbon budgets, estimated from a combination of optical and biogeochemical measurements, underlie a major contribution of nonalgal stocks in oceanic waters. We show that first-order variations in IOPs in oceanic waters are explained by the trophic state (i.e., chlorophyll a concentration) and that second-order variations are the result of changes in the composition of phytoplankton assemblage, the balance between algal and nonalgal stocks, and light-related processes (colored dissolved organic material photo-oxidation and algal photo-adaptation).
At the interface between marine optics and biogeochem-istry, bio-optical studies (Smith and Baker 1978) aim to characterize the biological and biogeochemical state of nat-ural waters through their optical properties, and to quantify the role of the ocean in global biogeochemical (particularly carbon) budgets. These studies rely on the direct dependence of the water’s inherent optical properties (IOPs) and apparent optical properties on the concentration and nature of opti-cally significant biogeochemical constituents. In open ocean case I waters (Morel and Maritorena 2001 and references therein), these constituents are, by definition, phytoplankton and their accompanying and covarying retinue of material with biological origin, namely nonalgal particles (including biogenous detritus and heterotrophic organisms) and yellow substances (so-called colored dissolved organic material [CDOM]). Thus, optical properties generally are modeled as a function of chlorophyll a concentration (Chl a; used as a proxy for phytoplankton) in generic remote sensing algo-rithms for case I waters (Morel and Maritorena 2001 and
1To whom correspondence should be addressed (claustre@ obs-vlfr.fr).
Acknowledgments
We are grateful to Jose´phine Ras and Jean Claude Marty for their contribution to pigment analysis and particulate absorption mea-surements and to Patrick Raimbault and Nicole Garcia for particu-late organic carbon data. We also thank the crews of RV Thalassa for their support during field operations. We are grateful to Domi-nique Tailliez for CTD data acquisition and processing and to Ber-nard Gentili and Frank Fell for efficient discussions on computa-tions. The ac9 data processing was conducted using the ADAM software (AC9 Data Manager; Informus GmbH). We also thank Andre´ Morel for fruitful discussions on an earlier draft. Comments by Emmanuel Boss and Grace Chang are acknowledged. K.O. ben-efited from a CNRS/Re´gion PACA grant. This is a contribution of the PROSOPE group (PROOF-JGOFS-France).
references therein). Such a simplified statement is, in a first approximation, verified on a global scale, but some nuances in the definition of case I waters must be introduced on a regional scale as the likely result of biogeochemical pecu-liarities at such levels (Morel and Maritorena 2001; Bricaud et al. 2002; D’Ortenzio et al. 2002). For a more accurate estimation of biogeochemical stocks from in situ or remote optical measurements, it is thus necessary to understand the source and magnitude of these regional specificities.
Total IOPs are the result of the additive contribution of light absorption and scattering by the individual optically significant constituents in the water. Absorption and scatter-ing coefficients generally display specific spectral features or dependencies that might, in turn, be used to estimate the contribution of each constituent to the bulk measurement. Such deconvolution procedures rely on either experimental or numerical methods (Kishino et al. 1985; Gallegos and Neale 2002 and references therein; Schofield et al. 2004). After deconvolution, partial optical coefficients can be re-lated to meaningful biogeochemical quantities if specific IOPs (i.e., IOPs per unit constituent concentration) are known. Thus, it is essential to fully understand and ulti-mately predict the regional and temporal variability of the relationships between optical properties and biogeochemical quantities.
Measurement of biogeochemical parameters, such as Chl
a and organic carbon (particulate organic carbon [POC] and
dissolved organic carbon [DOC] fractions) is essential for the description of spatiotemporal oceanic provinces and re-gional biogeochemical modeling for carbon-cycling studies. The variability in specific IOPs results from various sources. The variability in the Chl a–specific absorption coefficient of natural phytoplankton populations is statistically related to the trophic state (i.e., Chl a concentration) in oceanic wa-ters, so Chl a–based parameterizations have been proposed
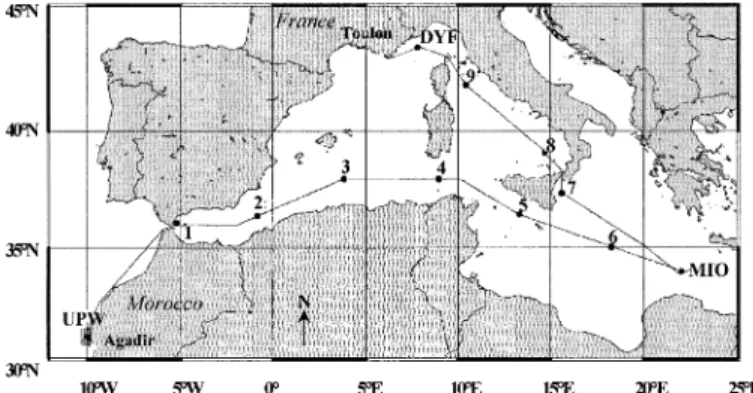
Fig. 1. Location of the stations visited during the PROSOPE cruise, from 4 September 1999 (Agadir, Morocco) to 4 October 1999 (Toulon, France). Two main types of stations were occupied: nine short stations (Sta. 1–9; occupied for 4 h around the solar noon) and three long stations (UPW, DYF, and MIO; occupied for more than 2 d). The line between stations represents the cruise track.
to estimate this coefficient spectrally (Bricaud et al. 1995a, 1998). The DOC-specific dissolved absorption coefficient is highly variable in coastal and oceanic waters (Blough and Green 1995; Ferrari 2000; and references therein), mainly as a result of changes in the origin of dissolved material (ter-restrial vs. oceanic) and CDOM photo-oxidation (into opti-cally inactive forms of DOC) under high surface irradiances in stratified systems (Vodacek et al. 1997; Nelson et al. 1998). Recently, the effects of ultraviolet and visible radia-tion on the optical properties of CDOM were examined to model photo-oxidation kinetics in natural waters (Del Vec-chio and Blough 2002). Finally, the variability in the POC-specific particle attenuation coefficient has been studied in various open ocean areas (Loisel and Morel 1998; Kinkade et al. 1999; Gardner et al. 2003 and references therein) using in situ single-wavelength transmissiometers. Mishonov et al. (2003) recently underlined a small spatial and seasonal var-iability in this coefficient based on a data set covering a large range of trophic states.
Until recently, measurements of IOPs were performed us-ing either laboratory spectrophotometers or in situ sus-ingle- single-wavelength optical devices (e.g., transmissiometers) in pro-filing mode to obtain spatial information with high resolution. The introduction of devices such as the spectral absorption-attenuation meter (WETLabs ac9 for nine wave-lengths) has permitted the measurement of spectral absorp-tion and attenuaabsorp-tion coefficients in situ with a high spatial and temporal resolution (e.g., Bricaud et al. 1995b; Sosik et al. 2001; Twardowski and Donaghay 2001; Chang et al. 2002). Inverting IOPs measured by in situ spectrophotome-ters used in profiling mode into biogeochemical quantities is therefore a promising approach for addressing biogeochem-ical variability at observation scales that until now have been unattainable by conventional measurements (Barth and Bog-ucki 2000; Claustre et al. 2000). Determination of IOP pro-files (using ac9s) together with discrete biogeochemical de-terminations have been conducted in coastal waters (Boss et al. 2001b; D’Sa and Miller 2003) and, more scarcely, open ocean waters (e.g., Claustre et al. 2000). The bio-optical var-iability of oceanic waters remains to be characterized over a large range of trophic states, which are representative of the expected variability in these waters.
The present study contributes to filling this gap. We an-alyzed an extensive data set of in situ spectral IOPs and biogeochemical measurements for a variety of open ocean waters, from the eutrophic waters of the Moroccan upwelling (UPW) to the ultraoligotrophic waters typical of the eastern Mediterranean. In situ continuous profiling of total and dis-solved spectral absorption and attenuation coefficients was performed together with a suite of discrete optical and bio-geochemical determinations, including phytoplankton pig-ments and POC concentrations, particle size distributions, and picoplankton numerical abundance. The resulting data set includes up to 1,000 samples for some discrete quantities and covers a large range of trophic states (greater than two orders of magnitude for many surface measurements), thus enabling us to address three essential topics: (1) the descrip-tion of the variability in specific IOPs to understand how IOPs are shaped by biogeochemical stocks and, reciprocally, to what extent these stocks can be inferred from in situ
pro-files of IOPs; (2) the comparative description at a fine ver-tical resolution of the bio-opver-tical properties of three different trophic regimes in the context of prevailing environmental conditions; and (3) the building of a budget for the contri-bution by individual particle stocks (algal, heterotrophic, and detrital) to particle attenuation and, ultimately, POC stock, which is a key parameter in studies of the global carbon cycle. As a result of the diversity of trophic states covered by the present investigation (surface total Chl a concentra-tion range, 0.03–3.75 mg Chl a m23), it is expected that the acquired data set will allow us to draw general inferences relevant to open ocean waters.
Materials and methods
Sampled sites—Hydrographic, bio-optical, and
biogeo-chemical data were simultaneously acquired from 4 Septem-ber 1999 to 4 OctoSeptem-ber 1999 aboard RV Thalassa during the PROSOPE cruise (French acronym for ‘‘PROductivite´ des Syste`mes Oce´aniques PElagiques,’’ or ‘‘productivity of oce-anic pelagic systems’’). Two main types of stations were investigated (Fig. 1): (1) nine ‘‘short’’ stations (sampled for 4 h around the solar noon; Stations (Sta.) 1–9), and (2) three ‘‘long’’ stations (sampled for more than 2 d) in the UPW, the Ionian Sea (MIO), and the northwestern Mediterranean (DYF for Dyfamed site, the JGOFS French time-series site in the Mediterranean). The UPW will also be referred to as upwelling, and MIO and DYF will together be referred to as Mediterranean throughout the text.
Ac9 data acquisition—Two WETLabs ac9s were used to
measure spectral attenuation and absorption coefficients at nine wavelengths (412, 440, 488, 510, 532, 555, 630, 676, and 715 nm). One was equipped with a 0.2-mm Gelman Suporcap filter at the inlet of the measuring tubes to deter-mine dissolved material optical coefficients (ag(l) and cg(l),
notations in Table 1). The ac9s were attached to a Seabird carrousel equipped with 21 Niskin sampling bottles (12 li-ters), a Seabird 911-Plus CTD, and a Chelsea fluorometer. This package was deployed between 0 and 400 m for Sta.
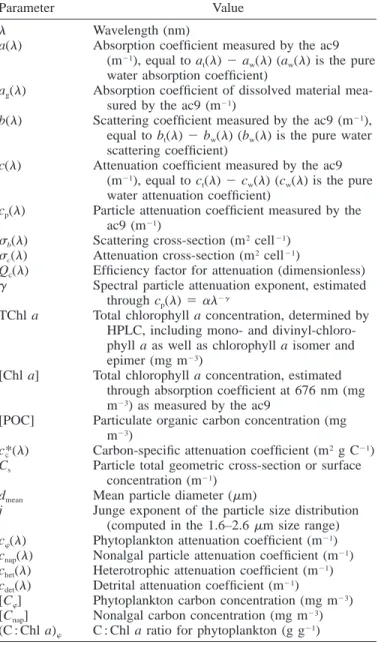
Table 1. Notations. The subscripts w, p,f, nap, and g stand for pure water, particles, phytoplankton, nonalgal particles, and colored dissolved organic matter, respectively.
Parameter Value
l Wavelength (nm)
a(l) Absorption coefficient measured by the ac9 (m21), equal to a
t(l) 2 aw(l) (aw(l) is the pure water absorption coefficient)
ag(l) Absorption coefficient of dissolved material mea-sured by the ac9 (m21)
b(l) Scattering coefficient measured by the ac9 (m21),
equal to bt(l) 2 bw(l) (bw(l) is the pure water scattering coefficient)
c(l) Attenuation coefficient measured by the ac9 (m21), equal to c
t(l) 2 cw(l) (cw(l) is the pure water attenuation coefficient)
cp(l) Particle attenuation coefficient measured by the ac9 (m21)
sb(l) Scattering cross-section (m2cell21) sc(l) Attenuation cross-section (m2cell21)
Qc(l) Efficiency factor for attenuation (dimensionless) g Spectral particle attenuation exponent, estimated
through cp(l) 5 al2g
TChl a Total chlorophyll a concentration, determined by HPLC, including mono- and divinyl-chloro-phyll a as well as chlorodivinyl-chloro-phyll a isomer and epimer (mg m23)
[Chl a] Total chlorophyll a concentration, estimated through absorption coefficient at 676 nm (mg m23) as measured by the ac9
[POC] Particulate organic carbon concentration (mg m23)
c (*c l) Carbon-specific attenuation coefficient (m2g C21) Cs Particle total geometric cross-section or surface
concentration (m21)
dmean Mean particle diameter (mm)
j Junge exponent of the particle size distribution (computed in the 1.6–2.6mm size range) cw(l) Phytoplankton attenuation coefficient (m21)
cnap(l) Nonalgal particle attenuation coefficient (m21) chet(l) Heterotrophic attenuation coefficient (m21) cdet(l) Detrital attenuation coefficient (m21)
[Cw] Phytoplankton carbon concentration (mg m23)
[Cnap] Nonalgal carbon concentration (mg m23) (C : Chl a)w C : Chl a ratio for phytoplankton (g g21)
1–9, DYF, and MIO and between 0 and 100 m for UPW. Profiles were conducted every 3 h over 5 days at DYF and MIO and over 36 h at UPW, with a vertical resolution of ;0.1 m (sampling rate, 6 Hz; profiling velocity, ;0.5 m s21). Onboard the ship, both ac9s were calibrated twice during the cruise with optically pure water (MilliQt A10 system) to quantify instrumental offsets. When corrected for these offsets, measured absorption (a(l)) and attenuation (c(l)) coefficients exclude the contribution by pure water (Table 1). Scattering by dissolved organic matter is assumed to be negligible so that dissolved absorption and attenuation co-efficients are equivalent (ag(l) ; cg(l)). This was confirmed
by in situ measurements where ag2 cg, 0.006 m21 at all
wavelengths. Time lags were applied to each profile to match up- and down-casts. Corrections for the in situ temperature
and salinity effects on the optical properties of water were applied as described by Pegau et al. (1997). Correction for incomplete recovery of the scattered light in the ac9 absorp-tion tube was performed by subtracting a(715) from a(l) (Zaneveld et al. 1994). Finally, ac9 data were averaged over 1-m intervals.
Data analysis revealed an instrumental drift over time (as already reported by Twardowski et al. 1999) monitored from the temporal evolution of a(l) and c(l) at 400 m in the Mediterranean (Oubelkheir et al. 2001; e.g., a drift of up to 0.06 m21was noticed for c(440) over 2 weeks of intensive measurements). Absorption and attenuation spectra deter-mined at this depth just after an absolute calibration (with optically pure water) were used as ‘‘references’’ (i.e., all spectra subsequently measured at 400 m were constrained to be always equal to these reference spectra). Any subsequent deviation of the measured coefficients at 400 m from these references was considered to result from the instrumental drift. This deviation was thus applied as a correction factor over the entire profile. This procedure is equivalent to that developed by Loisel and Morel (1998) for c(660), except that they constrained the coefficient to be zero at a fixed depth. In the present study, the coefficients were constrained to more realistic values. The choice of 400-m waters as a reference was guided by the hydrological and optical stabil-ity (these waters correspond to Levantine Intermediate Wa-ters; e.g., Millot 1999).
The particle attenuation coefficient (cp(l)) was computed
as the difference between the measured attenuation and dis-solved attenuation coefficients (c(l) 2 cg(l)). The spectral
dependency of cp(l) was modeled according to an hyperbolic
function (Van de Hulst 1957; Boss et al. 2001a and refer-ences therein) using a nonlinear regression method:
cp(l) 5 al2g (1)
whereg is the slope of the spectral dependency and a is a scaling factor.
Discrete data acquisition—Water samples were regularly
collected for various discrete biogeochemical measurements. After filtration of seawater (1–5.6 liters, depending on sam-ples) through Whatman GF/F glass-fiber filters, phytoplank-ton pigments were analyzed aboard ship by high-pressure liquid chromatography (HPLC) according to the method de-scribed by Claustre et al. (2004). The POC concentration was determined using a semiautomatic wet-oxidation meth-od (Raimbault et al. 1999) after filtration of 1 liter of sea-water onto precombusted Whatman GF/F glass-fiber filters. Autotrophic picoplankton, heterotrophic bacteria, and virus enumeration was performed on seawater samples fixed with 0.1% glutaraldehyde using a flow cytometer (FACSort; Bec-ton Dickinson) according to the protocols described by Ma-rie et al. (1999, 1997).
Particle size distributions were measured using an HIAC optical counter (Royco; Pacific Scientific). The measurement is based on the light-blockage principle. Further description of the counter principle and functioning has been given by Bernard et al. (1996). The various parameters used in the present study are defined here. If niis the number of particles
counted in the size class i, then N 5 S nm is the total
Fig. 2. Relationship between (A) the absorption coefficient measured by the ac9 at 676 nm (a(676)ac9) and the HPLC-deter-mined chlorophyll a concentration ([TChl a]) and (B) the attenua-tion coefficient at 555 nm measured by the ac9 (c(555)ac9) and the particle surface concentration measured by the HIAC particle coun-ter. Data from the entire PROSOPE data set (UPW, Sta. 1–9, DYF, and MIO) are shown.
number of particles counted in the sample volume V between the size classes i5 1 and i 5 m. The particle total geometric cross-section, equally named particle surface concentration (Cs), is thus defined as:
m
1 i
CS5
O
n si g (2)V i51
where S is the geometric cross-section of the particles ini g
the size class i. The particle mean diameter (dmean) is:
m
1
dmean5
O
n d¯i i (3)N i51
where d¯iis the diameter of the particles in the size class i.
In the present study, the lower and upper size limits are 1.6 and 50mm, respectively, and the counts are distributed with-in m5 85 log-normal size classes. The Junge exponent ( j) is estimated from the slope of the linear regression on the log-transformed particle densities in the size range of 1.6 to 2.6 mm. The computation of j on this restricted range (11 size classes) was constrained by an instrumental artifact ap-pearing around 2.6mm (resulting from an uncertainty in the calibration curve of the HIAC particle counter around this domain). This Junge exponent is assumed to be representa-tive of the size distribution of the particles that are most significant in scattering (Morel and Ahn 1991; Stramski and Kiefer 1991).
Finally, Qband Qc(dimensionless) refer to the efficiency
factors for scattering and attenuation, respectively, as defined as the ratios of the energy scattered or attenuated by a par-ticle to the energy incident on its geometric cross-section sg.
The scattering and attenuation cross-sections (sbandsc) are,
respectively, the products sg3 Qband sg3 Qc(Van de Hulst
1957; Morel and Bricaud 1986).
Results and discussion
Inversion of optical properties into biogeochemical quan-tities—Absorption at 676 nm and Chl a concentration:
Re-lationships between the total Chl a concentration, or [TChl
a], and a(676) generally are modeled using a power law
function to account for the decrease of the chlorophyll-spe-cific absorption coefficient with the increase in [TChl a], which is a consequence of the package effect and pigment composition change (Bricaud et al. 1995a). In the present study, the relationship between a(676)ac9 and [TChl a] (Fig.
2A) is highly significant (Table 2) and can be expressed as: [TChl a]5 67.8a(676)1.16
ac9 (4)
The UPW and Mediterranean data sets, analyzed separately, exhibited two relationships that are not statistically different, so a(676) will be converted into [Chl a] using Eq. 4. The parameterization established on the PROSOPE data set dif-fers significantly (Table 2) from the ‘‘global’’ parameteri-zation established by Bricaud et al. (1995a) ([TChl a] 5 105aw(676)1.19; nonlinear fit to a large data set collected in various oceanic areas and trophic states; [TChl a] range, 0.02–25 mg Chl a m23). Differences could result from the fact that during the PROSOPE cruise, [TChl a] was mea-sured exclusively by HPLC (but only for some cruises in
Bricaud et al. 1995a), and a(676) was measured using an ac9 (but the filter-pad technique in Bricaud et al. 1995a). Recently, Bricaud et al. (2004) extensively discussed the sources of variability in (aw 2 [TChl a]) relationships based on a large data set of simultaneous HPLC pigments and fil-ter-pad absorption determinations collected in various oce-anic areas and trophic states (including the PROSOPE data set). They showed that regional deviations from global re-lationships are mainly caused by variations in the size struc-ture of the algal community (i.e., package effect), whereas variations in the pigment composition are generally a sec-ond-order source of variability.
Particle attenuation (magnitude and spectral shape), con-centration, and size: Because CDOM and algal absorptions were small compared with scattering in our data set at 555
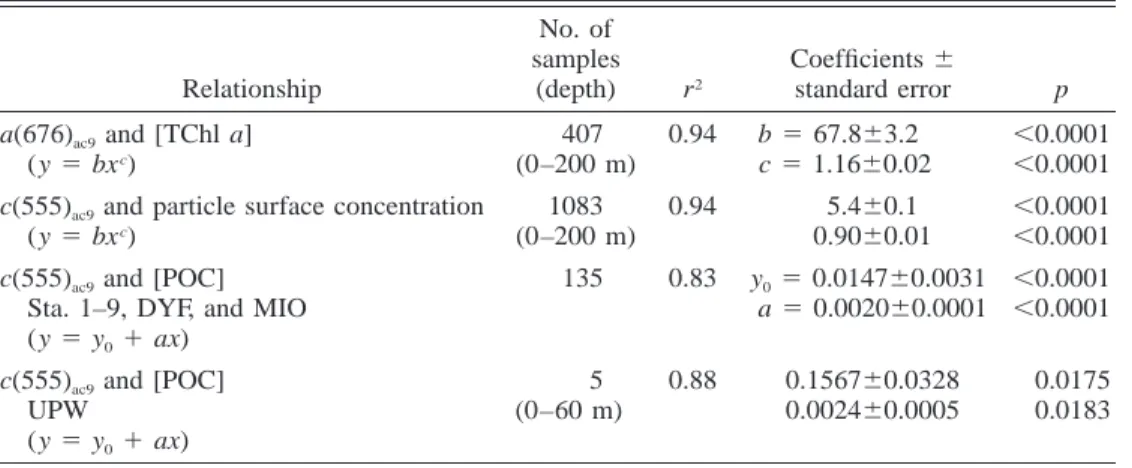
Table 2. Statistical parameters of the relationships between IOPs and biogeochemical constituent concentrations. The type of model applied is given in parentheses. Nonlinear regression methods were used to avoid making assumptions about the behavior of the standard errors.
Relationship No. of samples (depth) r2 Coefficients6 standard error p a(676)ac9and [TChl a]
(y5 bxc) 407 (0–200 m) 0.94 b5 67.863.2 c5 1.1660.02 ,0.0001 ,0.0001 c(555)ac9and particle surface concentration
(y5 bxc) 1083 (0–200 m) 0.94 5.460.1 0.9060.01 ,0.0001 ,0.0001 c(555)ac9and [POC]
Sta. 1–9, DYF, and MIO (y5 y01 ax)
135 0.83 y05 0.014760.0031
a5 0.002060.0001
,0.0001 ,0.0001 c(555)ac9and [POC]
UPW (y5 y01 ax) 5 (0–60 m) 0.88 0.156760.0328 0.002460.0005 0.0175 0.0183
nm ((ag 1 aw)(555) , 10% of c(555) at all stations), the
attenuation coefficient was considered to be equivalent to the particle scattering coefficient (c(555); cp(555) ; bp(555)).
Variations in the scattering coefficient are driven by the nu-merical concentration of the particles and, to a lesser extent, by their size distribution, index of refraction, and shape (e.g., Kitchen et al. 1982; Baker and Lavelle 1984). The compar-ison of the attenuation coefficient measured at 555 nm by the ac9 (c(555)ac9) with the particle surface concentration (Cs,
integrating both numerical concentration and size effects; see
Eq. 2) reveals a significant covariation (Fig. 2B) that is
de-scribed by a power law function (Table 2).
The particle attenuation efficiency factor (Qc(555)) can be
calculated from the ratio of c(555)ac9 to the particle surface
concentration (e.g., Morel and Bricaud 1986). Estimates of
Qc(555) are higher in the Mediterranean (Qc ; 14) than in
the upwelling (Qc ; 3) and, overall, are higher than the
values predicted by the Van de Hulst anomalous diffraction approximation (Qc, 3; Morel and Bricaud 1986). This
over-estimation, which increases with the proportion of smaller particles (from the upwelling to the Mediterranean), essen-tially occurs because the particle counter sees a finite size range (excluding pico-particles [diameter, ,1.6 mm]), whereas c(555) integrates the contribution by all particles. Previous attempts to perform a closure between size distri-bution and particle attenuation/scattering measurements have generally failed (Claustre et al. 2000; Boss et al. 2001b) because of the difficulty in accounting for the ‘‘missing part’’ of the distribution or the part that is unseen by the particle counter (even assuming for pico-particles a Junge-type size distribution with an exponent equal to 4.5 and an index of refraction of 1.05; Claustre et al. 2000; present study, data not shown). This discrepancy points to the lack of knowl-edge regarding picoparticles, which represent a largely un-known stock that is potentially important in optical budgets (Stramski and Kiefer 1991; Claustre et al. 1999).
Further insights regarding the particle size can be obtained by analyzing the spectral dependency of the particle atten-uation coefficient (cp(l)), which is characterized by g (see
Eq. 1). Mie theory predicts that under well-constrained
con-ditions (i.e., nonabsorbing, spherical particles with a
spec-trally constant index of refraction),g is linked to the Junge exponent of the particle size distribution ( j) through j5 g 1 3 (Van de Hulst 1957; Boss et al. 2001a and references therein). Such a theoretical relationship has been partially validated in situ for coastal waters (Boss et al. 2001b; Babin et al. 2003), but to our knowledge, no such analysis has been carried out for the open ocean. Recently, Boss et al. (2001a) showed that this relationship theoretically also applies for particles that are nonspherical, absorbing, or have an index of refraction that is spectrally variable for most conditions encountered in the ocean.
In the present study variations in g are compared with variations in j for oligotrophic Mediterranean waters and with variations in the particle mean diameter (dmean; see Eq.
3) for upwelling waters (as in this last case, high
phytoplank-ton abundance leads to a size distribution with one or more modes) (Fig. 3; note that j and g are plotted in reversed scale). The value of g is between 0.34 (surface UPW) and 2.8 (deep Mediterranean), and the value of j ranges between 3.5 and 5.5. These last values are consistent with those of previous studies (Boss et al. 2001a and references therein). In the Mediterranean, g and j vertical distributions exhibit similar trends, and at MIO, the relationship between these quantities is close to theoretical expectations ( j 5 g 1 3). In the upwelling,g roughly covaries with dmean along depth.
The present study shows that estimations of the particle size in terms of dmeanor Junge exponent, depending on the trophic
state of the waters investigated, are possible from routine measurements of g profiles (using ac9s) in oceanic waters. The vertical variability ing profiles will be discussed later. Particle attenuation and POC concentration: Particle sur-face concentration is correlated with POC content (Verity et al. 1992). Therefore, the attenuation coefficient at 555 nm can also be used as a proxy for the POC concentration ([POC]). In the present study, c(555)ac9and
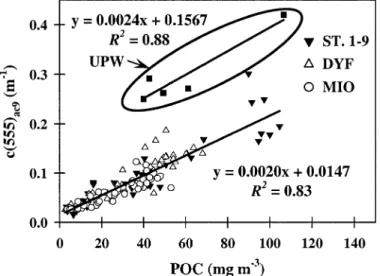
laboratory-mea-sured [POC] were significantly correlated for Mediterranean samples (Fig. 4; Table 2), leading to a conversion factor (c ) equal to 2.02 m* 2g C21 at 555 nm (equivalent to 1.76
c
m2g C21at 660 nm, derived by linear interpolation between values at 630 and 676 nm). These values are in agreement
Fig. 3. Comparative vertical distributions of the spectral particle attenuation exponent measured by the ac9 (g; plotted in reversed scale), the particle mean diameter (dmean) at UPW (cast 10), and the Junge exponent ( j; plotted in reversed scale) at DYF and MIO sites (casts 94 and 31, respec-tively) as measured by the HIAC particle counter. Standard deviations of the hyperbolic model (cp(l) 5 al2g) adjustments are given each 10 m for UPW and each 25 m for DYF and MIO.
Fig. 4. Relationship between the attenuation coefficient at 555 nm measured by the ac9 (c(555)ac9) and the laboratory-measured POC concentration for Mediterranean waters (Sta. 1–9, DYF, and MIO) and the Moroccan upwelling (UPW).
with c (660) estimations in various oceanic areas based on*c
direct POC determinations (2–3.2 m2g C21) (Loisel and Mo-rel 1998; Mishonov et al. 2003; Fennel and Boss 2003; and references therein). By contrast, the UPW waters (Fig. 4; Table 2) are characterized by a slightly different c (*c ;2.38
m2g C21 at 555 nm and ;2.33 m2g C21 at 660 nm) and, in particular, a high intercept on the attenuation axis (0.157 m21at 555 nm and 0.125 m21at 660 nm). Such differences likely are caused by changes in the particle assemblage com-position and associated changes in the size distribution and refractive index. As revealed by simultaneous pigments as
well as microscopic and cytometric determinations, micro-phytoplankton (mainly diatoms) dominates the algal fraction in the surface upwelling layer. In the Mediterranean, pico-and nano-phytoplankton are much more abundant. Values of
c*c are known to vary as a function of phytoplanktonic groups and type of material (algal and nonalgal) and, thus, as a function of their respective proportion in natural particle assemblages (Claustre et al. 2002a). Diatoms present higher attenuation capabilities per unit of POC than nano- and pico-phytoplankton or nonalgal particles (see below). Diatoms are enclosed by a silica frustule and can form chains (as ob-served in the upwelling), which probably leads to a further increase of their attenuation capabilities. In the present study, POC will be derived from c(555) using two different (local) relationships for the Mediterranean and the upwelling.
Bio-optical response to environmental conditions in oce-anic waters—Environmental conditions: In what follows, the
characteristics of the three long stations (UPW, DYF, and MIO) are analyzed in detail, because they encompass a range of trophic states that are representative of the potential di-versity in oceanic waters. These three stations display dif-ferent hydrological and chemical properties (Fig. 5). The up-welling is characterized by a weak stratification, with a nutrient-rich surface layer, whereas the Mediterranean pre-sents a pronounced pycnocline (located at 20 m at DYF and 30 m at MIO) and nutrient-depleted surface waters (down to 30 and 80 m at DYF and MIO, respectively, for NO3;
Raim-bault pers. comm.). The euphotic depth (i.e., the depth at which photosynthetically available radiation is reduced to 1% of its surface value) is, on average, 24, 51, and 82 m for UPW, DYF, and MIO, respectively (Hooker pers. comm.) (Fig. 5).
Fig. 5. Vertical mean density profiles (su) at UPW, DYF, and MIO. The depth of the nitracline is also indicated for DYF and MIO (30 and 80 m, respectively).
Fig. 6. Mean (A) absorption and (B) scattering spectra mea-sured by the ac9 at the chlorophyll maximum at UPW, DYF, and MIO (n5 8, 35, and 31 casts, respectively; spectra are normalized by their integral; corresponding standard deviations are reported) are shown. Also shown are (C) scattering spectra simulated using Mie theory for algal particles, assuming various Junge-type size distribution exponents ( j) ranging between 3.4 and 4.2 (Babin et al. 2003).
Mean inherent optical properties spectra: The spectral var-iability in mean absorption and scattering coefficients was examined at the level of the chlorophyll maximum at UPW, DYF, and MIO (near the surface, at 45 and 90 m, respec-tively) (Fig. 6A,B; the spectra are normalized by their inte-gral value). In the upwelling, the absorption spectrum (Fig. 6A) presents a marked algal contribution at 676 nm, whereas in the Mediterranean, the nonalgal contribution determines the general shape in spectral absorption (mainly CDOM, as evidenced by simultaneous CDOM and detrital absorption measurements; data not shown). Interestingly, the measured scattering spectra (Fig. 6B) are consistent with spectra sim-ulated using Mie computations assuming an index of refrac-tion of 1.05 and various Junge-type size distriburefrac-tion expo-nents (Babin et al. 2003) (Fig. 6C). At DYF and MIO, the Junge exponents used to simulate the measured spectra (;4.0 and ;4.2, respectively) correspond to the Junge ex-ponents estimated in situ (Fig. 3). At UPW, a Junge exponent lower than 3.4 must be assumed to reproduce the nearly flat spectra and the two minima at 440 and 676 nm (associated with the maxima in phytoplankton absorption; Van de Hulst 1957), which also compares to the Junge exponent estimated in situ (Fig. 3).
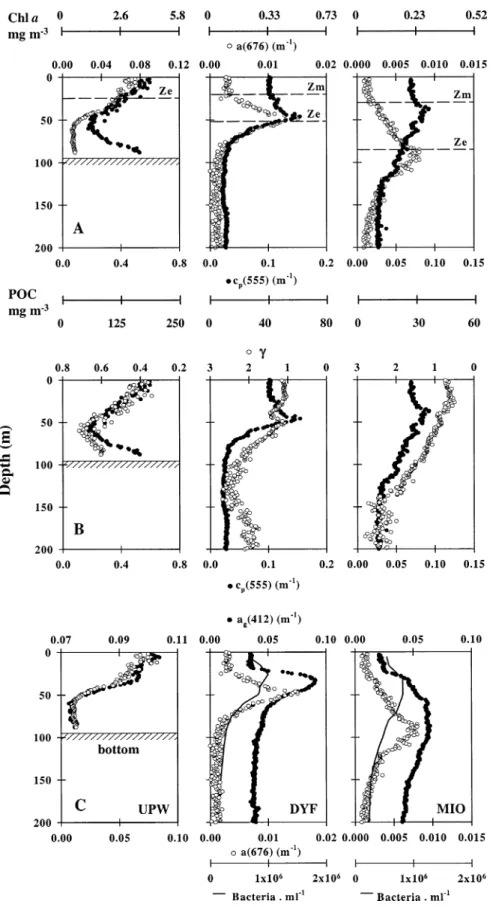
Bio-optical variability in different trophic regimes: As ev-idenced by optical measurements expressed in their biogeo-chemical equivalents, the UPW and the Mediterranean differ strongly in terms of particle and algal stocks (Fig. 7A,B), whereas CDOM (derived from ag(412)) varies over a more
restricted range (Fig. 7C). [Chl a] (derived from a(676)) varies over two orders of magnitude from MIO to UPW in the surface layer (0.03–3.9 mg Chl a m23) and one order of
magnitude at the chlorophyll maximum (0.25–3.9 mg Chl a m23). Thus, these three sites are reasonably representative of most oceanic waters. By contrast, the [POC] (derived from
cp(555)) varies over less than one order of magnitude (28–
175 mg C m23 in the surface layer and 38–175 mg C m23 at the maximum). The particle size (measured or optically
Fig. 7. (A) Comparative vertical distributions of the absorption coefficient at 676 nm (a(676)) and the particle attenuation coefficient at 555 nm (cp(555)) at UPW, DYF, and MIO (casts 10, 94, and 31, respectively). Corresponding derived Chl a and POC concentrations are also shown. The depth of the euphotic zone (Ze) and the lower limit of the mixed layer (Zm) are indicated. (B) The spectral particle attenuation exponent (g; plotted in reversed scale) and the particle attenuation coefficient at 555 nm (cp(555)). (C) The dissolved absorption coefficient at 412 nm (ag(412)), the absorption coef-ficient at 676 nm (a(676)), and the heterotrophic bacteria abundance for DYF and MIO only.
derived from cp(l)) increases from the Mediterranean to the
upwelling (Fig. 7B; at the POC maximum,g ; 1.3, 0.8, and 0.34 at DYF, MIO, and UPW, respectively). The CDOM ab-sorption at 412 nm (Fig. 7C) extends between 0.07 and 0.10 m21at UPW (in the bottom and surface layers, respectively) and 0.06 m21 at MIO (depth, 60–90 m). The values sured in the upwelling fall within the range of values mea-sured in other upwelling systems (Bricaud et al. 1981; Del Castillo and Coble 2000), whereas the maximum values measured in the Mediterranean are slightly higher than those encountered in similar trophic areas (Nelson et al. 1998 and references therein).
Superimposed on these general trends, the respective dis-tributions of bio-optical properties are variable along the ver-tical scale (Fig. 7). In the upwelling, [Chl a], [POC], and CDOM covary within the surface layer (depth, 0–50 m) as a result of mixing. In this layer, the variability of bio-optical properties is driven by phytoplankton, the main source of CDOM (Bricaud et al. 1981) and particles. By contrast, in the bottom boundary layer (depth,.50 m), cpsignificantly
increases toward the bottom, whereas [Chl a] and CDOM remain constant. This increase in cpwith depth probably
re-sults from the presence of degraded algal material, as con-firmed by an increase of the aw(412) : aw(440) ratio (from 0.9 in the surface to 1.2 in the bottom; data not shown). Together with [POC], the particle size (optically derived) decreases from the surface to 50 m, suggesting that the surface layer is occupied by larger particles than are found in the bottom layer (as confirmed by discrete determinations). Although the upwelling is a mixed system, the mixing is not strong enough to homogenize the biogeochemical properties over the entire water column (0–90 m).
In the Mediterranean, [Chl a], [POC], and CDOM are clearly uncoupled along the vertical in the upper layer. Ver-tical distributions of POC and Chl a can be partitioned ac-cording to two layers at DYF (above and below the Chl a and POC maximum) and three layers at MIO (delimited by the deep chlorophyll and POC maxima). The vertical distri-bution of g does not strictly follow the trends observed in POC (e.g., in the 0–50-m layer at DYF or the 0–40-m layer at MIO). Interestingly, the use of in situ spectrophotometers, such as the ac9, highlights some specific features that are not always captured using classical sampling strategies—for example, a layer of higher POC and particle size around 180 m at DYF. At both sites (DYF and MIO), CDOM subsurface maxima are located between the Chl a and heterotrophic bacteria maxima, and a surface deficit in CDOM is noticed. The observed vertical uncoupling between the various bio-optical properties (Chl a, POC, and CDOM) in the Mediter-ranean results from the balance between, first, processes re-lated to light, such as algal photo-adaptation with depth (i.e., increase of intracellular pigment concentration and change in pigment composition with increasing depth; Fennel and Boss 2003 and references therein) and CDOM photo-oxi-dation in the surface layer (Vodacek et al. 1997; Nelson et al. 1998; Del Vecchio and Blough 2002) and, second, a prob-able distinct effect of nonalgal stocks and sources in shaping the vertical distribution of optical properties when the system becomes more oligotrophic. The vertical separation between the deep chlorophyll and algal biomass maxima caused by
algal photo-adaptation is a commonly observed feature in oligotrophic areas (Kitchen and Zaneveld 1990; Loisel and Morel 1998; Claustre et al. 1999; and references therein), and the mechanisms of its generation have been extensively discussed elsewhere (Fennel and Boss 2003 and references therein). By contrast, few authors have underlined the role of nonalgal stocks in shaping the optical properties in oli-gotrophic waters, such as bacteria in CDOM distributions (Nelson et al. 1998) and detritus and/or heterotrophs in par-ticle attenuation distributions (Claustre et al. 1999 and ref-erences therein). Recently, Claustre et al. (2002b) also un-derlined the effect of large-scale, submicron Saharan (mineral) dust deposition in the variability of optical prop-erties of the Mediterranean. These submicron particles prob-ably are quantified, partly erroneously, as CDOM, which might explain the slightly higher CDOM absorptions ob-served in these waters (see above). For further insights re-garding the effect of nonalgal stocks on bio-optical proper-ties variability in oceanic waters, we attempted to estimate the respective contribution of individual particle stocks to particle attenuation in the various oceanic waters investigat-ed.
Particle attenuation and POC budgets—The partial
con-tributions of algal and nonalgal (detritus and heterotrophs) stocks to particle attenuation are assessed through estima-tions of the numerical abundance of the major phytoplank-tonic and heterotrophic groups (using a flow cytometer and a particle counter) and through estimations of their scattering cross-sections, using a method proposed by Claustre et al. (1999). Scattering efficiency factors are computed through the anomalous diffraction approximation (Van de Hulst 1957) for ‘‘generic’’ cells, which are assumed to be repre-sentative of each population. The index of refraction is con-sidered to be 1.05, and the mean diameters adopted in this study are reported on Table 3 together with the correspond-ing computed scattercorrespond-ing cross-sections at 555 nm (sb(555)).
For comparison, the mean diameters andsb(555) values used
in the study of Stramski et al. (2001) are also given. A sen-sitivity analysis of the particle attenuation budget to as-sumptions on the mean diameters assumed for these ‘‘ge-neric’’ cells is presented later.
The algal fraction of cp(cw) is computed as the sum of the partial contributions of each autotrophic group: cw5 cpro 1
csyn1 cpico 1 cdiato, where the subscripts pro, syn, pico, and
diato stand for Prochlorococcus sp., Synechococcus sp., pi-coeukaryotes, and diatoms, respectively (m21). The contri-bution of microphytoplankton (mainly diatoms) to cp(cdiato)
is taken into account only in upwelling waters (negligible for the Mediterranean). The nonalgal fraction of cp(cnap)
cor-responds to the sum of heterotrophic and detrital stocks (chet
1 cdet) and is computed as cnap 5 cp2 cw. Then, under the
assumption of a total heterotrophic contribution equal to twofold that of bacteria (chet5 2cbact; Morel and Ahn 1991;
Claustre et al. 1999), the detrital fraction of cpis estimated
by difference (cdet5 cp2 cw2 chet). To our knowledge, this
is the first such estimation over a large range of trophic regimes and, in particular, in eutrophic waters (see Claustre et al. 1999 for a similar analysis of an oligotrophic regime). The vertical distributions of computed partial attenuation
Table 3. Mean diameter adopted for Prochlorococcus sp., Synechococcus sp., picoeukaryotes, diatoms, and heterotrophic bacteria in the present study. Corresponding scattering cross-sections at 555 nm (sb(555), computed through the anomalous diffraction approximation (Van de Hulst 1957; assuming an index of refraction equal to 1.05) are also reported. For comparison, the corresponding values used in Stramski et al. (2001) are reported in italic and parentheses.
Source Mean diameter (mm) sb(555) (m2cell21)
Prochlorococcus sp. Morel et al. (1993) 0.70
(0.66)
5.443 10214
(4.023 10214)
Synechococcus sp. Morel et al. (1993) 1.20
(1.05)
4.553 10213
(3.253 10213)
Picoeukaryotes Campbell and Vaulot (1993) 2.28 5.243 10212
Diatoms Computed from HIAC particle size
distributions
9.3 (7.73)
1.973 10210
(9.123 10211)
Heterotrophic bacteria Morel and Ahn (1991) 0.5 (0.55)
1.433 10214
(3.993 10214)
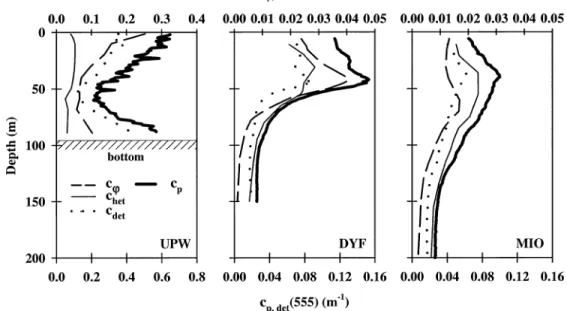
Fig. 8. Decomposition of particle attenuation coefficient into its major contributors (algal, het-erotrophic, and detrital stocks) at UPW, DYF, and MIO (cast 10 at UPW; mean profiles at DYF and MIO, n5 35 and 31 casts, respectively).
values (cw, chetand cdet; m21) are displayed in Fig. 8, and their
relative contributions to cpare reported on Table 4. Various
main observations are highlighted. At DYF, cw and cp
max-ima are coincident and located at;45 m, whereas at MIO,
cw maximum is located in an intermediate position (depth, ;65 m) between the deep chlorophyll maximum and the particle maximum. The detrital contribution to cpis dominant
(;60% at the particle maximum) whatever trophic system is considered, whereas the algal contribution to cpincreases
from ultraoligotrophic to eutrophic waters (from 13% to 34% at the particle maximum), at the expense of the heterotrophic contribution. For the large trophic gradient investigated here, it would be a priori expected that the algal contribution to
cp increases at the expense of the nonalgal one (from
oli-gotrophic to eutrophic). This is globally the case (Table 4), but some nuances have to be noted. First, the relative
con-tribution of detritus to cp is stable whatever the trophic
re-gime. This detrital material is, by contrast, weakly absorbing (anap(440)/ap(440), 28% at the chlorophyll maximum; data
not shown). Second, the trend in the relative contribution of heterotrophs to cpreflects changes in trophic state, whereas
the corresponding absolute values remain rather stable (at the maximum, chet remains;0.02 m21). Third, the increase
in the relative contribution of phytoplankton to cpfrom MIO
to UPW is relatively small (less than a factor of two) (Table 4), despite an increase by one order of magnitude in the corresponding absolute values (cw) and in [Chl a] (at the chlorophyll maximum) (Figs. 7, 8).
The relative contributions of detritus to cpcomputed here
are similar to estimations made under oligotrophic condi-tions in the equatorial/tropical Pacific (Claustre et al. 1999 and references therein). In a simulation of ocean IOPs,
Table 4. Relative contribution of phytoplankton, heterotrophs, and detritus to particle attenuation at 555 nm in the upwelling (UPW) at the level of the particle-chlorophyll maximum and in the bottom layer, and in the Mediterranean (DYF and MIO) at the level of the chlorophyll and particle maxima and in the 0–20-m layer. Note that the estimated contributions are sensitive to the mean diameters assumed for ‘‘generic’’ cells in the computations (see text). The range of variation in the algal (and, by difference, detrital) contribution is reported for varying phytoplankton mean cell diameters (6–13mm for diatoms at UPW and 1–3 mm for picoeukaryotes at DYF and MIO; range reported in italic and parentheses).
Site Layer Phytoplankton (%) Hetero-trophs (%) Detritus (%) UPW Chlorophyll-particle maximum (0–20 m) 34
(diato: 6–13mm) 29–81
9 57
62–10
Bottom layer (70–90 m) 19 7 74
DYF Chlorophyll; particle maximum 27
(pico: 1–3 mm) 15–46 17 56 68–37 0–20 m 22 (pico: 1–3 mm) 15–33 18 60 67–49
MIO Deep chlorophyll maximum 17
(pico: 1–3 mm) 8–32 26 57 66–42 Particle maximum 13 (pico: 1–3 mm) 6–25 23 64 71–52 0–20 m 18 (pico: 1–3 mm) 10–31 22 60 68–47
Stramski et al. (2001), by varying the contributions of in-dividual particles in a controlled manner, also evidenced a major contribution of nonalgal particles to scattering. By contrast, using the FCM-Mie method (a combination of Mie theory and flow cytometry), Green et al. (2003) estimated a major contribution of eukaryotic phytoplankton in surface waters of the continental shelf. The present study shows that picoparticles (see above), which correspond mainly to pi-codetritus (as shown in this section), play a major role in optical budgets and biogeochemical cycling in oceanic wa-ters (present study; Green et al. 2003 and references therein), so their properties (e.g., size distribution and index of re-fraction) must be studied further. The picodetritus might cor-respond to broken cellular material (of phytoplankton origin) with a lower water content and, therefore, a higher index of refraction than would be found in living cells (Babin et al. 2003; Merien 2003).
A crucial assumption underlying the particle attenuation budget computed here and, thus, of all derived budgets (POC budget; see below) relies on the size assumed for each type of particle. Such assumptions were required, because the size distribution of individual micro-organisms was not estimat-ed. Making such estimates is strongly recommended in fu-ture studies. We present here a sensitivity analysis of the cp
budget to variations in the mean cell size of picoeukaryotes (a main contributor to cwin oligotrophic areas; present study, data not shown; Claustre et al. 1999 and references therein) and heterotrophic bacteria in Mediterranean waters and of
diatoms in upwelling waters. Note that the detrital contri-bution to cpis estimated as a ‘‘leftover’’ of the contributions
from the major micro-organisms (cdet5 cp2 cw 2 chet) and,
thus, is directly affected by under- or overestimations of al-gal or heterotrophic contributions (leading, respectively, to over- or underestimations of cdet).
In Mediterranean waters, we first varied the mean cell diameter of picoeukaryotes between 1 and 3 mm (this size range is representative of most oceanic picoeukaryotes pop-ulations; Simon et al. 1994). Results show that the corre-sponding detrital contribution to cpvaries at the particle
max-imum between 68% and 37% at DYF and between 71% and 52% at MIO (Table 4). Alternatively, we assumed a mean cell diameter of heterotrophic bacteria equal to 0.6 mm (whereas the mean diameter of picoeukaryotes was fixed at 2.28 mm). The chet contribution (2cbact) increases at the
par-ticle maximum to 35% at DYF and 48% at MIO. Note also that the assumption chet5 2cbact(Morel and Ahn 1991) used
in the present study was a main source of uncertainty and might not hold over the large range of water types explored here. For example, at MIO, there is a striking similarity be-tween chet and cp vertical distributions (Fig. 8), which
sug-gests that chet is underestimated. Finally, in the upwelling,
we varied the mean cell diameter of diatoms between 6 and 13 mm. Corresponding estimated algal contribution to cp
varies in the surface layer between 29% and 81%, respec-tively (Table 4). In conclusion, accurate determinations of the mean diameter and, ultimately, of the particle size
dis-Table 5. Carbon-specific particle attenuation coefficient for main phytoplanktonic groups encountered in open ocean waters and for nonalgal particles used in this study.
Source c (660)*c (m2g C21) Prochlorococcus sp. Synechococcus sp. Picoeukaryotes Diatoms Nonalgal particles
Claustre et al. (2002a) Stramski et al. (1995) DuRand and Olson (1998) Stramski and Reynolds (1993) Claustre et al. (2002a)
1.0 2.5 3.4 3.8 1.5
Fig. 9. Vertical distribution of the algal carbon ([Cw]) and Chl a concentrations (derived, respectively, from the algal attenuation at 555 nm, cw(555), and the absorption coefficient at 676 nm, a(676)) at DYF and MIO (mean profiles).
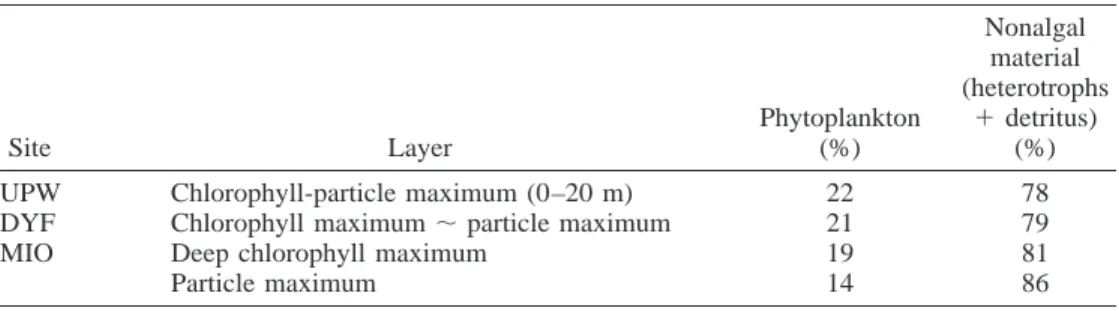
Table 6. Relative contribution of algal and nonalgal material to particulate organic carbon stocks in the upwelling (UPW) and in the Mediterranean (DYF and MIO).
Site Layer Phytoplankton (%) Nonalgal material (heterotrophs 1 detritus) (%)
UPW Chlorophyll-particle maximum (0–20 m) 22 78
DYF Chlorophyll maximum; particle maximum 21 79
MIO Deep chlorophyll maximum Particle maximum
19 14
81 86
tribution of the various types of particles acting in optical budgets are definitively required.
The cpbudget computed here can be converted into a
car-bon budget of the partial contributions of individual stocks to [POC] if the carbon-specific attenuation coefficients (c )*c
for phytoplankton, heterotrophs, and detritus are known. Such estimation is of high interest to assess the role of in-dividual particle stocks in organic carbon cycling in the ocean. Values for c (660) used in the present study, derived*c
from literature, are reported in Table 5. Because a similar spectral dependency is assumed for these various coeffi-cients, c (660) values are used directly to derive the POC*c
budget. The [POC] attributed to each stock ([Cstock]) is
esti-mated through cstock/c*cstock. Algal carbon concentration ([Cw])
is computed as the sum of the carbon concentration of each autotrophic group: [Cw]5 [Cpro]1 [Csyn]1 [Cpico]1 [Cdiato].
We found that nonalgal particles (heterotrophs and detritus) contribute approximately 80% of [POC], whatever the tro-phic system considered (Table 6). By contrast, phytoplank-ton represents only ;20% of [POC], which, again, is an unexpected result for the upwelling. At UPW, the decrease of algal contribution to POC relative to its contribution to
cp (cw contributes up to 34% of cpin the surface layer) is a
consequence of the predominance of diatoms in the phyto-plankton assemblage (characterized by higher attenuation ca-pabilities of the carbon biomass relative to other phytoplank-ton and nonalgal particles) (Table 5). The contribution of algal carbon to POC estimated here is similar to the values estimated in previous studies of other oceanic areas (DuRand et al. 2001 and references therein; Gundersen et al. 2001 and references therein). Note that the C : Chl a ratio for the sole algal material ((C : Chl a)w, g g21) can be derived from the ratio between algal carbon ([Cw], computed as detailed above) and optically derived Chl a (see Eq. 4) concentrations
(Fig. 9) to examine the extent of algal photo-adaptation in Mediterranean waters. At the Cw maximum, (C : Chl a)w is between 42 g g21 (at DYF) and 63 g g21 (at MIO), which falls within the range of values reported for natural phyto-plankton populations (Eppley et al. 1992 and references therein). Algal photo-adaptation is more marked at MIO than at DYF. At MIO, the algal carbon maximum is located at 65 m, or ;30 m shallower than the Chl a maximum and ;25 m deeper than the POC maximum. The algal C : Chl a is an essential variable (e.g., for biogeochemical modeling; Geider et al. 1998) and generally cannot be measured routinely, so the development of alternative methods, such as the one pro-posed in the present study, is highly relevant.
Interestingly, the ‘‘local’’ c*c value for the bulk material can be reconstructed if the c*c of individual particle stocks (Table 5) and their respective contribution to cp(Table 4) are
known and then compared to the measured c for the same*c
bulk material. The computed c*is 1.66, 1.83, and 2.42 m2 c
respectively, which corresponds to ;82%, 91%, and 102% of the measured c in the Mediterranean and the upwelling*c
(2.02, the global Mediterranean value, and 2.38 m2g C21at 555 nm, respectively; see above). The agreement between the computed c (from c values of individual particle stocks*c *c
and their respective contribution to cp) and the measured
c (derived from direct measurements on bulk material) rep-*c
resents an a posteriori validation of the assumptions made to derive the particle attenuation and carbon budgets. Note that these budgets were determined during late summer and, thus, represent a ‘‘snapshot’’ of the variability along time. Such estimations are required for various seasons in regions where the particle assemblage composition is highly variable over the year (e.g., temperate areas; Green et al. 2003).
The large range of trophic states explored here provides a unique opportunity to derive general trends in the bio-optical variability of open ocean waters. The present study confirms that Chl a explains the first-order variations in IOPs over the large range of conditions explored. Beside this ex-pected result, the present study also emphasizes second-order sources of variability (i.e., nuances) in IOPs, namely the composition of phytoplankton assemblage, balance between algal and nonalgal stocks, and photochemical processes (e.g., CDOM photo-oxidation and algal photo-adaptation). These nuances might be better addressed and understood by the establishment of bio-optical databases, which would allow development of regional algorithms for the inversion of op-tical measurements (in situ or remote) into biogeochemical constituents (e.g., at the scale of the Mediterranean basin; Bricaud et al. 2002).
We believe that combining optical and biogeochemical in-formation, as done in the present study, remains essential for a more accurate retrieval of biogeochemical parameters. These ‘‘combined’’ approaches allow development of re-gional algorithms that, in turn, are essential for the ‘‘all-optical’’ approaches that have been developed in the same areas. Exclusive use of optical instrumentation to address the variability in biogeochemical quantities, however, without any concurrent discrete measurement, is a highly attractive approach. The relative lack of accuracy in ‘‘all-optical’’ ap-proaches can be considered to be compensated, at least in part, by the acquisition frequency, which allows addressing the biogeochemical variability at certain scales that have been unattainable using classical sampling strategies. For some remote platforms (e.g., mooring, drifters, autonomous underwater vehicles, and gliders; Dickey 2003), simulta-neous validation by discrete measurements is, in most cases, not feasible; thus, the ‘‘all-optical’’ approaches will remain the only solution.
Besides such in situ studies, an important step in the ac-curate retrieval of biogeochemical properties from optical signals relies on the development of laboratory studies ded-icated to specific particulate and dissolved pools. Phyto-plankton has been the subject of intensive and exhaustive studies (Stramski et al. 2001 and references therein), but this has not been the case for many other stocks (e.g., hetero-trophs and biodetritus). Detritus and, more likely, biodetritus probably represent a major and relatively stable contribution in optical (cp) and biogeochemical (POC) budgets in oceanic
waters. Deriving cpand POC budgets from a combined
ap-proach using particle counts and individual particle proper-ties (mean diameter, refractive index, and carbon-specific particle attenuation coefficient) is a powerful approach for optical and carbon-cycling studies. The recent development of automated submersible flow cytometers and their coupling with microscopy is thus promising for future carbon budgets at unprecedented temporal and spatial scales.
References
BABIN, M., A. MOREL, V. FOURNIER-SICRE, F. FELL,ANDD. STRAM -SKI. 2003. Light scattering properties of marine particles in
coastal and oceanic waters as related to the particle mass con-centration. Limnol. Oceanogr. 48: 843–859.
BAKER, E. T.,ANDJ. W. LAVELLE. 1984. The effect of particle size
on the light attenuation coefficient of natural suspensions. J. Geophys. Res. 89: 8197–8203.
BARTH, J. A.,ANDD. J. BOGUCKI. 2000. Spectral light absorption
and attenuation measurements from a towed undulating vehi-cle. Deep-Sea Res. 47: 323–342.
BERNARD, O., G. MALARA,ANDA. SCIANDRA. 1996. The effects of
a controlled fluctuating nutrient environment on continuous cultures of phytoplankton monitored by computers. J. Exp. Mar. Biol. Ecol. 197: 263–278.
BLOUGH, N. V.,ANDS. A. GREEN. 1995. Spectroscopic
character-ization and remote sensing of nonliving organic matter, p. 23– 45. In R. G. Zepp and C. Sonntag [eds.], The role of nonliving organic matter in the Earth’s carbon cycle. Wiley.
BOSS, E., M. S. TWARDOWSKI,AND S. HERRING. 2001a. Shape of
the particulate beam attenuation spectrum and its inversion to obtain the shape of the particulate size distribution. Appl. Opt. 40: 4885–4893.
, AND OTHERS. 2001b. Spectral particulate attenuation and
particle size distribution in the bottom boundary layer of a continental shelf. J. Geophys. Res. 106: 9509–9516.
BRICAUD, A., M. BABIN, A. MOREL, AND H. CLAUSTRE. 1995a.
Variability in the chlorophyll-specific absorption coefficients of natural phytoplankton: Analysis and parameterization. J. Geo-phys. Res. 100: 13321–13332.
, E. BOSC, ANDD. ANTOINE. 2002. Algal biomass and sea
surface temperature in the Mediterranean Basin. Intercompar-ison of data from various satellite sensors, and implications for primary production estimates. Remote Sens. Environ. 81: 163– 178.
, H. CLAUSTRE, J. RAS,ANDK. OUBELKHEIR. 2004. Natural
variability of phytoplanktonic absorption in oceanic waters: In-fluence of the size structure of algal populations. J. Geophys. Res. 109. [doi:10.1029/2004JC002419]
, A. MOREL, M. BABIN, K. ALLALI,ANDH. CLAUSTRE. 1998.
Variations of light absorption by suspended particles with chlo-rophyll a concentration in oceanic (case 1) waters: Analysis and implications for bio-optical models. J. Geophys. Res. 103: 31033–31044.
, , AND L. PRIEUR. 1981. Absorption by dissolved
organic matter of the sea (yellow substance) in the UV and visible domains. Limnol. Oceanogr. 26: 43–53.
, C. ROESLER,ANDJ. R. V. ZANEVELD. 1995b. In situ
meth-ods for measuring the inherent optical properties of ocean wa-ters. Limnol. Oceanogr. 40: 393–410.
CAMPBELL, L.,ANDD. VAULOT. 1993. Photosynthetic picoplankton
community structure in the subtropical north Pacific Ocean near Hawaii (station ALOHA). Deep-Sea Res. 40: 2043–2060. CHANG, G. C., AND OTHERS. 2002. Nearshore physical processes
and bio-optical properties in the New York Bight. J. Geophys. Res. 107. [doi:10.1029/2001JC001018]
CLAUSTRE, H., F. FELL, K. OUBELKHEIR, L. PRIEUR, A. SCIANDRA,
B. GENTILI, AND M. BABIN. 2000. Continuous monitoring of
surface optical properties across a geostrophic front: Biogeo-chemical inferences. Limnol. Oceanogr. 45: 309–321.
, AND OTHERS. 1999. Variability in particle attenuation and
chlorophyll fluorescence in the tropical Pacific: Scales, pat-terns, and biogeochemical implications. J. Geophys. Res. 104: 3401–3422.
, AND OTHERS. 2002a. Diel variations in Prochlorococcus
optical properties. Limnol. Oceanogr. 47: 1637–1647. , AND OTHERS. 2002b. Is desert dust making oligotrophic
waters greener? Geophys. Res. Lett. 29. [doi:10.1029/ 2001GL014056]
, AND OTHERS. 2004. An intercomparison of HPLC
phyto-plankton methods using in situ samples: Application to remote sensing and database activities. Mar. Chem. 85: 41–61. D’ORTENZIO, F., S. MARULLO, M. RAGNI, M. R. D’ALCALA, AND
R. SANTOLERI. 2002. Validation of empirical SeaWiFS
algo-rithms for chlorophyll-a retrieval in the Mediterranean Sea. A case study for oligotrophic seas. Remote Sens. Environ. 82: 79–94.
D’SA, E. J., AND R. L. MILLER. 2003. Bio-optical properties in
waters influenced by the Mississippi River during low flow conditions. Remote Sens. Environ. 84: 538–549.
DELCASTILLO, C. E.,ANDP. G. COBLE. 2000. Seasonal variability
of the colored dissolved organic matter during the 1994–95 NE and SW monsoons in the Arabian Sea. Deep-Sea Res. 47: 1563–1579.
DEL VECCHIO, R., AND N. V. BLOUGH. 2002. Photobleaching of
chromophoric dissolved organic matter in natural waters: ki-netics and modeling. Mar. Chem. 78: 231–253.
DICKEY, T. 2003. Emerging ocean observations for interdisciplinary
data assimilation systems. J. Mar. Syst. 40–41: 5–48. DURAND, M. D., ANDR. J. OLSON. 1998. Diel patterns in optical
properties of the chlorophyte Nannochloris sp.: Relating indi-vidual-cell to bulk measurements. Limnol. Oceanogr. 43: 1107–1118.
, , ANDS. W. CHISHOLM. 2001. Phytoplankton
pop-ulation dynamics at the Bermuda Atlantic Time-Series station in the Sargasso Sea. Deep-Sea Res. 48: 1983–2003.
EPPLEY, R. W., F. P. CHAVEZ, AND R. T. BARBER. 1992. Standing
stocks of particulate carbon and nitrogen in the equatorial Pa-cific at 150 degree W. J. Geophys. Res. 97: 655–661. FENNEL, K.,ANDE. BOSS. 2003. Subsurface maxima of
phytoplank-ton and chlorophyll: Steady-state solutions from a simple mod-el. Limnol. Oceanogr. 48: 1521–1534.
FERRARI, G. M. 2000. The relationship between chromophoric
dis-solved organic matter and disdis-solved organic carbon in the Eu-ropean Atlantic coastal area and in the West Mediterranean Sea (Gulf of Lions). Mar. Chem. 70: 339–357.
GALLEGOS, C. L.,AND P. J. NEALE. 2002. Partitioning spectral
ab-sorption in case 2 waters: Discrimination of dissolved and par-ticulate components. Appl. Opt. 41: 4220–4232.
GARDNER, W. D., M. J. RICHARDSON, C. A. CARLSON, D. HANSELL, AND A. V. MISHONOV. 2003. Determining true particulate
or-ganic carbon: Bottles, pumps, and methodologies. Deep-Sea Res. 50: 655–674.
GEIDER, R. J., H. L. MACINTYRE, AND T. M. KANA. 1998. A
dy-namic regulatory model of phytoplanktonic acclimation to light, nutrients, and temperature. Limnol. Oceanogr. 43: 679– 694.
GREEN, R., H. M. SOSIK, ANDR. J. OLSON. 2003. Contribution of
phytoplankton and other particles to inherent optical properties in New England continental shelf waters. Limnol. Oceanogr. 48: 2377–2391.
GUNDERSEN, K., K. M. ORCUTT, D. A. PURDIE, A. F. MICHAELS,
AND A. H. KNAP. 2001. Particulate organic carbon mass
dis-tribution at the Bermuda Atlantic Time-Series Study (BATS) site. Deep-Sea Res. 48: 1697–1718.
KINKADE, C. S., J. MARRA, T. D. DICKEY, C. LANGDON, D. E. SIG -URDSON, AND R. WELLER. 1999. Diel bio-optical variability
observed from moored sensors in the Arabian Sea. Deep-Sea Res. 46: 1813–1831.
KISHINO, M., M. TAKAHASHI, N. OKAMI,ANDS. ICHIMURA. 1985.
Estimation of the spectral absorption coefficients of phyto-plankton in the sea. Bull. Mar. Sci. 37: 634–642.
KITCHEN, J. C.,ANDJ. R. V. ZANEVELD. 1990. On the
noncorrela-tion of the vertical structure of light scattering and chlorophyll a in case I waters. J. Geophys. Res. 95: 20237–20246.
, ,AND H. PAK. 1982. Effect of particle size
distri-bution and chlorophyll content on beam attenuation spectra. Appl. Opt. 21: 3913–3918.
LOISEL, H.,ANDA. MOREL. 1998. Light scattering and chlorophyll
concentration in case 1 waters: A reexamination. Limnol. Oceanogr. 43: 847–858.
MARIE, D., C. P. D. BRUSSAARD, R. THYRHAUG, G. BRATBAK,AND
D. VAULOT. 1999. Enumeration of marine viruses in culture
and natural samples by flow cytometry. Appl. Environ. Micro-biol. 65: 45–52.
, F. PARTENSKY, S. JACQUET, ANDD. VAULOT. 1997.
Enu-meration and cell-cycle analysis of natural populations of ma-rine picoplankton by flow cytometry using the nucleic acid stain SYBR Green I. Appl. Environ. Microbiol. 63: 186–193. MERIEN, D. 2003. Variabilite´ biooptique a` diffe´rentes e´chelles
spa-tiales et temporelles dans l’Atlantique nord-est: interpre´tations bioge´ochimiques. Ph.D. thesis, Universite´ Pierre et Marie Cu-rie.
MILLOT, C. 1999. Circulation in the western Mediterranean Sea. J.
Mar. Syst. 20: 423–442.
MISHONOV, A. V., W. D. GARDNER,ANDM. J. RICHARDSON. 2003.
Remote sensing and surface POC concentration in the South Atlantic. Deep-Sea Res. 50: 2997–3015.
MOREL, A.,ANDY.-H. AHN. 1991. Optics of heterotrophic
nanofla-gellates and ciliates: A tentative assessment of their scattering role in oceanic waters compared to those of bacterial and algal cells. J. Mar. Res. 49: 177–202.
, , F. PARTENSKY, D. VAULOT, AND H. CLAUSTRE.
1993. Prochlorococcus and Synechococcus: A comparative study of their optical properties in relation to their size and pigmentation. J. Mar. Res. 51: 617–649.
,ANDA. BRICAUD. 1986. Inherent optical properties of algal
cells, including picoplankton. Theoretical and experimental re-sults. Can. J. Fish. Aquat. Sci. 214: 521–559.
, ANDS. MARITORENA. 2001. Bio-optical properties of
oce-anic waters: A reappraisal. J. Geophys. Res. 106: 7163–7180. NELSON, N. B., D. A. SIEGEL,ANDA. F. MICHAELS. 1998. Seasonal
dynamics of colored dissolved material in the Sargasso Sea. Deep-Sea Res. 45: 931–957.
OUBELKHEIR, K. 2001. Caracte´risation bioge´ochimique de provinces
oce´aniques a` l’aide d’indicateurs bio-optiques, a` diverses e´chelles spatio-temporelles. Ph.D. thesis. Universite´ de la Me´d-iterrane´e.
PEGAU, W. S., D. GRAY,ANDJ. R. V. ZANEVELD. 1997. Absorption
and attenuation of visible and near-infrared light in water: De-pendence on temperature and salinity. Appl. Opt. 36: 6035– 6046.
RAIMBAULT, P., F. DIAZ, W. POUVESLE,ANDB. BOUDJELLAL. 1999.
Simultaneous determination of particulate organic carbon, ni-trogen, and phosphorus collected on filters, using a semiauto-matic wet-oxidation method. Mar. Ecol. Prog. Ser. 180: 289– 295.
in the optically complex coastal waters of the mid-Atlantic bight. J. Geophys. Res. 109. [doi:10.1029/2003JC002071] SIMON, N., R. G. BARLOW, D. MARIE, F. PARTENSKY,ANDD. VAU
-LOT. 1994. Characterization of oceanic photosynthetic
picoeu-karyotes by flow cytometry. J. Phycol. 30: 922–935.
SMITH, R. C., AND K. S. BAKER. 1978. The bio-optical state of
ocean waters and remote sensing. Limnol. Oceanogr. 23: 247– 259.
SOSIK, H. M., R. E. GREEN, W. S. PEGAU, AND C. S. ROESLER.
2001. Temporal and vertical variability in optical properties of New England shelf waters during late summer and spring. J. Geophys. Res. 106: 9455–9472.
STRAMSKI, D., A. BRICAUD, AND A. MOREL. 2001. Modeling the
inherent optical properties of the ocean based on the detailed composition of the planktonic community. Appl. Opt. 40: 2929–2945.
, ANDD. A. KIEFER. 1991. Light scattering by
microorgan-isms in the open ocean. Prog. Oceanogr. 28: 343–383. , ANDR. A. REYNOLDS. 1993. Diel variations in the optical properties of a marine diatom. Limnol. Oceanogr. 38: 1347– 1364.
, A. SHALAPYONOK, AND R. A. REYNOLDS. 1995. Optical characterization of the oceanic unicellular cyanobacterium Sy-nechococcus grown under a day-night cycle in natural irradi-ance. J. Geophys. Res. 100: 13295–13307.
TWARDOWSKI, M. S., AND P. L. DONAGHAY. 2001. Separating in
situ and terrigenous sources of absorption by dissolved mate-rials in coastal waters. J. Geophys. Res. 106: 2545–2560.
, J. M. SULLIVAN, P. L. DONAGHAY,ANDJ. R. V. ZANEVELD.
1999. Microscale quantification of the absorption by dissolved and particulate material in coastal waters with an ac-9. J. At-mos. Ocean. Technol. 16: 691–707.
VAN DE HULST, H. C. 1957. Light scattering by small particles.
Wiley.
VERITY, P. G., C. Y. ROBERTSON, C. R. TRONZO, M. G. ANDREWS,
J. R. NELSON, AND M. E. SIERACKI. 1992. Relationships
be-tween cell volume and the carbon and nitrogen content of ma-rine photosynthetic nanoplankton. Limnol. Oceanogr. 37: 1434–1446.
VODACEK, A., N. V. BLOUGH, M. D. DEGRANDPRE, E. T. PELTZER, AND R. K. NELSON. 1997. Seasonal variation of CDOM and
DOC in the middle Atlantic bight: Terrestrial inputs and photo-oxidation. Limnol. Oceanogr. 42: 674–686.
ZANEVELD J. R. V., J. C. KITCHEN, AND C. MOORE. 1994. The
scattering error correction of reflecting-tube absorption meters. Proc. SPIE. 2258: 44–55.
Received: 29 March 2004 Accepted: 28 March 2005 Amended: 14 June 2005
![Fig. 2. Relationship between (A) the absorption coefficient measured by the ac9 at 676 nm (a(676) ac9 ) and the HPLC-deter-mined chlorophyll a concentration ([TChl a]) and (B) the attenua-tion coefficient at 555 nm measured by the ac9 (c(555) ac9 ) and t](https://thumb-eu.123doks.com/thumbv2/123doknet/14795890.603736/5.918.464.837.119.689/relationship-absorption-coefficient-measured-chlorophyll-concentration-coefficient-measured.webp)