HAL Id: insu-03116573
https://hal-insu.archives-ouvertes.fr/insu-03116573
Submitted on 20 Jan 2021
HAL is a multi-disciplinary open access
archive for the deposit and dissemination of
sci-entific research documents, whether they are
pub-lished or not. The documents may come from
teaching and research institutions in France or
abroad, or from public or private research centers.
L’archive ouverte pluridisciplinaire HAL, est
destinée au dépôt et à la diffusion de documents
scientifiques de niveau recherche, publiés ou non,
émanant des établissements d’enseignement et de
recherche français ou étrangers, des laboratoires
publics ou privés.
Solar erythemal irradiance and ozone profile at Buenos
Aires and inside and outside the ozone hole at
Marambio Argentine Antarctic Base
M. I. Micheletti, A. Cede, R. D. Piacentini, E. Wolfram, Andrea Pazmino, E.
Quel, Sophie Godin, Gérard Mégie
To cite this version:
M. I. Micheletti, A. Cede, R. D. Piacentini, E. Wolfram, Andrea Pazmino, et al.. Solar erythemal
irradiance and ozone profile at Buenos Aires and inside and outside the ozone hole at Marambio
Argentine Antarctic Base. Il Nuovo Cimento C - Colloquia and communications in physics, Società
Italiana di Fisica (Bologna), 2003, 26 (6), pp.597-611. �10.1393/ncc/i2002-10007-1�. �insu-03116573�
DOI 10.1393/ncc/i2002-10007-1
Solar erythemal irradiance and ozone profile at Buenos Aires and
inside and outside the ozone hole at Marambio Argentine
Antarctic Base(∗)
M. I. Micheletti(1)(2)(∗∗), A. Cede(3), R. D. Piacentini(1)(4)
E. Wolfram(5)(**), A. Pazmi˜no(5)(6)(∗∗∗), E. Quel(5), S. Godin(6)
and G. M´egie(6)
(1) Instituto de F´ısica Rosario (CONICET-Universidad Nacional de Rosario) 27 de febrero, 210bis, 2000 Rosario, Argentina
(2) Facultad de Ciencias Bioqu´ımicas y Farmac´euticas
Universidad Nacional de Rosario - Rosario, Argentina (3) Institute of Medical Physics, University of Innsbruck - Austria
(4) Facultad de Ciencias Exactas, Ingenier´ıa y Agrimensura
Universidad Nacional de Rosario - Rosario, Argentina
(5) Centro de Investigaciones en L´aser y Aplicaciones (CONICET-CITEFA)
Villa Martelli, Buenos Aires, Argentina
(6) Service d’A´eronomie, Universit´e Pierre et Marie Curie - Paris, France
(ricevuto il 7 Ottobre 2002; revisionato il 20 Febbraio 2004; approvato il 3 Marzo 2004)
Summary. — Solar erythemal irradiance (directly related to the UV index) has been measured in Buenos Aires, Argentina, the largest populated city of the country. Similar data have also been obtained at Marambio Argentine Antarctic Base inside and outside the ozone hole region. In the latter case, the largest UV index during the 1996-1999 period, of value 10.2, is 22% lower than the corresponding one for Buenos Aires. However near its maximum, the integrated daily dose, which is of importance in the evaluation of the accumulated dose along a given period, is rather similar in both places. We thus propose to use also this quantity for solar risk forecast at high latitudes. Ozone profile data for Buenos Aires and Marambio Base are presented, as well as time series of erythemal irradiance and ozone total column. Ozone profiles have been determined using the differential absorption lidar technique (DIAL) in Buenos Aires during periods near maximum and minimum of ozone total column and near the maximum of solar intensity. Model calculations of the erythemal irradiance are done, incorporating these profiles as well as those commonly used in this type of analysis. The influence of different atmospheric parameters as well as of the ground albedo on the erythemal irradiance has been tested.
PACS 92.60.Vb – Solar radiation.
PACS 94.10.Gb – Absorption and scattering of radiation.
(∗) The authors of this paper have agreed to not receive the proofs for correction. (∗∗) Fellow of CONICET, Argentina.
(∗∗∗) Fellow of Estenssoro Grant of Repsol-YPF Foundation. c
1. – Introduction to erythemal irradiance and ozone profiles
The knowledge of the behavior of solar UV radiation at the Earth surface in general and in Argentina and Antarctic Peninsula in particular, is of great importance due to its relation to the large ozone depletion in these regions, mainly during ozone hole events [1, 2].
The main objective of the present work is to obtain comparative information about solar ultraviolet radiation related to erythemal irradiance (and consequently UV index) in Buenos Aires, the mid-latitude largest populated city of the country and the high-latitude Argentina Antarctic Marambio Base, like similar information obtained during other intercomparisons of the same kind (see for example, ref. [3]). Other objective is to intercompare ozone profiles in both places in ozone hole and non-ozone hole conditions. Using algorithms that solve the atmospheric radiative transfer equation, it was possible to test the sensitivity of the erythemal irradiance to the ozone and aerosol variables.
A measure of the risk for persons exposed to the Sun can be obtained introducing the erythemal irradiance Ieryt which is defined as the spectral solar irradiance I(λ, t)
multi-plied by the erythemal action spectrum Beryt(λ) and integrated over the UV wavelength
range [4]
Ieryt(t) =
!
I(λ, t)Beryt(λ)dλ .
(1)
The internationally accepted UV index is obtained multiplying Ieryt(with I measured
in W/m2and B without dimension) by the factor 40 m2/W [5,6]. This simple procedure
transforms the scale to a number that varies from 0 to about 10–12 near noon summer solstice in mid-latitudes and up to about 20 in regions where the highest solar erythemal irradiance was detected, as in the Argentina Puna of Atacama high-altitude desert [7].
The time integral of the erythemal irradiance is usually called erythemal exposure [8] or dose [4]
Deryt=
!
Ieryt(t)dt .
(2)
In particular, if the time integration is performed over a day, one gets the daily exposure or daily dose.
The most common action spectra is that defined by McKinlay and Diffey [9] and different instruments usually named biometers are installed around the world to measure these quantities. In particular, ground instruments have the possibility to determine the instantaneous erythemal irradiance given by expression (1) since they register the solar irradiance during all the day. On the other hand, satellite instruments like TOMS on board of Earth Probe/NASA derive the daily dose from measurements made at a given moment of the day assuming a normal behavior for the rest of the day. Even if values for individual days are not very precise, except for clear-sky or completely cloudy-skies conditions, the monthly mean is rather accurate at least for Argentina, as has been verified in the work of Piacentini et al. [10]. The great contribution of the satellite data is the possibility to extend ground (more precise) information to almost all the Earth (including oceans) [11].
0.0 0.1 0.2 0.3 0.0 0.1 0.2 0.3 6 8 10 12 14 16 18 0.0 0.1 0.2 0.3 0 4 8 12 b UV I n d e x So la r e ry th e m a l ir ra d ia n c e [ W /m 2 ] 0 4 8 12 c UV I n d e x Solar time 0 4 8 12 a UV I n d e x
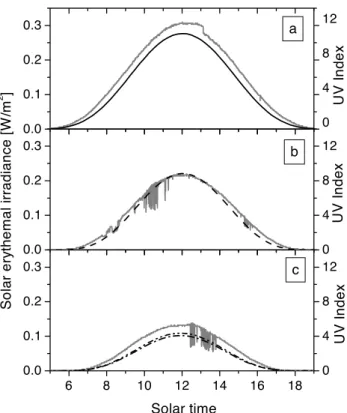
Fig. 1. – Measurements of erythemal irradiance (grey solid lines) made at CEILAP (Centro de Investigaciones en L´aseres y Aplicaciones), Buenos Aires suburbs (34.6◦S, 58.5◦W, 20 m a.s.l.) on the days: a) January 12, 2001; b) March 17, 2001 and c) August 29, 2000. Theoretical calculations made with the TUV algorithm are the smooth lines for the same days: January 12, 2001 (solid line), March 17, 2001 (dashed line), August 29, 2000 (dot-dashed line). For August 29 an AOD at 340 nm of half a value is also considered as a text of the sensitibity to this geophysical variable (dash-dot-dotted line). Note: the corresponding UV index (see text for definition) is given in the right scale.
2. – Erythemal irradiance and ozone profile measurements
Two types of biometers are installed in Buenos Aires: a Solar Light one at the National Weather Service station of Villa Ort´uzar and an EKO one at CEILAP (Research Center for Laser and Applications). The distance between the two instruments is about two kilometers. The EKO biometer is placed at the same location where lidar ozone profile measurements are performed and was installed in August 2000 under the auspices of the Argentina National Commission on Space Activities (CONAE). It was calibrated by EKO Instruments Trading Co, Tokyo, Japan (certificate of September 29, 1999). Its spectral behavior is rather similar to the reference one of McKinlay and Diffey, as was shown in the work of Micheletti et al. [12]. The Solar Light instrument was originally calibrated by the manufacturers before its installation in the Villa Ort´uzar station at Buenos Aires in 1998 and calibrated in situ in the 1998-1999 campaign. A detailed analysis of the Solar Light instrument error in given in the work of Cede et al. [13].
Results of the solar erythemal irradiance introduced in eq. (1) obtained with an EKO biometer are displayed in fig. 1 for the days at which the ozone profiles were measured,
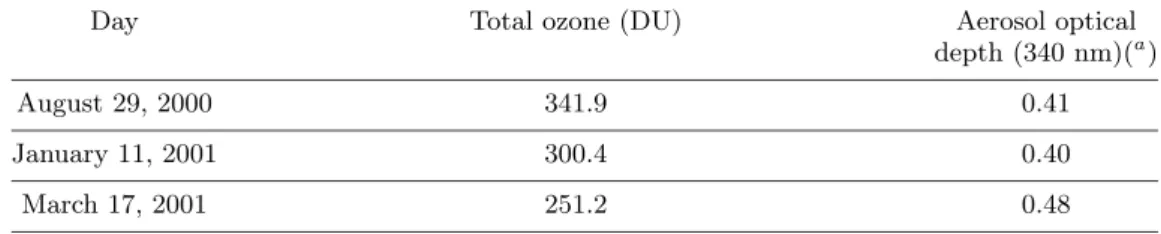
Table I. – Variables and parameters included in the TUV model for Buenos Aires (34.6◦S, 58.5◦W). Albedo: 0.06. Single scattering albedo: 0.93. Note: those not displayed in this table
are as those given in the TUV code [10].
Day Total ozone (DU) Aerosol optical
depth (340 nm)(a)
August 29, 2000 341.9 0.41
January 11, 2001 300.4 0.40
March 17, 2001 251.2 0.48
(a) Mean of the 1996-1999 period [14].
i.e. near the maximum (August 29, 2001) and the minimum (March 17, 2001) of total ozone abundance and near the maximum of solar irradiance (January 12, 2001). In this latter case, the ozone profile was measured the night before (January 11, 2001). Using the TUV Madronich code [14] that solves the atmospheric radiative transfer equation, we compare two stream calculations from eq. (1) with measurements, considering typical values for the variables of each day as displayed in table I. The agreement between measurements and model calculations for March 17 is rather good, while for the other cases the calculated values are smaller than the measured ones. At least, part of the difference seems to be due to the fact that the aerosol optical depth (AOD) is considered as equal to its mean value of the 1996/99 period for the corresponding day. Indeed, the true value for the mentioned days could differ significantly from these mean values. For example after a rain event, it can be reduced due to the washout of aerosols. We made a sensitivity test for August 29 reducing the AOD (mean value given in table I) to half of this value. We can see that the erythemal irradiance difference at noon between calculated values increases is about 7%, approaching the measured data. Another possible source of difference can be attributed to the difference in the EKO spectral response with respect to the theoretical (ideal) one of McKinlay and Diffey [9].
One of the most significant atmospheric variables that influence solar erythemal ra-diation is ozone. In order to understand its variation and evolution and its influence on life through the attenuation of solar UV radiation, it is important to determine not only its total column but also its vertical distribution. The former quantity is mea-sured mainly using spaceborne instruments like TOMS on board of the NASA Earth Probe and GOME on board of ERS-2/ESA and from surface instruments like the Dob-son and Brewer spectroradiometers distributed around the world [1]. The ozone profiles are commonly determined using different techniques like solar occultation from satellites, ballon-borne ozonesonde, the Umkehr technique, and ground-based lidar systems [1] and also through model calculations considering different algorithms [15].
In this work, we present ozone profiles obtained using a lidar (LIght Detection And Ranging), a remote-sensing instrument similar in principle to the radar but operating in the optical range. Generally, a lidar measurement consists in sending into the atmo-sphere a laser beam, a small part of this laser radiation is scattered back to the surface, where it is collected by a telescope, detected by a photomultiplier tube and analysed with an electronic acquisition system. Range resolved measurements could be obtained using pulsed lasers. In order to measure the ozone vertical distribution, the DIfferential Absorption Lidar technique (DIAL) is used [16]. This technique requires the
simultane-0 10 20 30 40 50 60 700 10 20 30 40 50 60 70 Marambio Base 0 1 2 3 4 5 6 Hei g ht ( k m )
Ozone concentration (1018 molec/m3) Buenos Aires Hei g ht ( k m )
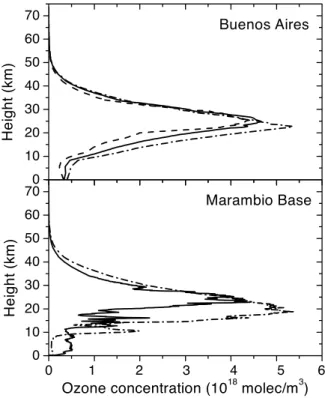
Fig. 2. – Top: Measurements made at CEILAP (Centro de Investigaciones en L´aseres y Apli-caciones), Buenos Aires suburbs (34.6◦S, 58.5◦W, 20 m a.s.l.) of Lidar ozone profiles on the days: January 11, 2001 (solid line), March 17, 2001 (dashed line), August 29, 2000 (dot-dashed line). Bottom: Measurements made at Marambio Argentine Antarctic base (64.2◦S, 56.7◦W, 300 m a.s.l.) of ozonesonde profiles (extended at high altitudes using the US standard profile) on the days: December 9, 1998 with ozone hole (solid line) and November 21, 1998 without it (dash-dotted line).
ous emission of two laser beams, each one characterized by a different ozone absorption cross-section, one in a spectral region with strong ozone absorption (λon), the other one,
called the reference wavelength (λoff), in a spectral region of low absorption. The
dif-ference between the slope of the lidar signals determines the local ozone concentration. The DIAL system is a powerful instrument to monitor the ozone vertical distribution and other atmospheric parameters, since the system is auto calibrated.
The DIAL system is composed of two lasers, an excimer laser emitting at the ozone absorbing wavelength (λon= 308 nm) and a reference Nd:YAG laser emitting at λoff =
355 nm. The backscattered photons are collected by a Newtonian telescope and then separated by a beam-splitter. Backscatter profiles are reconstructed using a dual-channel discriminator counting board. As the DIAL technique for measurement of the strato-spheric ozone layer is based on the photon counting mode, Poisson statistics must be used to analyse the return signals. The ozone profiles were extended to lower altitudes using the 1976 US Standard Atmosphere reference profile and the matching between the two profiles at 18 km was obtained with an interpolation filter technique. More details about our system are given in the work of Pazmi˜no et al. [17].
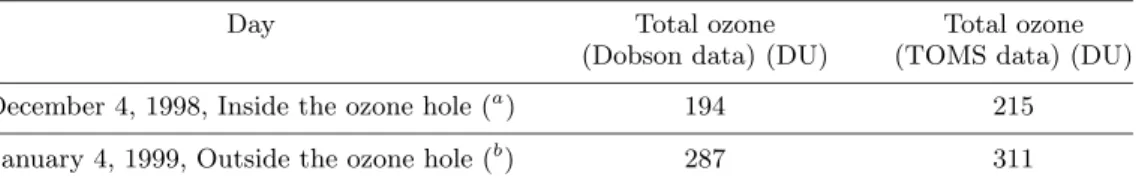
Table II. – Variables and parameters included in the TUV model for Marambio Argentine Antarctic Base (64.2◦S, 56.7◦W). Albedo: 0.1. Free aerosol. Note: those not displayed in this table are as those given in the TUV code [10].
Day Total ozone Total ozone
(Dobson data) (DU) (TOMS data) (DU)
December 4, 1998, Inside the ozone hole (a) 194 215
January 4, 1999, Outside the ozone hole (b) 287 311
(a) The ozone profile corresponds to December 9, 1998, also inside the ozone hole region. This profile
has been scaled in order to give the Dobson and TOMS total column for December 4, 1998.
(b) The ozone profile corresponds to November 21, 1998, in this case outside the ozone hole region. This
profile has been scaled in order to give the Dobson and TOMS total column for January 4, 1999.
a.s.l.) with this DIAL technique. They are presented in fig. 2, for typical days around the maximum (August 29, 2000) and minimum (March 17, 2001) of ozone total column and near the maximum of the solar erythemal irradiance (January 11, 2001). They are representative of the typical ozone variations observed at mid-latitudes (30◦S-40◦S) [15],
in comparison with much larger variations at high latitude observed in the Marambio Base (64.2◦S, 56.7◦W, 300 m a.s.l.) ozone profile data displayed in the same figure. This
ozone vertical distributions were determined using balloon-borne ozonesondes provided by the Finland-Argentina exchange program. These profiles are characteristic of situa-tions inside (December 9, 1998) and outside (November 21, 1998) the ozone hole area [18]. For the determination of the overpass of the ozone hole over Marambio Station we used the method described in the Appendix. In a general way, the ozone hole situation corre-sponds to values of total ozone equal or lower than 220 DU (with a Dobson Unit equals to 2.69 × 10²⁰molecules/m2). In fact, the total ozone as calculated by the integration of
the measured profiles is 209 DU for December 9, 1998 and 313.5 DU for November 21, 1998, corresponding to the situations as mentioned above. The strong ozone destruction due to heterogeneous chemistry reactions at the level where polar stratospheric clouds are present (around 20 km) is clearly identified in the ozone hole profile [18]. These ozone profiles can be compared with climatological data for the 60–70◦S band [15].
Figure 3 displays the erythemal irradiance measured at the Marambio Argentine Antarctic Base with the Solar Light biometer of the SCO3P (Southern Cone Ozone Project)/WMO network under the responsibility of the Argentine National Weather Service, during clear-sky days, one inside the period of ozone hole (December 4, 1998) and the other outside the period of ozone hole, near the expected maximum of the solar radiation (January 4, 1999). The total ozone content for these days as given in table II, is measured from both the Dobson spectroradiometer and the TOMS instrument. The observed difference between satellite and ground-based measurements is a known feature at the high southern latitudes which corresponds to Marambio Base, as was determined from an analysis of the Dobson and Brewer spectroradiometers data with respect to the TOMS measurements for the 1996-2000 period by Piacentini et al. [19]. Indeed, the systematic percentage difference for these latitudes is about 6%. Nevertheless, in the Marambio erythemal irradiance data, large differences are evident between the measurements performed during the two different days under consideration, which are mainly due to the difference in the total ozone content. One observes a large decrease (36.3%) in the irradiance values at noon on January 4, 1999 with respect to the value
0 3 6 9 12 0.0 0.1 0.2 0.3 0 3 6 9 12 0 2 4 6 8 10 12 14 16 18 20 22 24 0.0 0.1 0.2 0.3 U V in d e x a Er yt hemal I rr adi a nce (W /m 2 ) b U V in d e x Solar time
Fig. 3. – Measurements of erythemal irradiance (grey solid lines) made at Marambio Argentine Antarctic base (64.2◦S, 56.7◦W, 300 m a.s.l.) registered on the days: a) December 4, 1998 inside the ozone hole and b) January 4, 1999 outside ozone hole period. Theoretical calculations have been done with the TUV algorithm (smooth solid lines) for total ozone values registered with the Dobson spectroradiometer (194 DU and 287 DU, for the upper and lower figures, respectively), the higher values in both figures and TOMS/Earth Probe/NASA (215 DU and 311 DU, respectively), the lower ones, also in both figures. The data of the day of maximum erythemal irradiance registered in the 1996/99 period over Buenos Aires, December 12, 1998, is also represented in a) by the broken solid line for comparison purposes.
on December 4, 1998. The calibration of the Marambio biometer against the Austrian reference is described in detail in the work of Cede et al. [13].
These values are compared in the same figure with the Solar Light biometer data of the same SCO3P network, obtained at Villa Ort´uzar station in Buenos Aires on the clear-sky day December 12, 1998, corresponding to the maximum erythemal irradiance registered in the 1996-1999 period.
The interesting result is that the maximum erythemal irradiance at noon in Marambio Argentine Antarctic Base during the ozone hole event of December 4, 1998 leads to a UV index of 10.2, as compared to the relatively high value of 13 observed for mid-latitudes in Buenos Aires. Since the UV index is a direct indication of the solar exposure risk, the above value leads to a 22% lower risk in the former location that in the latter one. On the other hand, the integrated erythemal irradiance over the day (eq. (2)) is 6.85 kJ/m2
for Marambio Base and 7.27 kJ/m2for Buenos Aires. These rather similar values (within
6%) are due to the fact that the larger daily time length at high latitudes compensates the lower maximum value.
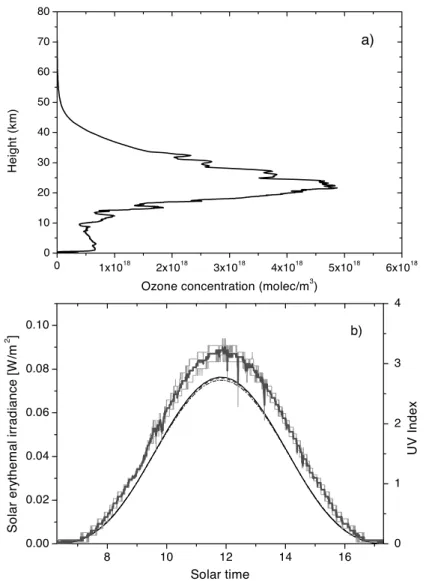
a) 0 1x10¹⁸ 2x10¹⁸ 3x10¹⁸ 4x10¹⁸ 5x10¹⁸ 6x10¹⁸ 0 10 20 30 40 50 60 70 80 Height (km)
Ozone concentration (molec/m3)
b) 8 10 12 14 16 0.00 0.02 0.04 0.06 0.08 0.10 So lar er yth e m a l irrad iance [W /m 2 ] Solar time 0 1 2 3 4 U V I n d e x
Fig. 4. – Measurements made at Buenos Aires in May 2001. a) Ozone profile measured with ozonesonde and lidar (see explanation in text) on the day 15 (solid line); b) erythemal irradiance measured with the EKO instrument on the clear-sky days May 12 and 24 (broken light-grey solid lines, with its mean value for this period in heavy grey) and calculated with the TUV algorithm for May 15, with the profiles given in a) for a sensitivity analysis and represented with the same symbols.
Since the instrument registered in the afternoon of this day at Marambio Base an attenuation due to a thin cloud coverage of the sky, we performed theoretical calculations with the TUV model (for the variables and parameters given in table II) in order to try to compare ideal (completely clear) sky conditions in Marambio with respect to the condition observed in Buenos Aires. It results from these calculations that the daily exposure at Marambio for this ideal case in December 4, 1998 has a value of 7.4 kJ/m2
considering the ground-based Dobson data), close to and even greater than the Buenos Aires value (+1.7% difference).
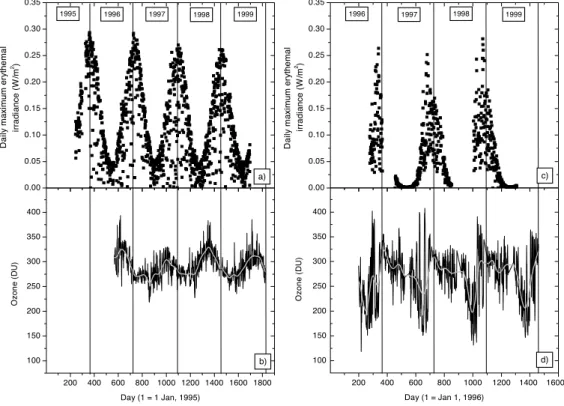
0.00 0.05 0.10 0.15 0.20 0.25 0.30 0.35 200 400 600 800 1000 1200 1400 1600 1800 100 150 200 250 300 350 400 200 400 600 800 1000 1200 1400 1600 100 150 200 250 300 350 400 0.00 0.05 0.10 0.15 0.20 0.25 0.30 0.35 D a ily m a xi m u m e rythe ma l ir ra d ia n c e ( W /m 2) 1999 1998 1997 1996 1995 a) b) Oz o n e ( D U ) Day (1 = 1 Jan, 1995) d) Oz o n e ( D U ) Day (1 = Jan 1, 1996) c) 1999 1998 1997 1996 D a ily m a xi m u m e rythe ma l ir ra d ia n ce ( W /m 2)
Fig. 5. – Daily maximum erythemal irradiance measured as the half an hour mean around noon: at Buenos Aires with the EKO biometer in the period 1995-1999 (a) and at Marambio Argentina Antarctic Base with the Solar Light biometer in the period 1996-1999 (c). The ozone total column measured with a Dobson spectroradiometer of the SCO3P (Southern Cone Ozone Project)/WMO placed in the Argentina National Weather Stations at Villa Ortuzar, Buenos Aires (b) and at Marambio (d) are also displayed. The mean curves in grey are FFT (Fast Fourier Transform)’s with a 30 day window.
3. – Comparison of erythemal irradiance (and UV index) incident on Buenos Aires and Marambio Antarctic Base
As part of a cooperative programme between Argentina and Finland national mete-orological services, the tropospheric and lower and mid stratospheric ozone profile was measured in Buenos Aires using a balloon-borne Vaisala ozonesonde on May 15, 2001. The following night, clear-sky conditions gave the possibility to also use the lidar at CEILAP in order to measure the ozone vertical distribution. The agreement between both series of data in the 20–30 km range is within 5%. So a matching of both profiles (ozonesonde data up to 24 km and lidar from this value up to 33.5 km) was performed. For higher altitudes, it was extended using climatological data for Buenos Aires as ob-tained from the SAGE and HALOE instruments for the period 1985-1990 and 1995-2000, respectively. The satellite ozone profiles taken into account were those setting at ±2.5◦
latitude and ±12◦ longitude from Buenos Aires coordinates. Figure 4a displays this
profile. Since we have the valuable situation of the knowledge of an ozone profile based on ozonesonde and lidar measurements, from ground up to more than 30 km high, we calculate the erythemal irradiance for this day in order to test the ozone profile influence
06 08 10 12 14 16 18 20 0.00 0.05 0.10 0.15 0.20 0.25 0.30 k l j i h gf e d c b a Er yt h e m a l ir ra d ia n c e ( W /m 2 ) eff t (Local time = UT - 3) 0 2 4 6 8 10 12 U V I n d e x
Fig. 6. – Clear-sky day erythemal irradiance measured at Buenos Aires on the days of 1997 (about one per month): a) 2; b) 359; c) 42; d) 54; e) 292; f) 72; g) 90; h) 257; i) 124; j) 220; k) 198; l) 170. UV index values are indicated in the right scale.
on model calculations with actual (measured) as well as modelled profiles.
In fig. 4b we show the mean erythemal irradiance measured at CEILAP on the days May 12 and 24 with the EKO biometer in clear-sky conditions around (but not exactly) the day indicated before, since there were no data for this day. The corresponding mean value at noon, when compared with the results from the TUV (2-stream) model, gives rather good agreement in the general behaviour, the measured value being around 14% higher at noon than the calculated one using the combined lidar-ozonesonde profile, and 15% and 16% when considering the US Standard and TOMS/NASA profiles, all of them normalised to the same ozone total column (299 DU).
In order to study the sensitivity of solar erythemal irradiance model calculations to geophysical variable and parameter modifications, different sensitivity tests were made employing the DISORT (16-stream) formalism [20], which lead to the following conclu-sions: a) a decrease in the total ozone content of 1% produces an increase of the erythemal irradiance of 1.1%; b) an increase of +0.1 in the aerosol optical depth at 340 nm (AOD) induces a reduction of the erythemal irradiance of 1% to 4% for aerosol single scattering albedos (SSA) of 1.0 and 0.8, respectively; c) for variations in the shape of the ozone profile of the type considered in the present work (TOMS vs. US Standard atmosphere) the change in the erythemal irradiance is less than 1% in normal situations, while in ozone hole conditions it is about 3% (in both cases the US Standard profile used in the TUV code is considered as a reference); d) increasing the SSA by 0.1 induces an erythemal irradiance increase of about 6% at AOD = 0.4; e) an increase of 0.1 in the value of the surface albedo produces a 4% change in this irradiance; f) the AOD vertical
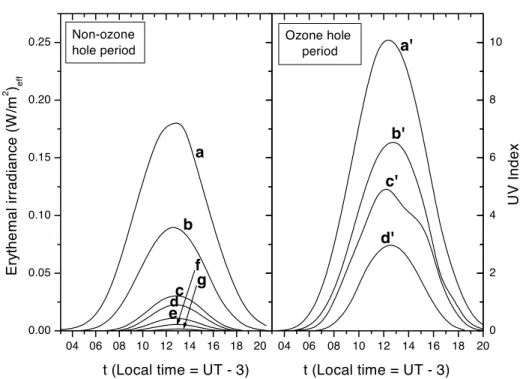
04 06 08 10 12 14 16 18 20 0.00 0.05 0.10 0.15 0.20 0.25 04 06 08 10 12 14 16 18 20 Non-ozone hole period g f ed c b a Er yt hema l irra d iance (W /m 2 ) ef f t (Local time = UT - 3) Ozone hole period d' c' b' a' t (Local time = UT - 3) 0 2 4 6 8 10 U V In d e x
Fig. 7. – Clear-sky erythemal irradiance measured at Argentina Antarctic Marambio Base. Left: Non-ozone hole period on the days of 1997: a) 337; b) 300; c) 263; d) 93; e) 239; f) 121; g) 189; right: Ozone hole period on the days of 1997: a′) 314; b′) 302; c′) 288; d′) 266. UV index values are indicated in the right scale.
distribution, aerosol asymmetry factor, temperature, pressure, extraterrestrial spectrum and ozone photo-absorption cross-section induce minor changes in the final irradiance results. The more elaborated (and consequently more time consuming) DISORT (16-stream) algorithm was used for these particular studies in order to avoid (maximum) error of the order of some percents introduced by the TUV (2-stream) algorithm mainly for large solar zenith angles.
Consequently, the differences of up to about 20% observed at noon between the cal-culations and the measurements of the erythemal irradiance as given in figs. 1, 3 and 4b could possibly be a combination of such uncertainties. They could also be more probably related to an instrumental difference due to the relatively large difference between the McKinlay and Diffey [9] standard erythemal action spectrum used in the calculation and the ones employed for the EKO and YES biometers. However, differences as large as 15% can be considered as acceptable [21].
In fig. 5a and 5c we represent the daily variation of the maximum erythemal irradiance for the two locations, from 1995 to 1999 in the case of Buenos Aires and from 1996 to 1999 in Marambio. This maximum is the half an hour mean around noon. The first series of data show the typical oscillations with a mean clear-sky day maximum of 0.28 W/m2 at the end of the year and the beginning of the next year, due to the
combination of high noon solar elevation angle (about 80◦), the passage of the Earth by
the perihelion corresponding to the minimum Earth-Sun distance and a decrease of the ozone total column while passing from the maximum in around September (the beginning
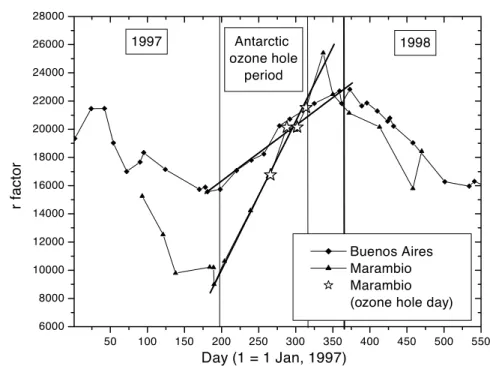
50 100 150 200 250 300 350 400 450 500 550 6000 8000 10000 12000 14000 16000 18000 20000 22000 24000 26000 28000 Day (1 = 1 Jan, 1997) r factor Antarctic ozone hole period 1997 1998 Buenos Aires Marambio Marambio (ozone hole day)
Fig. 8. – Ratio r of the integrated (H) to the maximum (Imx) erythemal irradiances, for the days
of the typical year 1997. The ozone hole period at the Marambio Base location is indicated. The straight line approximations in the second semester (thick solid lines) of the year have slopes 105.4 for the integrated and 39.3 the maximum erythemal irradiances.
of the Southern Hemisphere spring) to the minimum around March (fig. 5b). The mean minimum is about 0.046 W/m2at Southern Hemisphere winter. So their ratio is around
6. In the case of Marambio (fig. 5c), due to the ozone hole from about August to the beginning of December, the mean maximum of 0.27 W/m2 is at the end of this period
during late spring (end of November and beginning of December), due to the combined effect of the relatively low ozone atmospheric content and high solar elevation and the mean minimum of 0.01 W/m2 is at winter, with a ratio near 27. It must be pointed
out that the normal ozone variation, with a maximum at Spring and a minimum at Autumn is observed in fig. 5b for Buenos Aries but this behaviour is modified by the ozone hole at Marambio Base, with a maximum at around December and a minimum in September-October.
In fig. 6 the hourly variation of erythemal irradiance in Buenos Aires in clear-sky days of 2001 along the year is shown and in fig. 7 the same variable is considered for clear-sky days at Marambio Base and for ozone hole and non-ozone hole conditions. The enhancement of the irradiance due to the strong reduction in the ozone total column is evident in the last figure.
In order to analyze the relative variation of the integrated (H) to the maximum (Imx)
erythemal irradiances, fig. 8 shows the corresponding ratio r. Mathematically r = H/Imx.
(3)
Antarctica (Marambio Base) with respect to the middle ones of Buenos Aires, since the day length increases more rapidly at these high latitudes than at the lower ones. This can be seen comparing the values of the slopes of the straight lines that approximate both data. At high latitudes it is about 3 times larger than at low ones. This effect is almost independent of the overpassage of the ozone hole over the station. Consequently, at high latitudes it is important for solar risk considerations to indicate the integrated value as well as the (near noon) maximum one, directly related to the UV index. 4. – Conclusions
We present in this work erythemal irradiances and ozone profiles as measured in Buenos Aires and at Marambio Argentine Antarctic Base with, for the second one, sit-uations inside and outside of the ozone hole region. The ozone vertical profiles were determined using the DIAL technique and complemented with ozonesonde data. The comparison of both series of irradiance data and the ratio of the exposure (daily in-tegrated erythemal irradiance) to the noon irradiance at high latitudes demonstrates that it is not sufficient to use the UV index at high latitudes for indicating the solar risk at noon as is currently done each day in Argentina [22] and at other places of the world [23], since the erythemal exposure or daily dose can be even larger with respect to mid-latitudes, in ozone hole situations and the increase in the corresponding ratio is 3 times larger at high latitudes than at middle ones. This is important in the analysis of cumulative effects, like skin cancers [24,25]. It must be pointed out that for diseases like (squamous and basal) skin cancers, the accumulation of solar radiation expressed as the exposure (eq. (2)) is an important variable even at sub-MED doses [24], where a MED is a minimal dose for having the possibility to induce sunburn [25].
The erythemal irradiance data can also be used as the ground truth for satellite measurements and for comparative studies due to solar risk in relation to other biological effects, like DNA and plant damages [4].
∗ ∗ ∗
The authors like to thanks the Agencia Nacional de Promoci´on Cient´ıfica y Tec-nol´ogica of Argentina, the ECOS (France-Argentina) exchange program and the Ar-gentina National Commission on Space Activites (CONAE) for the partial support to this work and the Argentina National Weather Service-Finland Antarctic Program for providing the ozonesonde profile data. The technical support of P. Garc´ıa of the Obser-vatorio Astron´omico de Rosario and of P. Cesarano of CEILAP is also acknowledged, as well as to the anonymous referees for the comments and suggestions made for the improvement of this paper.
Appendix
In order to determine when the ozone hole overpasses the Marambio Argentine Antarc-tic Station, the position of the station with respect to the polar vortex is calculated in a quasi-conservative space using the potential temperature and the equivalent latitude as an approximate vortex-following coordinate [26]. In this way, the study of the ozone evolution in this coordinate system allows us not to take into account the dynamics of the polar vortex. The potential vorticity is computed from the ECMWF (European Centre for Median Range Weather Forecasts) meteorological analyses. The equivalent latitude is
a modified potential vorticity variable defined as the latitude enclosing the same area as the PV contour [27]. Then the position of the vortex in equivalent latitude is determined, using the Nash et al. method [28].
We determine the position of the station as a function of potential temperature and equivalent latitude, changing the 3D geographical coordinate system (latitude, longitude, altitude) to the 2D quasi-conservative coordinate system (equivalent latitude, potential temperature). In this new coordinate system, the pole corresponds to the position of maximum potential vorticity. Basically three regions can be distinguished: inner vortex, characterized by high PV values; outer vortex or surf zone, by small PV values and the vortex edge, corresponding to the high PV gradient region. The vortex limit corresponds to the maximum gradient of PV as a function of the equivalent latitude. The inner and outer borders correspond to the local maximum and minimum of the second PV derivative.
REFERENCES
[1] Bojkov R. and Hudson R., in Scientific Assessment of Ozone Depletion: 1998, Chapt. 4, WMO Report 44 (1999).
[2] Herman J. R. and McKenzie R. L., in Scientific Assessment of Ozone Depletion: 1998, Chapt. 9, WMO Report 44 (1999).
[3] Diaz S. B., Deferrari G., Booth G. R., Martinioni D. and Oberto A., J. Atmos. Solar-Terr. Phys., 63 (2001) 309.
[4] Madronich S., in UV-B Radiation and Ozone Depletion: Effects on Humans, Animals, Plants, Microorganisms, and Materials, edited by Tevini M. (Lewis Publishers, Boca Raton, Florida) 1993, pp. 17-69.
[5] Kerr J. B., McElroy C. T. and Wardle D. I., in Solar Ultraviolet Radiation, edited by Zerefos C. and Bais A. (Spinger, Berlin) 1997, pp. 251-258.
[6] McKenzie R. L., Bj¨orn L. O., Bais A. and Iyasd M., Photochem. Photobiol. Sci., 2 (2003) 5.
[7] Cede A., Luccini E., Piacentini R. D., Nu˜nez L. and Blumthaler M., J. Geophys. Res., 107, D13 (2002) 10.1029/2001JD001206.
[8] Herman J., Piacentini R. D., Ziemke J., Celarier E. and Larko D., J. Geophys. Res., 105 (2000) 29189.
[9] McKinlay A. F. and Diffey B. L., CIE J., 6 (1987) 17.
[10] Piacentini R. D., Luccini E., Micheletti M. I., Quel E., Wolfram E. A., Pazmi˜no A. F., Fochesatto J., Crino E., Cede A., Blumthaler M., Herman J., Godin-Beekmann S. and M´egie G., Advances in Space Research (2003), accepted for publication. [11] Krotkov N. A., Herman J. R., Bhartia P. K., Ahmad Z. and Fioletov V., J.
Geophys. Res., 106 (2001) 11743.
[12] Micheletti M. I., Wolfram E., Piacentini R. D., Pazmi˜no A., Quel E., Orce V.
and Paladini A. A., J. Opt. A: Pure Appl. Opt., 5 (2003) S262-S268.
[13] Cede A., Luccini E., Piacentini R. D., Nu˜nez L. and Blumthaler M., Appl. Opt., 41 (2002) 306341.
[14] Madronich S., TUV Code Web page: http://www.acd.ucar.edu/TUV/.
[15] Park J. H., Malcom K. W. Ko, Jackman C. H., Plumb R. A., Kaye J. A. and Sage K. H., NASA/TM-1999-209554 Report (1999).
[16] M´egie G. and Menzies R. T., Appl. Opt., 19 (1980) 1173.
[17] Pazmi˜no A., Lavorato M. B., Fochesatto G. J., Ristori P. R., Cesarano P. A.,
Castell´on M. L., Quel E. J., Godin S., Porteneuve J. and M´egie G., Advances in Laser Remote Sensing, Selected Papers of 20th ILRC, 373-376, edited by Dabas A., Loth C. and Pelon J. (Par´ıs) 2001.
[18] Brasseur G. P., Orlando J. J. and Tyndall G. S., Atmospheric Chemistry and Global Change (Oxford University Press) 2001, pp. 501-506.
[19] Piacentini R. D., Crino E., Sirur Flores J. and Ginzburg M., Adv. Space Res., 29 (2002) 1643.
[20] Stamnes K., Tsay S. C., Wiscombe W. and Jayaweera K., Appl. Opt., 27 (1988) 2505.
[21] Schwander H. et al., J. Geophys. Res., 102, D8 (1997) 9419.
[22] Piacentini R. D., Cede A. and Nu˜nez L., presented at the SPARC (Stratospheric
Processes and their Role in Climate) 2000 Conference, Mar del Plata, Argentina, November 6-10, (2000) P/4.22.
[23] Long C. S., SPARC (Stratospheric Processes and their Role in Climate), Newsletter N◦21 (2003) pp. 21-23.
[24] Stengel F. (President of Argentina Skin Cancer Foundation), personal communication. [25] Freedberg I. M., Eisen A. Z. and Wolf K. (Editors), in Fitzpatrick’s Dermatology in
General Medicine (Mc Graw-Hill) 1999.
[26] McIntyre M., Philos. Trans. R. Soc. (London), 296 (1980) 129. [27] McIntyre M. and Palmer T., J. Atmos. Terr. Phys., 46 (1984) 825.
[28] Nash E. R., Newman P. A., Rosenfield J. E. and Schoeberl M. E., J. Geophys. Res., 101 (1996) 9471.