HAL Id: insu-03040903
https://hal-insu.archives-ouvertes.fr/insu-03040903
Submitted on 3 Feb 2021
HAL is a multi-disciplinary open access
archive for the deposit and dissemination of
sci-entific research documents, whether they are
pub-lished or not. The documents may come from
teaching and research institutions in France or
abroad, or from public or private research centers.
L’archive ouverte pluridisciplinaire HAL, est
destinée au dépôt et à la diffusion de documents
scientifiques de niveau recherche, publiés ou non,
émanant des établissements d’enseignement et de
recherche français ou étrangers, des laboratoires
publics ou privés.
Correlation of ozone loss with the presence of volcanic
aerosols
Thomas J. Mcgee, Paul Newman, Michael Gross, Upendra Singh, Sophie
Godin, Anne-Marie Lacoste, Gérard Mégie
To cite this version:
Thomas J. Mcgee, Paul Newman, Michael Gross, Upendra Singh, Sophie Godin, et al.. Correlation of
ozone loss with the presence of volcanic aerosols. Geophysical Research Letters, American Geophysical
Union, 1994, 21 (25), pp.2801-2804. �10.1029/94GL02350�. �insu-03040903�
GEOPHYSICAL RESEARCH LETTERS, VOL. 21, NO. 25, PAGES 2801-2804, DECEMBER 15, 1994
Correlation of ozone loss with the presence
of volcanic aerosols
Thomas
J. McGee,
• Paul Newman,
• Michael
Gross,
2 Upendra
Singh,
2 Sophie
Godin,
s Anne-Marie
Lacoste,
s and Gerard
Megie
s
Abstract. Statistically significant reductions
of ozone
compared
to a climatological
profile have been measured
above the Observatoire
de Haute Provence (OHP) in
Southern
France (43.9øN, 5.7øE) during the months
of
July and August, 1992. Lidar profiles of ozone,
temperature
and aerosols
were recorded
on 25 separate
nights
during
that
time. The change
in the ozone
profile
is
correlatexl
with the presence
of volcanic
aerosols
from the
eruption of Mt. Pinatubo. The total ozone loss amounts to approximately a 10 % reduction in the total ozone column
over OHP. Introduction
Recent papers (Gleason et al., 1993; Chandra, 1993; Schoeberl et al., 1993) have focussed on the larger than expected global decrease in ozone in 1992. Using data from the TOMS instrument aboard Nimbus 7, Gleason et al. report that average global total ozone is 2 to 3 percent lower than any previous year. The mechanism of the ozone loss is as yet unknown, but is generally thought to be a result of the large influx of stratospheric aerosol from the eruption of Mt. Pinatubo in June, 1991. One of the regions of largest decrease
was the northern mid-latitudes, between 10øN and 60øN, with
the majority of the decrease occurring during the last nine months of 1992. The Goddard Space Flight Center's (GSFC) Stratospheric Ozone Lidar was deployed at the Observatoire de Haute Provence, France (43.9øN, 5.7øE) for nearly two months during this time. Ozone profiles were recorded on 25 nights during July and August, 1992. Our results corroborate the change noted by the satellite data, correlate the change with the Pinatubo aerosol layer, and show the vertical profile of the change.
The GSFC Strataspheric Ozone Lidar
The GSFC Lidar has been described in detail before
(McGee et al., 1991). Subsequent modifications added the capability of collecting Raman scattered signals from atmospheric N 2 . This allowed the instrument to make measurements of ozone in the presence of heavy loadings of volcanic aerosols(McGee et al., 1993). Prior to making these improvements to the system, the presence of aerosols from the
I Laboratory for Atmospheres, NASA/Goddard Space Flight Center,
Greenbelt, Maryland
2 Hughes STX Corp., Lanham, Maryland 3 Service d'Aeronomie du CNRS, Paris, France
Copyright
1994 by the American
Geophysical
Union.
Paper number 94GL02350
0094-8534/94/94GL-02350503.00
eruption of Mt. Pinatubo had made it impossible for the lidar to retrieve an ozone profile below 30 - 32 kin, because of interference from aerosol scattering. Because the Raman
scattered
signal
is dependent
only on scattering
from N2, there
is no scattering component due to aerosols. Extinction due to aerosols must be considered in the Raman data, however, it has significantly less effect on the return signal than the scattering component. This extinction can be calculated direcfiy from the lidar data and available meteorological data. Equally important for the present work are the aerosol parameters which can also be extracted from the combination of Raman and elastically scattered signals. The elastically scattered signal consists of both Rayleigh (molecular) scattering, and Mie (aerosol) scattering, while the Raman signal is directly proportional to pure molecular scattering. Thus, a ratio of the two signals, normalized at a point where only molecular scattering is present, results in a vertical profile of the Aerosol Backscattering Ratio:
ABR.
RWyleigh*Mie
Rayleigh
which is a measure of the concentration of aerosols.
Extinction
and backscatter
coefficients
(similar
to absorption
coefficients) can also be determined from the available data (Ansmann et al., 1992). The ratio of extinction to backscatter
is related
to the aerosol
particle
size distribution
(Artsmann,
et
al., 1993), with a larger ratio indicating
a smaller mean
aerosol
radius.
The GSFC lidar provides
vertical
profiles
of
ozone, temperature, aerosol backscatter ratio, and extinction to backscatter ratio for each night that data is collected.
The ozone measurement is made using a two-color Differential Absorption (DIAL) technique. A XeCI laser
generates
308 nm radiation,
which
is strongly
absorbed
by 03.
The reference
wavelength,
which
is not appreciably
absorbed
by 03, is the output of a XeF laser at 351 nm. It is the
difference
in the slopes
of these
two backscattered
returns,
which
provides
for the retrieval
of an ozone
profile.
Similarly,
the Raman scattered signals at 332 nm and 382 nm can also beused to extract
ozone. In this case
the ozone
absorption
is
contained
in the 332 nm return. The laser pulses
are
synchronized
to be transmitted
about
5 msec
apart
to avoid the
problem of "leakage" of 351 nm radiation into the 332 nm
channel.
On average,
for the OI-IP campaign,
the final lidar
profile is a composite of ozone derived from the Raman returns between 12 and approximately 28 km, and from the
elastic
returns
above
28 kin. Aerosol
parameters
used
in this
work are extracted from a combination of the 382 nm and 351
nm returns.
The lidar instrument deployed to OI-IP was different from the system which operated at Table Mountain, in February, 1992 (McGee et al., 1993) in two ways. At Table Mountain, a single mechanical chopper was used to block lidar returns for all detectors. This shutter began to open when the transmitted beams reached an altitude of 15 kin, and was
completely open by 19 km. There was no observable effect due to signal-induced noise (SIN) (McGee et al., 1991), therefore the photomultiplier tubes were not electronically gated. Also at TMO, no low altitude (below about 25 km)
elastic return was collected. At OI-]P two channels were
added for the collection of Rayleigh backscattered returns below 25 km, and two mechanical choppers were used, one for each of the most sensitive Rayleigh channels. The low sensitivity channels and the Raman channels were not chopped. Again, no electronic gating was used on the unchopped channels because the signal levels are 100 to 1000 times weaker than the high sensitivity Rayleigh channel. The detectors for the high sensitivity Rayleigh channels and for the Raman channels were the same at OI-• as they were at TMO. Thus the validation from that campaign is still valid for the data presented herein. Subsequent analysis showed, however,
that even in the Raman channel, which is three orders of
magnitude down from the Rayleigh channel, there was some evidence of signal-induced-noise. This was corrected during the month of August, 1992, by electronically gating the photomultiplier tubes. Subsequent measurements showed no
effect of the SIN, however total ozone measurements made
before the tubes were gated are an estimated 3-5 % lower than
actual. This bias is discussed further below. We should also
point out, that the total ozone derived from the July balloon flights, agrees very well with total ozone from the lidar data, both on average and individual flights and profiles.
The first of the 25 profiles measured by the GSFC lidar was recorded on July 13, 1992 and the last on August 17, 1992. Five ECC (electrochemical cell) balloon sandes were flown from the observatory during the month of July. Balloon-borne ozone sandes have been flown regularly at OI-]P for 6 years, providing a useful climatology against which to compare the lidar data. Prior to the eruption of Mt.
Pinatubo, Brewer-Mast sandes were flown from OI-]P, and
these were used to construct the balloon climatological profile. It is estimated, that, during the July timeframe, there is less than a 5 % difference between the two types of sandes. The
ozonesandes are normalized to the local Dobson values.
Results
Figure
la is a plot of the average
of the five balloon
sandes flown from OI-IP during the time of the GSFC
deployment
and the lidar data from the same
days. The
balloons were generally flown at night to minimize time
differences between the balloon and lidar measurements.
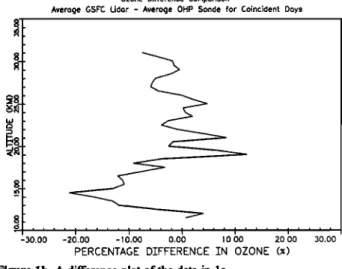
Figure
lb is a difference
plot of the same
average
data,
which
indicates
good
agreement
between
the sandes
and the lidar.
Figure lb indicates
that, although
there is a region
near
15km, where there is a roughly 20% difference, there is no
obvious bias. This difference is well within the standard
deviation of the averages, and because of the absolute concentration of ozone at this altitude, impacts very little on
the total ozone reduction.
Using all the lidar data collected during the month of July (16 separate profiles) and the five ozone sandes flown at OI-IP during July, 1992, we constructed a combined, average vertical profile using the sonde data from the ground up to 16 km, and the lidar data above 16 km. There are two sources of
climatological
ozone
data available
at OI-]P.
Balloon
sandes
have been flown there since 1985 and the OHP lidar has mademeasurements'of ozone there on a regular basis over the same time frame. Prior to the eruption of Mt. Pinatubo, in June,
GSFC Lidor and OHP Sonde Ozone Profiles
Average Profiles for Coincident Days in July/August lClCl2 at OHP
LEGEND GSFC Ave. OHP Ave.
0.00 1.00 2.00 3.00 4.00 5.00 6.00
OZONE NUMBER DENS•'Y (CM**-3) .10 '2
Figure la. A comparison of the lidar and ECC balloon sandes at OHP
during the month of July, 1992. The average of five balloon sandes and of the five lidar profiles from the same days are shown in the figure. Note that the symbols are only to delineate the profiles; there are many more data points than symbols. Error bars are tied to data points, not
symbols.
ozone
Difference
Comparison
Average GSFC Lidor - Average OHP Sonde for Coincident Days
-30.00 -20.00 - 10.00 0.00 10.00 20.00 30.00 PERCENTAGE DIFFERENCE IN OZONE (x)
Figure lb. A difference plot of the data in la.
Ozone Comparison: GSFC Lidor Average Profile for July lClCl2 versus the July Sonde and Lidar Climatology at OHP, France
LEGEND
GSFC, July l qq2
OHP Lidor, July
OHP Sonde, July
0.00 • .00 2.00 3.00 4.00 5.00 6.00
OZONE NUMBER DEN$•'Y (CM**-3) .10 •2
Figure 2. A comparison of the average of all the GSFC lidar data obtained in July "92 with climatological ozone profiles from both balloon
sandes and from OHP lidar measurements. These climatological profiles
were made up of profiles measured during July in the years prior to the eruption of Mt. Pinatubo (1985 - 1990). There were ten sandes flown
which are included in the balloon profile, and 39 profiles in the OHP lidar profile.
TOMS 44øN 2.5øE, 1979-90
360
340
183 193 203 2 I$ 224 234 244
Day number
H•ure 3. A plot of the Nimbus 7 TOMS total column ozone data taken over OHP between 1979 and 1990, from July 1 to August 31. The solid line indicates the average of all the 12 years of data, and the shaded area shows the total spread of all the data. Data from 1992 are shown as the black circles. A large number of "record" low values of total ozone were
observed in 1992.
Totel Ozone at OHP July,92 TOMS and Lidor Data 350 , , ß . , ß , ... 34O
I ,, TOMS
Data
330 ß ß
J ½ Lidor
Data
320310
ß ß ß
ß •
ß
300 . * 280 ß ß 270 260 ... 194 196 198 200 202 204 206 208 210 212 214 Day NumberFigure 4. A plot of the total ozone measured from the TOMS instrument
during July, 1992, and of the total ozone from the lidar measurements on the same days. There is an offset which is discussed in the text, but the slopes of the lines are in good agreement.
1991, 10 balloon sondes were flown during July and 39 lidar measurements were made during the same time period. All but one of the balloon sondes used in the climatology were flown after the 10th of July, which overlaps well with the
GSFC lidar data in 1992, which was all recorded after the
12th. The lidar climatology is made up of all the measurements made during July, prior to 1991. The OI-IP lidar climatological profile extends from 20kin up to approximately 48 lcm. Figure 2 shows a plot of the GSFC lidar data recorded in 1992 along with the balloon and OI-IP lidar climatological profiles. There were, unfortunately, too few sondes flown at OI-• during August to construct a satisfactory climatological profile. There is an obvious difference between the July, 1992 lidar data and the climatology, particularly between 10 and approximately 28 kin. Because the OI-IP lidar climatology only extends down to 20 kin, it therefore misses a large portion of the ozone reduction noted when using the balloonsonde climatology, but over the range that the two overlap there is good agreement. The difference through most of this range is substantially larger than the standard deviations of the respective averages. This significant reduction in ozone is thus born out in the comparison of the 1992 lidar data with two independently measured climatological profiles. In this study we have not included any July, 1992 OHP lidar data because of the difficulties involved in trying to extract ozone information from a purely elastic scattered return, when there is a heavy aerosol loading.
ff the combined lidar/sonde profile is integrated and the US Standard Atmosphere is used above 50 kin, the total column ozone amounts to 284 Dobson Units (DLO, for the July, 1992 average profile, whereas the climatological profile integrates to 332 DU, a difference of 48 DU corresponding to
14 % less total column ozone in 1992.
The 1992 July and August TOMS data for the nearest grid point to OI-IP are plotted in Figure 3, against the 12 year average for the same months at the same grid point. The shaded area on the figure corresponds to the range of values recorded over the 12 years. The 1992 ozone levels are significantly lower than the average, and after about the 12th of July (day 195), most of the TOMS values are lower than the lowest values recorded in the previous 12 years. As
mentioned above, all of the GSFC data were obtained after the
12th. The average of the TOMS data in 1992 for those days
on which lidar data were obtained is 308 4- 9 DU. The
decrease in the total ozone from the TOMS July average is
approximately 27 DU, which amounts to an ozone reduction of nearly 10% . The climatological profile integrated column of 332 DU agrees quite well with the 12 year TOMS average for July, but the 1992 lidar data is somewhat lower than the July, 1992 TOMS measurements. We have plotted the TOMS measurements and the total ozone integrated from the lidar data in Figure 4. Each set of data has been fit to a straight
Aerosol Scattering Ratio at 351nm July 1992 Average, GSFC Lidor at OHP, France
1,00 1.10 1.20 1.30 1.40 1.•0 1.•0 1.70 1.80 i eo 2.00 SCATTERING RATIO (351 NM)
H•ure 5a. A plot of the Aerosol Scattering Ratio which shows the
vertical distribution of volcanic aerosols during July, 1992, above OHP. This is an average of the 14 nights in which lidar data was recorded.
Ozone Differences: OHP Lidor Climatology, OHP Sonde Cllmotology, GSFC Lidor Data for July 1992 and OHP Sonde Data for July lqq2
• Lid. Clim.-GSFC • (
• Son. Clim.-GSFC e•e ,,,,, _
_So.n.
Cli•,.-Son,
=-
=
•
•8
--80.00 -•.00 -4•.00 -3d.00 -2(•.00 - :,d.o• - •.•o - ,o.•o •o.oo
PERCENTAGE DIFFERENCE IN OZONE (x)
H•ure 5b. The difference plot between the climatological profiles and the average of the fourteen July, 1992, lidar ozone profiles. The peak of the reduction in ozone is slightly lower than the peak of the aerosol layer, but it can be seen that the change in ozone occurs in the region of
line. The slopes of these lines are identical within the
uncertainties of the fit, but there is an obvious bias between
the data sets with the lidar data being lower than the TOMS. The lidar data compared to the sonde climatology shows a reduction in total ozone of about 14 %, while the TOMS July '92 data (taken on the days that the lidar made measurements)
shows a reduction of about 10 %. This 4 % difference between
the lidar/sonde data and the TOMS data is within the estimate
of error due to residual non-linearities in the Raman channels
of the lidar. Another potential source of error is the extrapolation of ozone from the top of the lidar profile, although we would expect this to be small.
Several caveats must be applied to these data. Firstly, the TOMS grid point is not directly over OHP, and the data point encompasses a much larger area than either the balloon sondes or the lidar profiles. Most important is the fact that there are only ten balloon soundings in the climatology which were flown over the 6 years before the eruption of Mt. Pinatubo. The balloon sondes are generally considered to be accurate to within + 10% which is borne out in Figure lb. The discrepancy of 21 DU between the lidar/balloon data and the TOMS data is larger than expected. The TOMS data is known to have a 4.5 % bias compared to the World Standard Dobson Instrument No. 83 (McPeters and Kohmyr, 1991),
however thhis should not be a factor when the TOMS data is
compared with the TOMS climatology.
The more significant point we wish to make is the overlap of the volcanic aerosol layer with the region of reduced ozone. Figure 5a is a plot of the Aerosol Backscatter Ratio, deftned above, which is a measure of the scattering due to aerosols. Experimentally, the ratio is formed by normalizing the Raman scattered return at 382 nm to the elastically scattered return at 351 rim, and dividing the normalized Raman return (corrected for the wavelength dependence of the Rayleigh and Raman scattering) into the
elastic return. The two returns are normalized between 30 and
35 kin, where aerosol scattering is negligible. It can be seen that there is significant Mie scattering between 14 and 27 kin. The feature at 10-12 km is due to scattering from a layer of cirrus clouds that was often seen in this altitude range. The remainder of the enhanced aerosol scattering displays
extinction to backscatter ratios which are consistent with
volcanic aerosols. This aerosol layer corresponds directly with the ozone deficit measured during July, 1992. Figure 5b is a difference plot displaying the percent difference between the climatological profiles and the average GSFC lidar profile measured over OHP during the latter half of July, 1992.The lidar average is made up of all the lidar profiles recorded during July, 1992. Both traces show that the measured ozone depletion is correlated with the region of the atmosphere which has heavy aerosol loading. The comparison of the lidar data with both climatologies indicates that there is a major
reduction in ozone between 14 and 24 lcm, which amounts to
approximately 10 % of the total column content of ozone. There are several ways that the presence of aerosols
can affect the concentration of ozone. There can be
modification of the "normal • chemistry by the hydrolysis of N20 s on the surface of the aerosol particles (evidence for this has been presented by Webster et al., 1994); a change in ozone transport caused by aerosol induced radiative heating; or from subsequent changes in photochemical production and loss processes because of aerosol heating (Gleason et al., 1993). Without additional chemical data, however, it is
impossible to determine the exact mechanism for the observed reduction in ozone. Hofmann et al., (1994) have reported a similar finding over Wallops Island, Va and Boulder, Co during 92-93 and have linked the changes to heterogeneous chemistry.
In summary we have reported direct evidence of a large depletion of ozone in the same altitude regime which shows heavy aerosol loadings from the 1991 eruption of Mt. Pinatubo. At some altitudes the reduction of ozone approaches 40%. The coincidence of the aerosol layer and the ozone loss strongly suggests that the mechanism of the depletion somehow involves the presence of the aerosols. The exact nature of the mechanism for the change in ozone, however
remains uncertain.
Acknowledgements. The authors from GSFC would like to thank the
staff at OHP for their assistance in making the deployment successful.
This research was supported by the NASA Upper Atmosphere Research
Program and by the UARS Correlative Measurements Program. Funding
for travel expenses came in part from SPA-AFEAS, INC. The authors
would also like to thank the members of the GSFC Ozone Processing
Team for providing the TOMS data used in this paper.
References
Ansmmm, A., M. Riebesell, U. Wandinger, C. Weitkamp, E. Voss, W.
Lanmmm, and W. Michaelis, "Combined Raman Elasfic-Backscatter Lidar for Vertical Profiling of Moisture, Aerosol Extinction, Backscatter, and Lidar Ratio",,qppl. Phys. B, 55, 18-28, 1992. Arismann, A., U. Wandinger, and C. Weitkamp, "One-Year
Observations ofMt. Pinatubo Aerosol with an Advanced Raman Lidar
over Germany at 53.5 ø N", Geophys. Res. Lett., 20, 711-714, 1993. Chandra, S., "Changes in Stratospheric Ozone and Temperature Due to the Eruptions of Mt. Pinatubo", Geophys. Res. Lett., 20, 33-36, 1993. Gleason, J.F., P.K. Bhartia, J. il Herman, Il McPeters, P. Newman, IlS.
Stolarski, L. Flynn, G. Labow, D. Larko, C. Sefior, C. Wellemeyer, W.D. Kohmyr, A.J. Miller, and W. Planet, "Record Low Global Ozone in 1992", Science, 260, 523-526, 1993.
Hofmann, D.J., et al., "Ozone loss in the lower stratosphere over the United States in 1992-1993' Evidence for heterogeneous chemistry on the Pinatubo aerosol", Geophys. Res. Lett., 21, 65-68, 1994. McGee, T.J., M.R. Gross, R.A. Ferrare, W.S. Heaps, and U.N. Singh,
"Raman Lidar measurements of stratospheric ozone in the presence of volcanic aerosols", Geophys. Res. Lett., 20, 955-958, 1993. McGee, T.J., D. Whiteman, Il Ferrare, J.J. Butler and J. Burris,
"STROZ LITE: Stratospheric Ozone Lidar Trailer Experiment", Opt. Eng., $0, 31-39, 1991.
McPeters, IlD., and W.D. Kohmyr, "Long-Term Changes in the Total Ozone Mapping Spectrometer Relative to World Primary Standard Dobson Spectrometer 83", J. Geophys. Res., 96, 2987-2993, 1991. Schoeberl, M. II, P.K. Bhartia, E. Hilsenrath, and O. Torres, "Tropical
Ozone Loss following the Eruption of Mt. Pinatubo", Geophys. Res. Lett., 20, 29-32, 1993.
Webster, C.R., et. al., "Balloon profiles of stratospheric NO 2 and HNO 3 for testing the heterogeneous hydrolysis of N20 s on sulfate aerosols",
Geophys. Res. Lett., 21, 53-58, 1994.
(Received' January 6, 1994; Revised: May 16, 1994; Accepted: July 27, 1994)