HAL Id: hal-00298865
https://hal.archives-ouvertes.fr/hal-00298865
Submitted on 25 Jul 2007HAL is a multi-disciplinary open access
archive for the deposit and dissemination of sci-entific research documents, whether they are pub-lished or not. The documents may come from teaching and research institutions in France or abroad, or from public or private research centers.
L’archive ouverte pluridisciplinaire HAL, est destinée au dépôt et à la diffusion de documents scientifiques de niveau recherche, publiés ou non, émanant des établissements d’enseignement et de recherche français ou étrangers, des laboratoires publics ou privés.
Local ?18O and ?
2H variability in UK rainfall
M. D. Jones, M. J. Leng, C. Arrowsmith, C. Deuchars, J. Hodgson, T. Dawson
To cite this version:
M. D. Jones, M. J. Leng, C. Arrowsmith, C. Deuchars, J. Hodgson, et al.. Local ?18O and ?2H variability in UK rainfall. Hydrology and Earth System Sciences Discussions, European Geosciences Union, 2007, 4 (4), pp.2403-2423. �hal-00298865�
HESSD
4, 2403–2423, 2007 δ18O and δ2H variability in UK rainfall M. D. Jones et al. Title Page Abstract Introduction Conclusions References Tables Figures ◭ ◮ ◭ ◮ Back CloseFull Screen / Esc
Printer-friendly Version
Interactive Discussion
EGU
Hydrol. Earth Syst. Sci. Discuss., 4, 2403–2423, 2007 www.hydrol-earth-syst-sci-discuss.net/4/2403/2007/ © Author(s) 2007. This work is licensed
under a Creative Commons License.
Hydrology and Earth System Sciences Discussions
Papers published in Hydrology and Earth System Sciences Discussions are under open-access review for the journal Hydrology and Earth System Sciences
Local δ
18
O and δ
2
H variability in UK
rainfall
M. D. Jones1, M. J. Leng1,2, C. Arrowsmith2, C. Deuchars3, J. Hodgson4, and T. Dawson5
1
School of Geography, University of Nottingham, UK
2
NERC Isotope Geosciences Laboratory, British Geological Survey, Keyworth, UK
3
Waterways Science Group, 2 Repton Road, Long Eaton, UK
4
British Geological Survey, Keyworth, UK
5
Meteorological Office, Watnall, UK
Received: 5 July 2007 – Accepted: 16 July 2007 – Published: 25 July 2007 Correspondence to: M. D. Jones ([email protected])
HESSD
4, 2403–2423, 2007 δ18O and δ2H variability in UK rainfall M. D. Jones et al. Title Page Abstract Introduction Conclusions References Tables Figures ◭ ◮ ◭ ◮ Back CloseFull Screen / Esc
Printer-friendly Version
Interactive Discussion
EGU
Abstract
Rainfall collected twice weekly from 3 nearby UK stations between November 2004 and October 2006 allows local differences in δ18O and δ2H to be observed. Local gradients in δ18Opappear to be of the same order of magnitude as national trends, suggesting the spatial δ18Op picture is more complicated than the one currently available from 5
sparse GNIP coverage. Comparing data from this study with previous work we find that average δ18Op has changed in the UK over the last 20 years concurrent with an average temperature increase although inter-annual controls on the values remain sea-sonal temperature and the amount of precipitation in each rain event. Climate-isotope relationships observed from the weekly data do not explain the observed decadal scale
10
shifts.
1 Introduction and background
The ratios of the stable isotopes of oxygen (18O, 17O, 16O) and hydrogen (2H, 1H) change through the various stages of the hydrological cycle due to fractionation pro-cesses during evaporation and condensation (e.g. Darling et al., 2006). Light isotopes
15
are preferentially evaporated and heavy isotopes preferentially condensed. The result of these processes is varying values for δ18O (the standard notation for describing the 18
O to16O ratio) and δ2H (for the ratio of2H to1H) recorded in space and time. Since these patterns where first described (Craig, 1961, Dansgaard, 1964) a number of further studies have shown common relationships between precipitation δ18O and
20
δ2H values (from here on δ18Op and δ
2
Hp) with changing temperature, precipitation amount, continentality, altitude and latitude (e.g. Rozanski et al., 1993). The theory behind these changes will not be described in detail again here (see Darling et al., 2006 for a recent review) but will be discussed in relation to the results where appropriate.
Global patterns of δ18Opand δ2Hpare now generally well understood thanks to the
25
HESSD
4, 2403–2423, 2007 δ18O and δ2H variability in UK rainfall M. D. Jones et al. Title Page Abstract Introduction Conclusions References Tables Figures ◭ ◮ ◭ ◮ Back CloseFull Screen / Esc
Printer-friendly Version
Interactive Discussion
EGU
studies are often undertaken e.g. Argiriou and Lykoudis (2006). Darling and Talbot (2003) described the controls on isotopes in precipitation in the UK based largely on data from 3 sites (Valentia, Wallingford and Keyworth) at various time scales between 1979 and 1996. They show that the strongest climatic controls on isotope values in UK rainfall were temperature, explaining up to 87% of the isotope variability for
aver-5
aged monthly values over 19 years at Wallingford, and rainfall amount, which explained 25% of the inter-monthly variability over the same time period. They also noted signif-icant altitude effects over high ground of between –0.3‰ and –0.2‰ δ18O per 100 m. Changes in continentality between sites lead to differences between the intra-annual δ18Oprange and mean weighted values, due to rain out effects from the coastal site at
10
Valentia to the inland sites of Wallingford and Keyworth.
Changes in δ18Opare used to understand current (e.g. Bowen and Wilkinson, 2002) and past climate (e.g. Hammurland et al., 2002) and hydrological systems (e.g. Goller et al., 2005; Rodgers et al., 2005 ). Due to logistical constraints our current understand-ing is based largely on the GNIP network which may only have one or two stations per
15
country, and not necessarily close to sites where δ18Opdata is required. Where new collection sites are initiated it is often not possible to collect samples for long periods of time to fully understand the local controls and relationships from the nearest GNIP station are therefore used (Jones et al., 2005).
Here we examine the relationship between recent (2004–2006) δ18Op and δ2Hp
20
records from Keyworth (52◦52′42′′N, 1◦4′46′′W; 65 m a.s.l.) and two new nearby col-lection stations at Sutton Bonington (52◦52′42′′N, 1◦14′46′′E; 48 m a.s.l.) and Watnall (53◦0′20′′N, 1◦15′5′′E; 117 m a.s.l.) and compare local variability with the national pat-terns described by Darling and Talbot (2003). By comparison with previous collection periods this new data also allow us to look at how δ18Oppatterns observed at Keyworth 25
HESSD
4, 2403–2423, 2007 δ18O and δ2H variability in UK rainfall M. D. Jones et al. Title Page Abstract Introduction Conclusions References Tables Figures ◭ ◮ ◭ ◮ Back CloseFull Screen / Esc
Printer-friendly Version
Interactive Discussion
EGU
2 Methodology
Samples were collected from the 3 sites (Fig. 1) between November 2004 and end October 2006 as part of a larger project monitoring changes in lake water isotope values which will be discussed elsewhere. Rain water was collected twice-weekly from Sutton Bonington and Watnall and weekly from Keyworth using standard 5-inch rain
5
gauges.
All samples for isotope analysis were collected in airtight polyethylene bottles. Un-filtered samples from each of the sites were subsequently treated by Cr reduction to generate hydrogen for2H/1H analysis. For18O/16O analysis samples were equilibrated with CO2using an ISOPREP 18 device. Mass spectrometry was performed on a
Mi-10
cromass IsoPrime (δ2H) and VG SIRA (δ18O) in conjunction with laboratory standards calibrated against VSMOW and SLAP at the NERC Isotope Geosciences Laboratory (NIGL), UK. NIGL participates in the IAEA lead inter-laboratory comparison for stable isotope analysis of precipitation. Results are reported in the usual δ notation in per mille (‰) versus V-SMOW. Analytical errors are less than 0.05‰ for δ18O and 1‰ for
15
δ2H.
Meteorological observations are made daily at all three sites. At Keyworth vations are made at 09:00 GMT, Sutton Bonington data comes from the hourly obser-vations made by an automated recording station, and data from Watnall was obtained from the British Atmospheric Data Centre and includes total precipitation for the
half-20
week samples, twice daily measurements of temperature and the average of hourly wind data. The Sutton Bonington instruments were moved to a new, nearby, site in May 2005.
3 Results
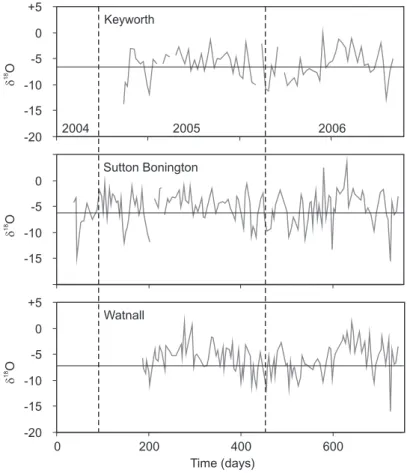
δ18Opvalues at the three sites range between –16.0‰ and +3.5‰ (Fig. 2). The range 25
HESSD
4, 2403–2423, 2007 δ18O and δ2H variability in UK rainfall M. D. Jones et al. Title Page Abstract Introduction Conclusions References Tables Figures ◭ ◮ ◭ ◮ Back CloseFull Screen / Esc
Printer-friendly Version
Interactive Discussion
EGU
–15.5 to +3.5‰; Watnall –16.0 to +1.2‰) and this is probably due to the effect of the lower sampling resolution smoothing shorter rain events. Weighted average δ18Op values for the three sites over the common time period April 2005 to September 2006 (not including August and September 2005 for all sites, as there was no rainfall amount data available from Watnall) are –6.5‰ (Sutton Bonington), –6.6‰ (Keyworth) and
5
–7.2‰ (Watnall).
Although the Keyworth record is sampled at a lower resolution than the other two sites there are similarities between the three δ18Optime series (Fig. 2). Values for δ2H are not shown due to the strong co-variation between the two data sets. In general summer precipitation is more positive (heavier) than winter values (Table 1) although
10
there is a high frequency signal on top of the seasonal sinusoidal variation. Some individual events are visible at all three sites, particularly large negative excursions at days 147, 202 and 721.
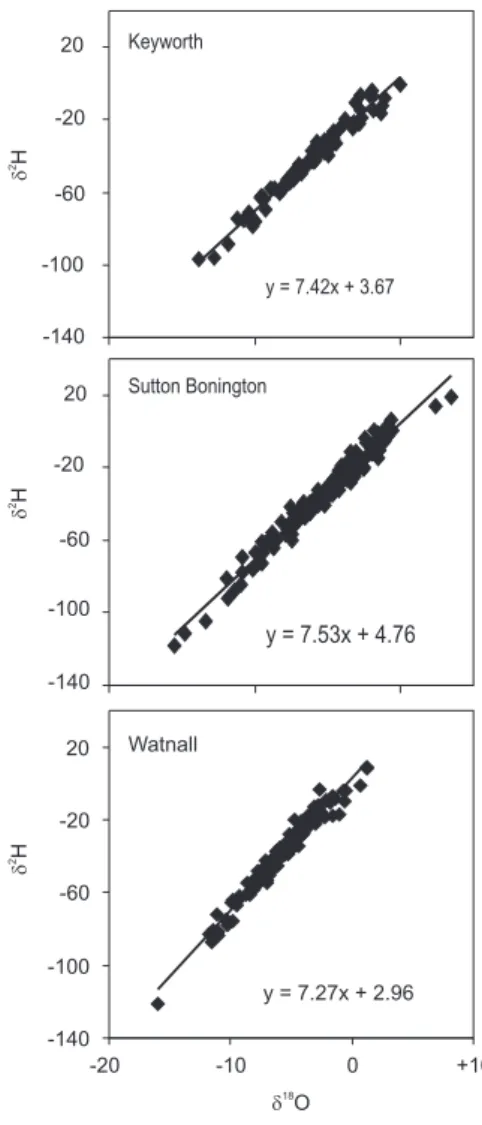
There are similarities between the oxygen-hydrogen (δ2H v. δ18O) relationships be-tween the three sites (Fig. 3). The changes in gradient, bebe-tween 7.3 and 7.5, and
15
intercept values (3.0 to 4.8) are within analytical errors and are therefore considered to be the same. There are differences between summer (JJA) and winter (DJF) meteoric water lines (Table 1). Summer gradients are much shallower at all 3 sites (6.6–6.9) with much lower intercepts (0.2-1.6) relative to the other seasons (Table 1).
4 Discussion
20
4.1 Climate controls on δ18Op
Comparison of the δ18Op data with meteorological observations at the three sites al-lows us to look at the controls on the isotope values of precipitation. Darling and Talbot (2003) showed that different climate-δ18Oprelationships are found when using differ-ent sampling resolutions. Data from the GNIP database, for example, is usually given
25
HESSD
4, 2403–2423, 2007 δ18O and δ2H variability in UK rainfall M. D. Jones et al. Title Page Abstract Introduction Conclusions References Tables Figures ◭ ◮ ◭ ◮ Back CloseFull Screen / Esc
Printer-friendly Version
Interactive Discussion
EGU
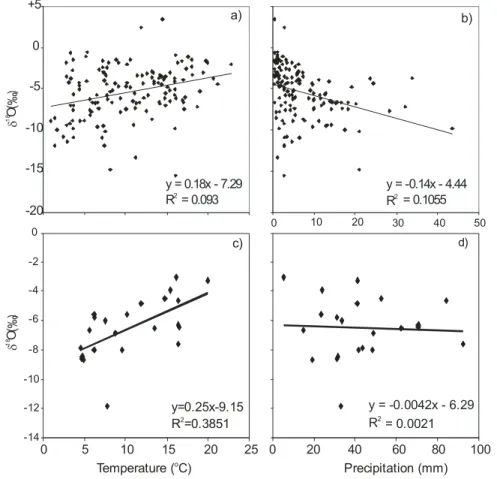
isotope sample period for each of the three sites i.e. weekly or half-weekly. As hourly data is available from Sutton Bonington (our longest data set) we use this station to look at differences in the climate-δ18Op relationships when using only the conditions during rainfall hours, and to look at the relationships when using monthly average val-ues. By looking at relationships over various time scales we hope to explain more of
5
the variability in δ18Op.
Comparing each δ18O value with the average meteorological conditions during the sample period (Table 2) shows that the strongest relationships with δ18Op are with temperature and the amount of precipitation, as found by Darling and Talbot (2003). Precipitation amount shows more control in summer and winter compared to the
tran-10
sitional seasons, explaining 50% of the δ18Op variability in summer precipitation at Watnall, 38% at Sutton Bonington and 28% in Keyworth. Temperature explains very lit-tle variability in autumn and summer values but can explain up to 26% of the variability (Watnall) when all the samples are taken into account. Wind direction and wind speed explain very little of the variability.
15
Kohn and Welker (2005) show that isotope-climate relationships can change when looking only at the meteorological conditions at the time of rainfall. Using this data from Sutton Bonington no new relationships are apparent (Table 3) although slightly more of the variance is explained. 26 of the 142 samples from Sutton Bonington are from individual rainfall events. Using only these samples only 16% of the δ18Opvariability is
20
explained by rainfall amount and only 4% by temperature.
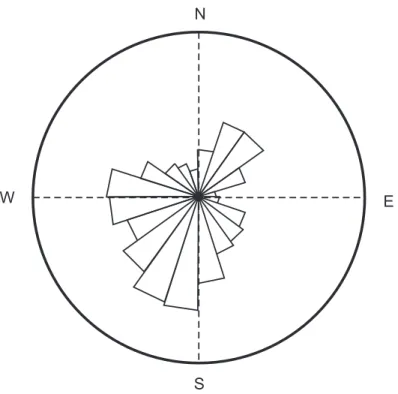
The wind direction during rainfall events is largely from the south west, although there is a second dominant direction from the north east (Fig. 4). Taking the average wind direction over the sample periods only 6 out of the 146 sample have an average north east (0 to 45 degrees) wind direction, compared to 36 from the south west (180 to 225
25
degrees). Mean values for these two groups are different, –3.4±2.4‰ and –5.3±2.8‰ respectively (mean value ± standard deviation), although there are too few samples form the north east to make significant statistical comparisons.
av-HESSD
4, 2403–2423, 2007 δ18O and δ2H variability in UK rainfall M. D. Jones et al. Title Page Abstract Introduction Conclusions References Tables Figures ◭ ◮ ◭ ◮ Back CloseFull Screen / Esc
Printer-friendly Version
Interactive Discussion
EGU
erage δ18Opvariability is explained by the amount of monthly rainfall whereas average monthly temperatures explain 39% of the variability. Figure 5 shows the differences in the relationships between the individual sample data and monthly data from Sutton Bonington. Not only does the strength of the relationships alter but also the gradients of change. The δ18Optemperature relationship for the monthly data is 0.25‰ per ◦C,
5
compared to 0.18‰ per◦C for the half weekly samples. These gradients are similar to those found previously for the UK (Darling and Talbot, 2003).
The data suggest that δ18Opvariability at these three stations is due to short term changes in the amount of precipitation on top of longer term, seasonal, changes in temperature. These results are similar to those found by Darling and Talbot (2003) and
10
show that at least on an intra-annual level there have be no changes in the controls on UK δ18Opover the last 10 years.
4.2 δ2Hpv. δ
18 Op
The differences between the 3 sites for the gradient and intercept values of the meteoric water lines are greater than those between Valentia and Keyworth (Darling and Talbot,
15
2003); however given the errors on the δ2H data in particular we can not draw any conclusions from these differences. The values for A and B (where δD = Aδ18O + B) are similar to those reported by Darling and Talbot (2003) for the period 1989-1992 and 1995-1996. Given that thee values are controlled by the condensation of atmospheric vapour and relative humidity at the source area respectively the data suggest that there
20
has been no major shift in the UK rainfall source area in the past decade. 4.3 Spatial variability in δ18Op
There are significant differences between the mean weighted average values of δ18Op from the 3 sites (Table 1) with the value from Watnall (–7.2‰) much less than that at Sutton Bonington (–6.5‰) and Keyworth (–6.6‰). The difference in height of the
25
HESSD
4, 2403–2423, 2007 δ18O and δ2H variability in UK rainfall M. D. Jones et al. Title Page Abstract Introduction Conclusions References Tables Figures ◭ ◮ ◭ ◮ Back CloseFull Screen / Esc
Printer-friendly Version
Interactive Discussion
EGU
Bonington) is not enough to explain this difference. Given a height effect of between –0.2 and –0.3‰ per 100 m (Darling and Talbot, 2003) only 0.1 to 0.2‰ of the difference can be explained.
The most likely cause of spatial change in δ18Opwould be due to rainout, with lighter rain falling further along the predominant rain track as heavy isotopes are preferentially
5
rained out. As dominant winds are from the south and west the rainout hypothesis would fit the data. Of interest is the size of the rainout gradient over this small region. Darling and Talbot (2003) showed that the difference in mean weighted δ18O between Valentia and Keyworth, a distance of 650 km, is approximately 2‰. This difference was attributed to rainout. Our data show a change of 0.7‰ over just 20 km.
10
This much steeper local δ18Op gradient, compared to the one observed nationally, has implications for understanding the way rain bearing air masses develop across the UK. Some difference may be explained by the differences in northeast and southwest rains although for the few samples here northeast rains are more positive than those from the southwest, opposite to the spatial trend observed.
15
The local δ18Op gradient suggests that air masses may travel for some distance overland before any rain falls, or that new moisture is picked up on route. If this is the case the differences between mean weighted δ18Op values in Valentia and Keyworth must be the result of much more complex processes than simply rainout. A much denser network of sampling stations across a much wider area is needed to be able to
20
investigate these patterns further. 4.4 Long term change
Prior to this study rainfall isotope values are available from Keyworth between 1985 and 1996 (Darling and Talbot, 2003). Our new data allow us to observe any changes in patterns over the last 20 years. The equivalent 19 months data were compared for the
25
periods 1985–1986, 1995–1996 and 2005–2006 (Table 4). The weekly data set from the current study was transformed to monthly data using weighted average values.
HESSD
4, 2403–2423, 2007 δ18O and δ2H variability in UK rainfall M. D. Jones et al. Title Page Abstract Introduction Conclusions References Tables Figures ◭ ◮ ◭ ◮ Back CloseFull Screen / Esc
Printer-friendly Version
Interactive Discussion
EGU
Given the relationship of δ18Op with temperature, at least on longer time scales, this would be expected as the 2005–2006 period is considerably warmer than the other two (Table 4). However the size of the change (1.3‰) is 0.8‰ greater than would be expected from the δ18Op temperature relationships from the monthly data. It would be expected that the 1995–1996 period would also be heavier than 1985–1986 given
5
the temperature trend however the values remain the same from 1985–1986 despite the 1.1◦C increase in average temperature. 1995 to 1996 was much drier, although this can’t explain the difference between the mean values and that expected with the change in temperature, because drier conditions should also push δ18Opvalues more positive, according to the δ18Op precipitation amount relationships observed in the 10
bi-weekly data.
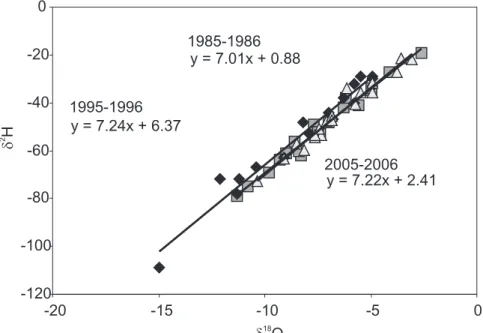
The δ18O - δ2H relationship is also different during 1995–1996 (Fig. 6) when com-pared to the other collection periods. For any given value of δ2H the δ18O values were approximately 0.7‰ lighter than during the other 2 time periods. Correcting the weighted average 1995–1996 δ18Opdata by 0.7‰ would lead to average values
mid-15
way between 1985–1986 and 2005–2006 and fit the temperature trend. It is unclear what conditions would lead to this difference, and 3 time periods is a small number to draw any significant conclusions, however it would appear that global temperature trends are affecting the δ18O values of UK precipitation, although other factors are also important.
20
5 Summary and conclusions
Average δ18Op has changed in the UK over the last 20 years concurrent with an av-erage temperature increase although the inter-annual controls on the values remain seasonal temperature and the amount of precipitation in each rain event. How temper-ature and precipitation amount control the longer, inter-decadal variability is still unclear
25
HESSD
4, 2403–2423, 2007 δ18O and δ2H variability in UK rainfall M. D. Jones et al. Title Page Abstract Introduction Conclusions References Tables Figures ◭ ◮ ◭ ◮ Back CloseFull Screen / Esc
Printer-friendly Version
Interactive Discussion
EGU
This suggests that relationships between temperature, rainfall amount and isotopes on a month by month basis are not valid for interpreting longer term changes. This has important implications for interpreting palaeorecords of isotope change.
Local gradients in δ18Op appear to be of the same order of magnitude as national trends, suggesting the spatial picture is more complicated than the one currently
avail-5
able with sparse GNIP coverage. Although the current sampling stations allow global or continental patterns to be observed they do not fully explain variations on the km scale. Extrapolation from near by GNIP stations for local studies may therefore not be always appropriate without local rainfall sampling.
Acknowledgements. We thank D. Waite for collecting the rainfall samples at Watnall. We also
10
thank the NERC Isotope Geosciences Facilities (Grant IP/855/0505) and the School of Geog-raphy, University of Nottingham for funding this work.
References
Argiriou, A. A. and Lykoudis, S.: Isotopic composition of precipitation in Greece, J. Hydrol., 327, 486–495, 2006.
15
Bowen, G. J. and Wilkinson, B.: Spatial distribution of δ18O in meteoric precipitation, Geology, 30, 315–318, 2002.
Craig, H.: Isotopic variations in meteoric waters, Science, 133, 1702–1703, 1961. Dansgaard, W.: Stable Isotopes in Precipitation, Tellus, 16, 436–468, 1964.
Darling, W. G., Bath, A. H., Gibson, J. J., and Rozanski, K.: Isotopes in Water. In: Leng, M. J.
20
(Ed.): Isotopes in Palaeoenvironmental Research, Springer, Dordrecht, 2006.
Darling, W. G. and Talbot, J. C.: The O and H stable isotopic composition of fresh waters in the British Isles. 1. Rainfall, Hydrol. Earth. Syst. Sci., 7, 163–181, 2003.
Goller, R., Wilcke, W., Leng, M. J., Tobschall, H. J., Wagner, K., Valarezo, C., and Zech, W.: Tracing water paths through small catchments under a tropical montane rain forest in south
25
Ecuador by an oxygen isotope approach, J. Hydrol., 308, 67–80, 2005.
Gonfiantini, R.: Environmental isotopes in lake studies, in: Handbook of Environmental Isotope Geochemistry, edited by: Fritz, P. and Fontes, J.-C., 2B, Elsevier, Amsterdam, 119–168, 1986.
HESSD
4, 2403–2423, 2007 δ18O and δ2H variability in UK rainfall M. D. Jones et al. Title Page Abstract Introduction Conclusions References Tables Figures ◭ ◮ ◭ ◮ Back CloseFull Screen / Esc
Printer-friendly Version
Interactive Discussion
EGU
Hammarlund, D., Barnekow, L., Birks, H. J. B., Buchardt, B., and Edwards, T. W. D.: Holocene changes in atmospheric circulation recorded in the oxygen-isotope stratigraphy of lacustrine carbonates from northern Sweden, Holocene, 12, 233–248, 2002.
IAEA/WMO. Global Network of Isotopes in Precipitation. The GNIP Database, Accessible at:
http://isohis.iaea.org, 2001.
5
Jones, M. D., Leng, M. J., Roberts, C. N., T ¨urkes, M. ,and Moyeed, R.: A coupled calibration and modelling approach to the understanding of dry-land lake oxygen isotope records, J. Paleolimnol., 34, 391–411, 2005.
Kohn, M. J. and Welker, J. M.: On the temperature correlation of δ18O in modern precipitation. Earth Planet. Sci. Lett., 231, 87–96, 2005.
10
Rodgers, P., Soulsby, C., and Waldron, S.: Stable isotope tracers as diagnostic tools in up-scaling flow path understanding and residence time estimates in a mountainous mesoscale catchment, Hydrol. Process., 19, 2291–2307, 2005.
Rozanski, K., Araguas-Araguas, L., and Gonfiantini, R.: Isotopic patterns in modern global precipitation, in: Climate Change in Continental Isotopic Records, Geophysical Monograph
15
HESSD
4, 2403–2423, 2007 δ18O and δ2H variability in UK rainfall M. D. Jones et al. Title Page Abstract Introduction Conclusions References Tables Figures ◭ ◮ ◭ ◮ Back CloseFull Screen / Esc
Printer-friendly Version
Interactive Discussion
EGU
Table 1. Summary of δ18O v δ2H relationship for the three sites, using the relationship δD = A
δ18O + B., and weighted average δ18O values.
A B Weighted average δ18O Keyworth All Samples (n=81) 7.4 3.7 –6.6 Winter (n=12) 8.0 10.8 –9.1 Spring (n=25) 7.8 4.7 –6.8 Summer (n=24) 6.4 1.6 –5.5 Autumn (n=20) 7.7 5.5 –7.1 Watnall All Samples (n=118) 7.3 2.8 –7.2 Winter (n=19) 8.1 10.9 –9.1 Spring (n=33) 8.1 7.2 –7.3 Summer (n=35) 6.6 1.6 –6.0 Autumn (n=31) 7.6 6.7 –7.5 Sutton Bonington All Samples (n=142) 7.5 4.8 –6.4 Winter (n=36) 7.8 9.7 –7.3 Spring (n=40) 7.8 4.2 –6.7 Summer (n=33) 6.9 0.2 –5.6 Autumn (n=31) 7.8 6.8 –6.9
HESSD
4, 2403–2423, 2007 δ18O and δ2H variability in UK rainfall M. D. Jones et al. Title Page Abstract Introduction Conclusions References Tables Figures ◭ ◮ ◭ ◮ Back CloseFull Screen / Esc
Printer-friendly Version
Interactive Discussion
EGU
Table 2. Strength of relationship (r2) between δ18Opand selected meteorological variables for all samples. Meteorological variables are averaged over the sample time period, except rainfall (sum).
Precipitation Minimum Maximum Wind Wind Temp. Temp. Direction Speed Keyworth All samples 0.04 0.20 0.25 0.01 0.01 Winter 0.06 0.04 0.19 0.09 0.05 Spring 0.01 0.24 0.15 0.03 0.00 Summer 0.28 0.00 0.09 0.16 0.02 Autumn 0.23 0.00 0.02 0.04 0.19 Watnall All samples 0.15 0.19 0.26 0.00 0.02 Winter 0.37 0.01 0.03 0.01 0.00 Spring 0.09 0.08 0.15 0.04 0.00 Summer 0.50 0.08 0.16 0.07 0.01 Autumn 0.14 0.04 0.07 0.01 0.02 Sutton Bonington Temp.
All samples 0.11 0.09 0.01 0.00
Winter 0.16 0.12 0.13 0.00
Spring 0.15 0.08 0.00 0.00
Summer 0.38 0.03 0.00 0.05
HESSD
4, 2403–2423, 2007 δ18O and δ2H variability in UK rainfall M. D. Jones et al. Title Page Abstract Introduction Conclusions References Tables Figures ◭ ◮ ◭ ◮ Back CloseFull Screen / Esc
Printer-friendly Version
Interactive Discussion
EGU
Table 3. Strength of relationship (r2) between δ18Op and selected meteorological variables for conditions during rainfall hours at Sutton Bonington. Meteorological variables are averaged over the sample time period, except rainfall (sum).
Precipitation Temp. Wind Wind direction speed All samples 0.12 0.11 0.01 0.02 Winter 0.19 0.14 0.17 0.03 Spring 0.11 0.04 0.01 0.01 Summer 0.38 0.10 0.04 0.00 Autumn 0.17 0.12 0.02 0.00
HESSD
4, 2403–2423, 2007 δ18O and δ2H variability in UK rainfall M. D. Jones et al. Title Page Abstract Introduction Conclusions References Tables Figures ◭ ◮ ◭ ◮ Back CloseFull Screen / Esc
Printer-friendly Version
Interactive Discussion
EGU
Table 4. Long term variability in weighted average δ18Op from Keyworth. Values calculated from March year 1 to September year 2. Temperature values are from Sutton Bonington as no data are available for Keyworth in 1985 or 1986.
Time Period Weighted average δ18Op Mean Average Temperature Total Rainfall
(‰) (◦C) (mm)
1985–1986 –7.8 9.5 898
1995–1996 –7.8 10.6 661
HESSD
4, 2403–2423, 2007 δ18O and δ2H variability in UK rainfall M. D. Jones et al. Title Page Abstract Introduction Conclusions References Tables Figures ◭ ◮ ◭ ◮ Back CloseFull Screen / Esc
Printer-friendly Version
Interactive Discussion
EGU
Fig. 1. Location map of the three sites used in this study and their relative position in the UK
HESSD
4, 2403–2423, 2007 δ18O and δ2H variability in UK rainfall M. D. Jones et al. Title Page Abstract Introduction Conclusions References Tables Figures ◭ ◮ ◭ ◮ Back CloseFull Screen / Esc
Printer-friendly Version Interactive Discussion EGU -20 -15 -10 -5 0 +5 Sutton Bonington -15 -10 -5 0 Watnall -20 -15 -10 -5 0 +5 0 200 400 600 Time (days) Keyworth 18 dO 18 dO 18 dO 2004 2005 2006
Fig. 2. Time series of δ18Opfrom the three sites. The thick horizontal line marks the weighted average δ18Opfor each site.
HESSD
4, 2403–2423, 2007 δ18O and δ2H variability in UK rainfall M. D. Jones et al. Title Page Abstract Introduction Conclusions References Tables Figures ◭ ◮ ◭ ◮ Back CloseFull Screen / Esc
Printer-friendly Version Interactive Discussion EGU Keyworth y = 7.42x + 3.67 -140 -100 -60 -20 20 Sutton Bonington y = 7.53x + 4.76 -140 -100 -60 -20 20 Watnall y = 7.27x + 2.96 -140 -100 -60 -20 20 -20 -10 0 +10 18 dO 2 dH 2 dH 2 dH
HESSD
4, 2403–2423, 2007 δ18O and δ2H variability in UK rainfall M. D. Jones et al. Title Page Abstract Introduction Conclusions References Tables Figures ◭ ◮ ◭ ◮ Back CloseFull Screen / Esc
Printer-friendly Version Interactive Discussion EGU N E S W
HESSD
4, 2403–2423, 2007 δ18O and δ2H variability in UK rainfall M. D. Jones et al. Title Page Abstract Introduction Conclusions References Tables Figures ◭ ◮ ◭ ◮ Back CloseFull Screen / Esc
Printer-friendly Version Interactive Discussion EGU y = 0.18x - 7.29 R2 = 0.093 -20 -15 -10 -5 0 +5 d 1 8 O (‰ ) -14 -12 -10 -8 -6 -4 -2 0 0 5 10 15 20 25 y = -0.14x - 4.44 R2= 0.1055 0 10 20 30 40 50 y = -0.0042x - 6.29 R2 = 0.0021 0 20 40 60 80 100 Temperature ( C)o Precipitation (mm) a) b) c) d) d 1 8 O (‰ ) y=0.25x-9.15 R =0.38512
Fig. 5. Differences in the relationship between δ18Opand temperature and precipitation amount for individual sample data (a and b) and mean monthly values (c and d) at Sutton Bonington.
HESSD
4, 2403–2423, 2007 δ18O and δ2H variability in UK rainfall M. D. Jones et al. Title Page Abstract Introduction Conclusions References Tables Figures ◭ ◮ ◭ ◮ Back CloseFull Screen / Esc
Printer-friendly Version Interactive Discussion EGU y = 7.01x + 0.88 y = 7.24x + 6.37 y = 7.22x + 2.41 -120 -100 -80 -60 -40 -20 0 -20 -15 -10 -5 0 1985-1986 1995-1996 2005-2006 2 dH 18 dO
Fig. 6. Differences in the meteoric water lines for 1985–1986 (squares), 1995–1996 (diamonds)