HAL Id: hal-03008677
https://hal.archives-ouvertes.fr/hal-03008677
Submitted on 15 Jan 2021
HAL is a multi-disciplinary open access
archive for the deposit and dissemination of
sci-entific research documents, whether they are
pub-lished or not. The documents may come from
teaching and research institutions in France or
abroad, or from public or private research centers.
L’archive ouverte pluridisciplinaire HAL, est
destinée au dépôt et à la diffusion de documents
scientifiques de niveau recherche, publiés ou non,
émanant des établissements d’enseignement et de
recherche français ou étrangers, des laboratoires
publics ou privés.
night-time with the GRASP algorithm
Oleg Doubovik, Jose Antonio Benavent-Oltra, Roberto Román, Juan Andrés
Casquero-Vera, Daniel Pérez-Ramírez, Hassan Lyamani, Pablo
Ortiz-Amezcua, Andrés Esteban Bedoya-Velásquez, Gregori de Arruda
Moreira, África Barreto, et al.
To cite this version:
Oleg Doubovik, Jose Antonio Benavent-Oltra, Roberto Román, Juan Andrés Casquero-Vera, Daniel
Pérez-Ramírez, et al..
Different strategies to retrieve aerosol properties at night-time with the
GRASP algorithm. Atmospheric Chemistry and Physics, European Geosciences Union, 2019, 19
(22), pp.14149-14171. �10.5194/acp-19-14149-2019�. �hal-03008677�
https://doi.org/10.5194/acp-19-14149-2019 © Author(s) 2019. This work is distributed under the Creative Commons Attribution 4.0 License.
Different strategies to retrieve aerosol properties
at night-time with the GRASP algorithm
Jose Antonio Benavent-Oltra1,2, Roberto Román3, Juan Andrés Casquero-Vera1,2, Daniel Pérez-Ramírez1,2, Hassan Lyamani1,2, Pablo Ortiz-Amezcua1,2, Andrés Esteban Bedoya-Velásquez2,4, Gregori de Arruda Moreira2,5, África Barreto3,6,7, Anton Lopatin8, David Fuertes8, Milagros Herrera9, Benjamin Torres9, Oleg Dubovik9, Juan Luis Guerrero-Rascado1,2, Philippe Goloub9, Francisco Jose Olmo-Reyes1,2, and Lucas Alados-Arboledas1,2
1Department of Applied Physics, Universidad de Granada, 18071, Granada, Spain 2Andalusian Institute for Earth System Research, IISTA-CEAMA, Granada, Spain 3Grupo de Óptica Atmosférica (GOA), Universidad de Valladolid, Valladolid, Spain
4Sciences Faculty, Department of Physics, Universidad Nacional de Colombia, Medellín, Colombia 5Institute of Research and Nuclear Energy (IPEN), São Paulo, Brazil
6Cimel Electronique, Paris, France
7Izaña Atmospheric Research Center, Meteorological State Agency of Spain (AEMET), Izaña, Spain 8GRASP-SAS, Remote Sensing Developments, Université de Lille, 59655, Villeneuve D’ASCQ, France
9Laboratoire d’Optique Atmosphérique (LOA), UMR8518 CNRS, Université de Lille, 59655 Villeneuve D’ASCQ, France
Correspondence: Jose Antonio Benavent-Oltra ([email protected]) Received: 28 July 2019 – Discussion started: 5 September 2019
Revised: 4 November 2019 – Accepted: 6 November 2019 – Published: 22 November 2019
Abstract. This study evaluates the potential of the GRASP algorithm (Generalized Retrieval of Aerosol and Surface Properties) to retrieve continuous day-to-night aerosol prop-erties, both column-integrated and vertically resolved. The study is focused on the evaluation of GRASP retrievals during an intense Saharan dust event that occurred dur-ing the Sierra Nevada Lidar aerOsol Profildur-ing Experiment I (SLOPE I) field campaign. For daytime aerosol retrievals, we combined the measurements of the ground-based li-dar from EARLINET (European Aerosol Research Lili-dar Network) station and sun–sky photometer from AERONET (Aerosol Robotic Network), both instruments co-located in Granada (Spain). However, for night-time retrievals three different combinations of active and passive remote-sensing measurements are proposed. The first scheme (N0) uses
li-dar night-time measurements in combination with the inter-polation of sun–sky daytime measurements. The other two schemes combine lidar time measurements with night-time aerosol optical depth obtained by lunar photometry ei-ther using intensive properties of the aerosol retrieved during sun–sky daytime measurements (N1) or using the Moon
au-reole radiance obtained by sky camera images (N2).
Evaluations of the columnar aerosol properties retrieved by GRASP are done versus standard AERONET retrievals. The coherence of day-to-night evolutions of the different aerosol properties retrieved by GRASP is also studied. The extinction coefficient vertical profiles retrieved by GRASP are compared with the profiles calculated by the Raman technique at night-time with differences below 30 % for all schemes at 355, 532 and 1064 nm. Finally, the volume con-centration and scattering coefficient retrieved by GRASP at 2500 m a.s.l. are evaluated by in situ measurements at this height at Sierra Nevada Station. The differences between GRASP and in situ measurements are similar for the differ-ent schemes, with differences below 30 % for both volume concentration and scattering coefficient. In general, for the scattering coefficient, the GRASP N0and N1show better
re-sults than the GRASP N2 schemes, while for volume
con-centration, GRASP N2shows the lowest differences against
in situ measurements (around 10 %) for high aerosol optical depth values.
1 Introduction
Knowledge of the atmospheric aerosol optical and micro-physical properties is important due to their different effects on the Earth–atmosphere radiative budget (IPCC, 2013). The aerosol particles can scatter and absorb solar and ter-restrial radiation. The Earth–atmosphere radiative forcing sign (warming or cooling) is sensitive to aerosol optical and microphysical properties and their vertical distribution (e.g. Boucher et al., 2013). In addition, aerosol particles can act as cloud condensation and ice nuclei and, thus, can mod-ify the development, microphysical properties and lifetime of clouds (e.g. Andreae et al., 2004; Boucher et al., 2013). Recent developments in remote sensing have allowed ad-vancing the understanding aerosol globally, but the charac-teristics of each system do not allow a complete day-to-night characterization, especially in aerosol microphysical proper-ties (e.g. Pérez-Ramírez et al., 2012). Understanding day-to-night aerosol properties from remote-sensing measurements is essential to advances in aerosol dynamics and changes, which eventually will serve to advance our knowledge on aerosol impact on air-quality and climate. Therefore, current efforts are in integrating different measurements that require advancing in the development of retrieval techniques.
During the last 2 decades, global and regional networks have been established to get a comprehensive, quantitative and statistically significant database of atmospheric aerosols. The Aerosol Robotic Network (AERONET; Holben et al., 1998) and East Asian SKYNET (Nakajima et al., 2007) use sun–sky photometers to provide aerosol column-integrated properties with high temporal resolution. These networks use retrieval techniques that allow the characterization of aerosol microphysical properties (e.g. Nakajima et al., 1996; Dubovik and King, 2000). These networks were focused on daytime measurements, but nowadays they are trying to add night-time aerosol measurements derived from lunar pho-tometry. The developments in moon (Berkoff et al., 2011; Barreto et al., 2013, 2016) and star photometry (e.g. Pérez-Ramírez et al., 2011, 2012; Baibakov et al., 2015) allow the acquisition of night-time measurements; however, these mea-surements are limited in the inversion algorithms to retrieve the aerosol microphysical properties (Pérez-Ramírez et al., 2015; Torres et al., 2017).
Lidar networks such as EARLINET (European Aerosol Research LIdar NETwork; Pappalardo et al., 2014), LA-LINET (Latin American LIdar NETwork; Guerrero-Rascado et al., 2016; Antuña-Marrero et al., 2017) and MPLNET (Micro-Pulse Lidar Network) (Welton et al., 2002) pro-vide information about aerosol vertical distribution. How-ever, many of the lidar systems operating in these networks are basic lidar systems which only have information on the backscatter elastic signals and only allow the retrieval of the vertical profiles of the aerosol backscatter coefficient (β) by the Klett–Fernald method (Fernald et al., 1972; Fernald, 1984; Klett, 1981, 1985) and of the corresponding aerosol
extinction (α) coefficient by assuming a constant aerosol extinction-to-backscattering ratio, which is called the lidar ratio (LR). On the other hand, more advanced lidar systems implement the Raman (e.g. Ansmann et al., 1992; Whiteman et al., 1992) technique for independent retrievals of aerosol backscatter and extinction measurements. These multiwave-length lidar measurements allow the use of different inver-sion algorithms based on the regularization technique to re-trieve vertical profiles of aerosol microphysical properties us-ing a 3β + 2α configuration, that is, multiwavelength lidar measurements of three backscatter and two extinction coeffi-cients (e.g. Müller et al., 1999; Böckmann, 2001; Veselovskii et al., 2002). Nevertheless, the amount of advanced lidar sys-tems is considerably lower when compared with basic li-dar systems; therefore, the independent α and β measure-ments are sparse and mostly limited to night-time. In this context there are a lot of passive and active remote-sensing measurements that alone do not provide enough informa-tion to retrieve advanced aerosol microphysical properties. However, integrating all these measurements in an appro-priate inversion scheme allows such retrievals and can even complete the number of unknown aerosol optical proper-ties. Such integration is critical for retrieving vertical pro-files where the information content for the retrievals is con-siderably low when compared with classical sun photometer inversion (e.g. Veselovskii et al., 2005). In the framework of EARLINET, different inversion algorithms were devel-oped, such as the LIdar-Radiometer Inversion Code (LIRIC; Chaikovsky et al., 2008, 2016), which uses AERONET re-trievals and backscatter elastic signals as input, and the Gen-eralized Aerosol Retrieval from Radiometer and Lidar Com-bined (GARRLiC; Lopatin et al., 2013) code, which uses sun–sky radiance and backscatter lidar measurements as in-puts that make the inversion more consistent (Lopatin et al., 2013).
Of these algorithms, in this study, we use the recently de-veloped Generalized Retrieval of Aerosol and Surface Prop-erties algorithm (GRASP; Dubovik et al., 2011, 2014), which includes the GARRLiC code. GRASP is a versatile and open-source algorithm (https://www.grasp-open.com/, last access: 1 July 2019) based in the concept of the Dubovik and King (2000) algorithm which has been used successfully by AERONET during the last decades. The GRASP algo-rithm is divided into two main independent modules: the forward model and numerical inversion modules. The for-ward model is based on radiative transfer and aerosol mod-els, and it is a convenient tool for sensitivity and tuning stud-ies (Dubovik et al., 2014; Torres et al., 2017). The numeri-cal inversion module is the main part of the core program, which includes general mathematical operations based on the multi-term least square method (LSM) concept (Dubovik and King, 2000; Dubovik, 2004). The GRASP versatility allows the retrieval of aerosol properties through the com-bination of measurements from different instruments both column-integrated and vertically resolved. In fact, GRASP
was successfully utilized for the retrieval of the aerosol prop-erties using different configurations and measurements, such as polar nephelometer data (Espinosa et al., 2017), satellite remote-sensing data (Kokhanovsky et al., 2015; Dubovik et al., 2019), aerosol optical depth (AOD) and sky radiances (in-cluding polarization) (Fedarenka et al., 2016), spectral AOD and sky camera images (Román et al., 2017a), only spectral AOD (Torres et al., 2017), and the combination of aerosol optical depth (AOD), sky radiances and elastic lidar (Lopatin et al., 2013; Benavent-Oltra et., 2017) or ceilometer profiles (Román et al., 2018). The aerosol properties retrieved by GRASP aerosol profiles have been used as input to radiative transfer models (Granados-Muñoz et al., 2019), to evaluate dust forecast models (Tsekeri et al., 2017) or to be assimi-lated in global models (Chen et al., 2018).
In this framework, the main objective of this paper is to propose and explore different and novel strategies for the re-trieval of vertically resolved aerosol properties at night-time using the GRASP algorithm combining remote-sensing mea-surements as input data. Another goal is to quantify the ac-curacy of the retrieved night-time aerosol properties obtained by these strategies, classified into three schemes and using as reference independent aerosol measurements and products. To that end, the recent developments on lunar photometry, which allows us to derive the night-time AOD from a lunar photometer (Barreto et al., 2013, 2016) and the new studies with sky camera images, which allow us to obtain the nor-malized sky radiance from the lunar aureole (Román et al., 2017a), open the possibility to explore the use of the GRASP algorithm combining these night-time measurements with elastic lidar data to study night-time microphysical and opti-cal aerosol properties.
The paper structure is as follows. Sects. 2 and 3 give a brief description of the experimental site, instrumentation used and the dust event that occurred during the Sierra Nevada Lidar aerOsol Profiling Experiment I (SLOPE I) campaign. The different schemes used in GRASP to retrieve the aerosol properties both during the day and at night-time are described in Sect. 4. In Sect. 5, the assessment of the aerosol column-integrated and vertically resolved properties retrieved by GRASP is discussed both during the day and at night-time. Finally, the conclusions are given in Sect. 6.
2 Experimental site and instrumentation
2.1 Andalusian Global ObseRvatory of the Atmosphere
The paper is mainly focused on the city of Granada (Spain). Granada is located in the Western Mediterranean basin and it is frequently affected by long-range transport of Saharan dust (Lyamani et al., 2005; Fernández et al., 2019; Soupiona et al., 2019) and biomass burning, both from near sources (Alados-Arboledas et al., 2011) and those at large distances
(e.g. Ortiz-Amezcua et al., 2017; Sicard et al., 2019). The main local sources of anthropogenic aerosols are road traffic and heating systems during the winter season (Lyamani et al., 2010). Under strong anticyclone conditions, the orographic situation with the city situated in a basin surrounded by mountains makes ventilation processes difficult and favours aerosol stagnation (Patrón et al., 2017).
The experimental measurements used in this study were collected in the AGORA (Andalusian Global ObseRvatory of the Atmosphere) in Granada. AGORA deployed instru-mentation at three different stations at different altitudes. The principal station (UGR) is located in the Andalusian Institute for Earth System Research/IISTA-CEAMA in Granada city, where active and passive remote-sensing instrumentation op-erated. The other two stations are in the Sierra Nevada: Cerro Poyos Station (37.11◦N, 3.49◦W; 1820 m a.s.l.) and Sierra Nevada Station (SNS; 37.10◦N, 3.39◦W; 2500 m a.s.l.). In
this study, we used the in situ measurements from SNS, which is located about 25 km away (horizontally) from UGR. The measurements of SNS can allow the characterization of regional and long-range transport episodes and the vali-dation of inversion algorithms used to retrieve aerosol opti-cal and microphysiopti-cal properties. The altitude difference be-tween UGR and SNS (∼ 1.8 km) and the short horizontal dis-tance make the correlative measurements between both sites ideal in our objective of evaluating different GRASP scheme retrievals.
The measurements used in this work were acquired in the framework of the SLOPE I campaign. SLOPE I took place at AGORA from May to September 2016 with the objective validating the vertically resolved aerosol properties retrieved from the combination of active and passive remote-sensing measurements by in situ measurements on the surrounding high mountain area. In this regard, several studies have been done using SLOPE I database: day-to-night evolution of the planetary boundary layer (de Arruda Moreira et al., 2018) and its turbulence behaviour (de Arruda Moreira et al., 2019), aerosol hygroscopic growth (Bedoya-Velásquez et al., 2018), evaluation of the aerosol properties during the daytime re-trieved by GRASP combining a ceilometer and sun–sky pho-tometer measurements (Román et al., 2018), and the charac-terization of the angular scattering of the Sahara dust aerosol by means of polar nephelometry (Horvath et al., 2018). Thus, SLOPE I is ideal for our purposes of studying day-to-night aerosol microphysical properties retrievals.
2.2 Remote-sensing measurements
The measurements of the remote-sensing instrumentation of UGR are used as input data in the different GRASP schemes (see Sect. 4). One of these instruments is a multiwavelength Raman lidar (LR331D400, Raymetrics S.A.), which has been included in EARLINET since 2005 and contributes to the ACTRIS (Aerosols, Clouds, and Trace gases Research In-fraStructure Network) research infrastructure. It is composed
of a pulsed Nd:YAG laser that emits at 1064 nm (110 mJ per pulse), 532 nm (65 mJ per pulse) and 355 nm (60 mJ per pulse) by means of the second and third harmonic genera-tors. The receiving system has seven channels: three to mea-sure the backscatter signal at emission wavelengths plus one additional channel to measure the cross-polarized signal at 532 nm, two channels at 387 and 607 nm for the detection of Raman scattering from N2, and an additional channel to
de-tect the Raman scattering from water vapour at 408 nm. Due to incomplete overlap, atmospheric information up to 500 m above the system is limited (Navas-Guzmán et al., 2011). A detailed description of this multiwavelength Raman lidar sys-tem may be found in Guerrero-Rascado et al. (2008, 2009).
Co-located with the lidar system, a sun–sky–lunar pho-tometer Cimel CE318-T (Cimel Electronique), included in the AERONET network, has been making daytime and night-time measurements since March 2016. This photometer is equipped with a filter wheel (nine narrow filters) covering the spectral range between 340 and 1640 nm. During the day-time, the sun–sky–lunar photometer performs measurements of sky radiance but also direct solar irradiance, which is used to derive the AOD; both kinds of measurements can be used to retrieve detailed aerosol properties such as the particle size distribution, complex refractive index (CRI) and single-scattering albedo (SSA) (Nakajima et al., 1996; Dubovik et al., 2006). This photometer is annually calibrated follow-ing the AERONET methodology by ACTRIS/AERONET-Europe, the European branch of AERONET. Furthermore, this photometer has the capacity to measure the solar radi-ation reflected by the Moon during the night-time, provid-ing valuable information on atmospheric aerosols through-out the whole day. Therefore, the sun–sky–lunar photometer provides the AOD at night-time between the first and third Moon quarters (Barreto et al., 2013, 2019). The calibration of the CE318-T for AOD calculation at night-time has been done by the lunar-Langley calibration method explained by Barreto et al. (2019). More details of the sun–sky–lunar pho-tometer Cimel CE318-T and its operational functionalities are described by Barreto et al. (2016).
Furthermore, we used a sky camera SONA (Sistema de Observación de Nubosidad Automático – Automatic Cloud Observation System), which provides hemispherical sky im-ages during the day and at night (González et al., 2012). This system is composed of a CCD (charge-coupled device) cam-era with a fisheye lens providing RGB images, the effective wavelengths of which correspond to 469, 533 and 608 nm (Román et al., 2017a) for night scenarios. It was configured to take multi-exposure sequences of sky images. These se-quences are used to obtain a high dynamic range (HDR) im-age (one every 5 min) which allows us, after some correc-tion processes, to obtain the normalized radiances at lunar almucantar points (up to 20◦ in azimuth from the Moon) at the three effective wavelengths as shown by Román et al. (2017a). Sky cameras usually present a low signal-to-noise ratio. Thus, to calculate the Moon radiances from sky
camera images, we need cases with high values of AOD (to enhance the scattered Moon signal in the aureole) and high Moon extraterrestrial irradiance, which restrict data avail-ability to the period between the first and last Moon quarters (Román et al., 2017a). In addition, in this work we applied a threshold to use the Moon radiance calculated from sky cam-era images: (1) the Moon zenith angle must be lower than 70◦; (2) a minimum of 18 sky radiances with azimuth angles between 3 and 20◦must be available for each effective wave-length of the sky camera. A detailed explanation of the con-figuration, corrections and products obtained by this camera is presented in Román et al. (2017a, b).
2.3 In situ measurements
The in situ measurements collected at SNS are used to assess the aerosol properties, such as scattering coefficient (σsca)
and volume concentration (VC) retrieved by the GRASP algorithm. The integrating nephelometer (model TSI 3563) measures the particle light scattering coefficients at three wavelengths (450, 550 and 700 nm) with 5 min temporal res-olution. A quartz-halogen lamp equipped with a built-in el-liptical reflector illuminates over an angle of 7 to 170◦the air sample (particle + gas) extracted by a small turbine blower at a constant flow of 30 L min−1. The nephelometer mea-surements underestimate the scattering and backscattering coefficients due to the limits of the angular integration of the scattered light since a part of forward (0–7◦) and back-ward (170–180◦) signals are not measured. Nephelometer data have been corrected for truncation and non-Lambertian illumination errors using the method described by Anderson and Ogren (1998).
The scanning mobility particle sizer (SMPS) composed of an electrostatic classifier (TSI Mod. 3080) and a condensa-tion particle counter (CPC; TSI Mod. 3772) measures the sub-micron particle number size distribution within the 12– 615 nm particle mobility diameter range with 5 min tempo-ral resolution. Aerosol and sheath flow rates were 1.0 and 5.0 L min−1, respectively. SMPS data have been corrected for internal diffusion losses and multiple charges with the AIM software (version 9.0.0, TSI, Inc., St Paul MN, USA). Fol-lowing calibration procedures, uncertainty in the measured particle size distribution is within 10 % and 20 % for the size range of 20–200 and 200-800 nm, respectively (Wieden-sohler et al., 2012). In addition, the coarse particle number size distribution within the 0.5–20 µm aerodynamic diameter range was measured by an aerodynamic particle sizer (APS; TSI Mod. APS-3321). The APS measures number aerosol concentrations up to 1000 particles per centimetre with coin-cidence errors inferior to 5 % and 10 % at 0.5 and 10 µm di-ameters. From these measurements, aerosol volume concen-trations were obtained in the 0.05–10 µm radius range with the 5 min time resolution. For that, a Q value = 1 has been assumed for conversion from aerodynamic to mobility size distribution (Sorribas et al., 2015).
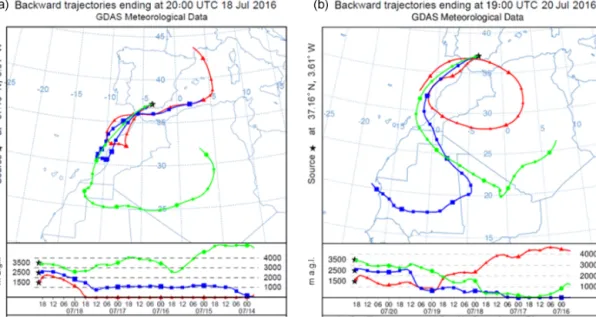
Figure 1. Five-day backward trajectories computed using HYSPLIT reaching Granada at 20:00 UTC on 18 July (a) and at 19:00 UTC on 20 July 2016 (b).
3 Dust event during SLOPE I campaign
This work focuses on an intense dust event that reached the south-east of the Iberian Peninsula during the SLOPE I field campaign from 18 to 21 July 2016. The analysis of 5 d backward trajectories (Fig. 1) computed by the HYSPLIT model (Hybrid Single-Particle Lagrangian Integrated Trajec-tory; Stein et al., 2015; Rolph, 2016) indicate that the air masses that arrived at Granada came from a south-western direction on 18 and 21 July 2016. These air masses from the Sahara area passed along south Morocco and the Moroccan coast before reaching Granada. As shown hereafter, these Sa-haran air masses transported large amounts of SaSa-haran dust particles to the study area.
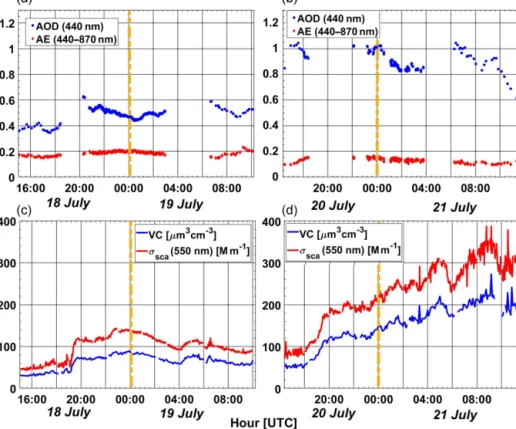
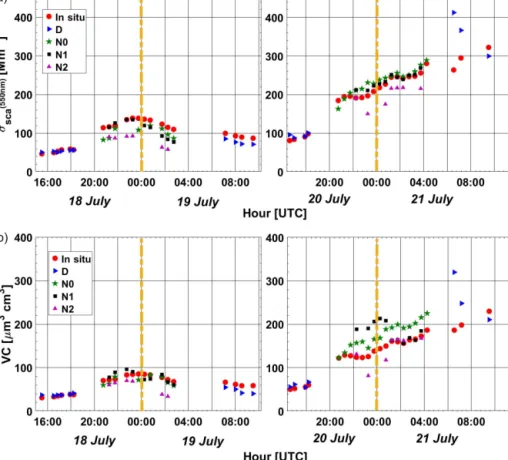
Figure 2a and b show the day and night-time AOD at 440 nm (AOD440) and the Ångström exponent (AE),
com-puted with AOD at 440 and 870 nm (AE440−870), at UGR
provided by AERONET. This figure reveals two different pe-riods throughout the dust event with different AOD440
val-ues: the first period from 18 to 19 July (hereinafter the P1
pe-riod) with a mean value of 0.50±0.03 and the second period from 20 to 21 July (hereinafter the P2 period) with a mean
value (± standard deviation) of 0.94 ± 0.08. These AOD440
values obtained in P1and P2periods are 2 and 4 times higher
than the AOD440 mean value reported by Pérez-Ramírez et
al. (2016) for desert dust intrusions over Granada, which make this Saharan dust event extraordinary. However, the AE440−870values show a smooth behaviour with no
signifi-cant variations around the mean value of 0.17 ± 0.03, which is typical of Saharan dust intrusions over the Granada region (e.g. Lyamani et al., 2006; Guerrero-Rascado et al., 2008, 2009; Pérez-Ramírez et al., 2016).
Figure 2c and d show the day-to-night temporal evolu-tion of σsca at 550 nm and the total VC obtained from in
situ instrumentation throughout the dust event at the high mountain SNS, respectively. Clearly, both VC and σscashow
a continuous increase from the minimum on 18 July (∼ 50 Mm−1for σsca; ∼ 40 µm3cm−3for VC) to the maximum
values reached early in the morning of 21 July (∼ 350 Mm−1 for σsca; ∼ 250 µm3cm−3 for VC). This large increase on
these two extensive aerosol properties, especially on 20– 21 July, is associated with the transport of Saharan dust par-ticles and shows the drastic impact of this Saharan dust event on the aerosol load at the remote SNS.
Figure 3 shows the temporal evolution of the range-corrected signal (RCS) at 532 nm from the lidar system at UGR; it points out detailed layer evolution during this Saha-ran dust event. The dashed horizontal purple line shows the height of the SNS mountain station. This figure reveals im-portant variability in the layer structures of the atmosphere. On 18 July, in the evening, two different and decoupled aerosol layers are observed: one at 4 km a.s.l. and the other one near the surface, approximately up to 1.2 km a.s.l. How-ever, during the night of 18–19 July the upper aerosol layer gradually went down until it mixed with the surface aerosol layer, causing any clear vertical layering to fade away. On the following day, particularly after 08:00 UTC, two differ-ent aerosol layers are observed again. From the afternoon on 19 July to noon on 20 July, clouds were present over the site, and hence the RCS data obtained during this period are excluded from further analysis. After restarting lidar mea-surements, on 20 July a decoupled aerosol layer at approx-imately 4 km a.s.l. is observed again; this layer also gradu-ally went down until it mixed with the boundary layer early
Figure 2. Day-to-night evolution of the AOD at 440 nm (blue) and AE (440–870 nm) (red) obtained at UGR from 18 to 19 July 2016 (a) and from 20 to 21 July 2016 (b). Day-to-night temporal evolution of the total volume concentration (VC) and the scattering coefficient (σsca) at
550 nm measured at SNS from 18 to 19 (c) and from 20 to 21 (d) July 2016.
Figure 3. Temporal evolution of the lidar range-corrected signal at 532 nm from 18 to 19 (a) and from 20 to 21 (b) July 2016. The purple horizontal line indicates the SNS altitude.
at night. But the most remarkable observation in this period is the very different structure observed after 04:00 UTC on 21 July when two decoupled layers at ∼ 2–3 km a.s.l. alti-tude appeared. Later, in the morning of 21 July, the upper layer collapsed and mixed with the surface layer.
The multi-layer aerosol evolution revealed in Fig. 3 agrees with that observed before in AOD440 and AE440−870
val-ues and with in situ measurements at SNS. Actually, the in-crease in the intensity of RCS on 20 July agrees with the increase in AOD. Moreover, the increase in RCS at the al-titude of 2500 m a.s.l. coincides with the increase in σsca
and VC measured in situ at SNS. The collapse of the layer at 2500 m a.s.l. after 08:00 UTC on 21 July also agrees with the decrease in σscaand VC at SNS.
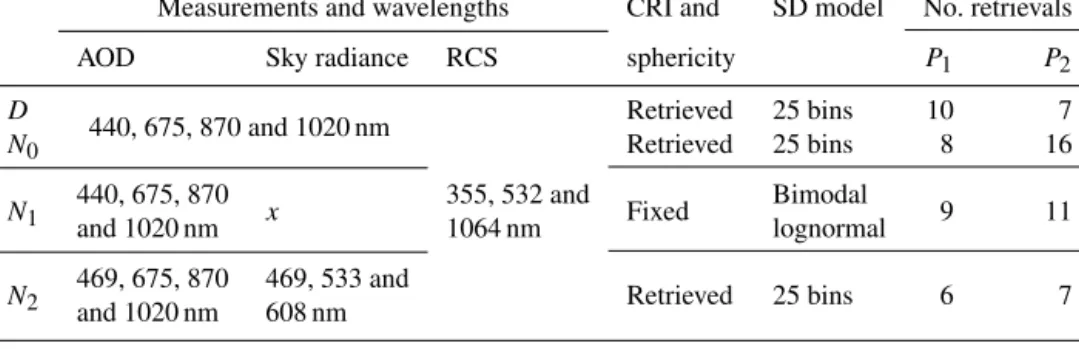
Table 1. Data set used as input in the GRASP algorithm for day and night-time retrievals. The aerosol size distribution used in each scheme and the number of the converging retrievals obtained during the first (P1) and second (P2) periods.
Measurements and wavelengths CRI and SD model No. retrievals AOD Sky radiance RCS sphericity P1 P2
D
440, 675, 870 and 1020 nm Retrieved 25 bins 10 7
N0 Retrieved 25 bins 8 16
N1
440, 675, 870
x 355, 532 and Fixed Bimodal 9 11 and 1020 nm 1064 nm lognormal
N2 469, 675, 870and 1020 nm 469, 533 and608 nm Retrieved 25 bins 6 7
Given coherence among all measurements, we can affirm that the Saharan dust affected a wide area, and measurements in UGR and SNS are both representative of such event. Thus, the conditions of this dust event allow the evaluation of ver-tical and columnar aerosol opver-tical and microphysical proper-ties retrieved by the GRASP algorithm both during the day and at night-time.
4 GRASP retrieval schemes
In this section, we present in four schemes the different strategies used in the GRASP algorithm for retrieving con-tinuous day and night-time atmospheric aerosol properties in both column-integrated and vertical profiles. For daytime retrievals (denoted as D), the scheme used in GRASP is that proposed by Lopatin et al. (2013), which used both li-dar and sun–sky photometer measurements as input data. On the other hand, we have proposed three different schemes to retrieve the aerosol properties during the night-time; each scheme can be used depending on the available instrumenta-tion and the condiinstrumenta-tions of the event.
The lidar data use in each retrieval (both for day and night-time retrieval) corresponds to preprocessed 30 min averages of the raw signals for each wavelength. This preprocessing includes background noise subtraction and altitude tion, but other corrections are also applied as overlap correc-tion, analog and photon-counting signal gluing, and depolar-ization correction. To reduce the number of retrieved param-eters and to remove the noise in lidar signals at higher alti-tudes, a logarithmical altitude or range scale with 60 points between minimum and maximum altitudes is used as in Lopatin et al. (2013). More details of lidar data preprocess-ing are described in Lopatin et al. (2013). In addition to the lidar signal measurements, each scheme uses different input data from different instrumentation, and hence the retrieval strategies and configurations differ between schemes. These configurations are summarized in Table 1 and described in the following subsections.
4.1 Daytime scheme
As commented, for scheme D the set of measurements used as input in GRASP are those recommended by Lopatin et al. (2013): the normalized lidar RCS at 355, 532 and 1064 nm and AERONET sun–sky radiances measurements at 440, 675, 870 and 1020 nm. Both daytime AOD and sky radi-ances used in this work are Version 2 Level 2.0 provided by AERONET from the Cimel CE318-T photometer.
4.2 Night-time schemes
4.2.1 N0
The first night-time scheme (N0 scheme) used in GRASP
assumes that there is no change in the aerosol column-integrated extensive and intensive properties throughout the night. As AOD and sky radiance measurements during the night-time are still very scarce, this scheme combines the night-time elastic lidar measurements with the closest sun– sky measurements registered the day before or the day after. Thus, the N0scheme uses the night-time RCS measured by
lidar at 355, 532 and 1064 nm combined with the closest day-time measurements of AOD and sky radiances at 440, 675, 870 and 1020 nm. This scheme offers the possibility to re-trieve aerosol vertical properties in stations where night-time photometer measurements are not available, but it should only be applied when the aerosol load and type is similar throughout the night-time.
4.2.2 N1
Currently, night-time AOD measurements, taken with the re-cently developed sun–sky–lunar photometer CE318-T, are available in some stations. The GRASP scheme based on AOD measurements alone was applied by Torres et al. (2017), showing the ability of GRASP to retrieve total-column aerosol properties at night-time using this configura-tion. The present work attempts to go further and provide ver-tically resolved aerosol properties at night-time by
combin-ing elastic lidar and the night-time AOD at 440, 675, 870 and 1020 nm from lunar photometry measurements.
The second night-time scheme (N1scheme) approach
con-siders that the aerosol load in the vertical column can be monitored by lunar photometry and hence changes in exten-sive properties can be detected, but it assumes that there are no changes in the aerosol column-integrated intensive prop-erties; therefore, this approach considers that there are no changes in the aerosol type. The N1scheme proposed in this
work combines elastic lidar at 355, 532 and 1604 nm and the night-time AOD at 440, 675, 870 and 1020 nm. As in Torres et al. (2017), the CRI and the spherical particle fraction are assumed to be known and the values used are the averaged GRASP values retrieved during the closest (after or before) daytime retrievals. It should be noted that the N1 scheme
fixes intensive properties, but this scheme is not exactly the same procedure used in the LIRIC algorithm that uses the li-dar data and column-integrated aerosol properties provided by AERONET as input. AOD at other available wavelengths have not been taken into account in order to choose only the wavelengths used in the scheme D (which is used to extract CRI information at these wavelengths); in addition night-time AOD values in the UV range are not used due to the low signal in this spectral range at night (Barreto et al., 2019).
4.2.3 N2
The third and last night-time scheme (N2 scheme) avoids
any assumption of the previous schemes, assuming that in-tensive and exin-tensive (as the N0scheme) aerosol properties
do not change between day and night or using a fixed CRI and spherical particle fraction (as the N1scheme). As input
data, the N2scheme uses the elastic lidar, lunar aureole
nor-malized sky radiances at 469, 533 and 608 nm derived by the SONA sky camera, and the night-time AOD at 440 (which is interpolated to 469 nm by the Ångström exponent law using 440 and 675 nm), 675, 870 and 1020 nm. This scheme needs the elastic lidar, lunar photometer and sky camera measure-ments, but it has the advantage that it is not dependent on daytime measurements and can retrieve extensive and inten-sive aerosol properties and hence is useful to detect changes in aerosol load or type throughout the night.
5 Results
5.1 Columnar aerosol properties
For studying the coherence of daytime columnar-integrated aerosol properties retrieved by GRASP (using the Dscheme), such retrievals are compared with those provided by the AERONET operational algorithm. Generally, the re-trievals of Level 2.0 from AERONET Version 2 are used for this comparison, but for specific cases (i.e. AOD440<0.4)
the SSA and CRI values of Level 1.5 are used instead (Holben et al., 2006). For evaluating columnar aerosol
properties retrieved by GRASP at night-time, we evaluate the smoothness and temporal coherence of the variation in the aerosol retrievals throughout the night, having as benchmarks the daytime retrievals of both AERONET and the GRASP D scheme.
The P1and P2periods present a situation with an
appar-ent smooth variation in the aerosol load but with the rem-nants of some intensive properties, identifying the type of aerosol, throughout the whole period studied (see Fig. 2). In this sense, the selected cases offer an appropriate situation for testing the proposed schemes for night-time aerosol re-trievals, having in mind the smoothness of the aerosol evolu-tion in spite of the ample change in the aerosol load. Here-after, evaluations of aerosol parameters retrieved by GRASP using a different input data set (different schemes) are pre-sented.
5.2 Columnar particle size distribution parameters
The columnar particle size distribution can be approximated as bimodal log-normals instead of binned size distributions. The bimodal log-normals can be described using six param-eters: volume concentration (VCi, µm3µm−2), volume
me-dian radius (rvi, µm) and standard deviation (σvi) for the
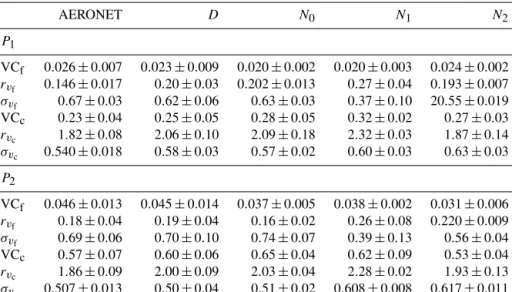
fine and coarse mode. Table 2 shows the average values (± standard deviation), for all available retrievals, of the size distribution parameters retrieved by GRASP using different configuration schemes and those provided by AERONET. Figure 4 shows the aerosol size distributions calculated from the parameters given in Table 2. Due to the drastic change in aerosol load (as indicated by AOD) between P1and P2
pe-riods, the results of GRASP and AERONET retrievals are provided separately for these two periods.
The aerosol size distribution parameters obtained using scheme D are consistent with AERONET products, with mean relative differences between GRASP and AERONET of around 8 % (26 %), 12 % (35 %) and 8 % (10 %) for VCc
(VCf) and rvc (rvf) and σvc (σvf) with the agreement being
better for the coarse mode. In general, the coarse-mode pa-rameters obtained during the Saharan dust event analysed here are the typical values obtained at Granada during dust events originating from the western Sahara (Valenzuela et al., 2012). It is noted that the coarse-modal radius retrieved by the GRASP D scheme is slightly larger than that provided by AERONET during both periods. This shift towards larger radii for GRASP retrievals was also observed by Lopatin et al. (2013) during dust and biomass burning events over Minsk (Belarus) and by Bovchaliuk et al. (2016) during dust events over Dakar (Senegal), and it is attributed to the use of additional lidar data.
Columnar aerosol size distribution parameters at night-time retrieved by GRASP using different schemes (see Ta-ble 2) show a good coherence and smooth variation when they are compared to daytime AERONET and GRASP re-trievals (scheme D). In fact, the GRASP night-time rere-trievals
Figure 4. The aerosol size distribution calculated from the averaged aerosol size distribution parameters obtained from AERONET and GRASP retrievals both during the day and at night-time for the first period (a) and the second period (b) of dust event.
Table 2. The average values (± standard deviations) of volume concentration (VCf, VCcas µm3µm−2), volume modal radius (rvf, rvc as
µm) and standard deviation (σvf and σvc)for fine and coarse modes retrieved by GRASP using different configuration schemes and those
provided by AERONET. The retrievals are provided for the first period (P1) and the second period (P2). The subscript “f” denotes the fine
mode and “c” denotes the coarse mode.
AERONET D N0 N1 N2 P1 VCf 0.026 ± 0.007 0.023 ± 0.009 0.020 ± 0.002 0.020 ± 0.003 0.024 ± 0.002 rvf 0.146 ± 0.017 0.20 ± 0.03 0.202 ± 0.013 0.27 ± 0.04 0.193 ± 0.007 σvf 0.67 ± 0.03 0.62 ± 0.06 0.63 ± 0.03 0.37 ± 0.10 20.55 ± 0.019 VCc 0.23 ± 0.04 0.25 ± 0.05 0.28 ± 0.05 0.32 ± 0.02 0.27 ± 0.03 rvc 1.82 ± 0.08 2.06 ± 0.10 2.09 ± 0.18 2.32 ± 0.03 1.87 ± 0.14 σvc 0.540 ± 0.018 0.58 ± 0.03 0.57 ± 0.02 0.60 ± 0.03 0.63 ± 0.03 P2 VCf 0.046 ± 0.013 0.045 ± 0.014 0.037 ± 0.005 0.038 ± 0.002 0.031 ± 0.006 rvf 0.18 ± 0.04 0.19 ± 0.04 0.16 ± 0.02 0.26 ± 0.08 0.220 ± 0.009 σvf 0.69 ± 0.06 0.70 ± 0.10 0.74 ± 0.07 0.39 ± 0.13 0.56 ± 0.04 VCc 0.57 ± 0.07 0.60 ± 0.06 0.65 ± 0.04 0.62 ± 0.09 0.53 ± 0.04 rvc 1.86 ± 0.09 2.00 ± 0.09 2.03 ± 0.04 2.28 ± 0.02 1.93 ± 0.13 σvc 0.507 ± 0.013 0.50 ± 0.04 0.51 ± 0.02 0.608 ± 0.008 0.617 ± 0.011
using the N0scheme present average values similar to those
provided by GRASP daytime retrievals, with discrepancies around 10 % for both modes in the two periods analysed. The aerosol size distribution parameters of the coarse mode re-trieved by GRASP using the N1scheme are slightly higher
systematically than those obtained during the daytime (by both the D scheme and AERONET) with differences of around 15 % and 10 % for VCc and rvc, respectively. These
differences are within the uncertainties observed by Torres et al. (2017) in the cases in which the coarse mode is pre-dominant. The use of night-time AOD measurements in the N1scheme, which reveals a change in AOD values (aerosol
load) between day and night, may also be behind these
changes in the aerosol size distribution parameters retrieved by the N1scheme.
Finally, the values of aerosol parameters retrieved by GRASP using the N2scheme are closely similar to the values
retrieved by AERONET the day before and after, especially for the coarse mode where the discrepancies are around 12 %, 3 % and 20 % for VCc, rvc and σvc, respectively, showing the
potential of such retrievals. However, for fine-mode proper-ties (VCf, rvf and σvf) there are considerable differences
be-tween GRASP and AERONET retrievals mainly due to the low concentration of fine particles.
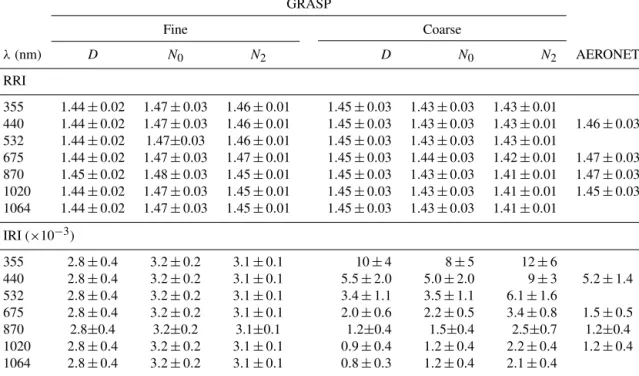
Table 3. The average values (± standard deviation) of the real (RRI) and imaginary (IRI) refractive indices retrieved by GRASP (D, N0 and N2; both fine and coarse modes) and AERONET (for the whole aerosol population) during 18–21 July 2016.
GRASP Fine Coarse λ (nm) D N0 N2 D N0 N2 AERONET RRI 355 1.44 ± 0.02 1.47 ± 0.03 1.46 ± 0.01 1.45 ± 0.03 1.43 ± 0.03 1.43 ± 0.01 440 1.44 ± 0.02 1.47 ± 0.03 1.46 ± 0.01 1.45 ± 0.03 1.43 ± 0.03 1.43 ± 0.01 1.46 ± 0.03 532 1.44 ± 0.02 1.47±0.03 1.46 ± 0.01 1.45 ± 0.03 1.43 ± 0.03 1.43 ± 0.01 675 1.44 ± 0.02 1.47 ± 0.03 1.47 ± 0.01 1.45 ± 0.03 1.44 ± 0.03 1.42 ± 0.01 1.47 ± 0.03 870 1.45 ± 0.02 1.48 ± 0.03 1.45 ± 0.01 1.45 ± 0.03 1.43 ± 0.03 1.41 ± 0.01 1.47 ± 0.03 1020 1.44 ± 0.02 1.47 ± 0.03 1.45 ± 0.01 1.45 ± 0.03 1.43 ± 0.03 1.41 ± 0.01 1.45 ± 0.03 1064 1.44 ± 0.02 1.47 ± 0.03 1.45 ± 0.01 1.45 ± 0.03 1.43 ± 0.03 1.41 ± 0.01 IRI (×10−3) 355 2.8 ± 0.4 3.2 ± 0.2 3.1 ± 0.1 10 ± 4 8 ± 5 12 ± 6 440 2.8 ± 0.4 3.2 ± 0.2 3.1 ± 0.1 5.5 ± 2.0 5.0 ± 2.0 9 ± 3 5.2 ± 1.4 532 2.8 ± 0.4 3.2 ± 0.2 3.1 ± 0.1 3.4 ± 1.1 3.5 ± 1.1 6.1 ± 1.6 675 2.8 ± 0.4 3.2 ± 0.2 3.1 ± 0.1 2.0 ± 0.6 2.2 ± 0.5 3.4 ± 0.8 1.5 ± 0.5 870 2.8±0.4 3.2±0.2 3.1±0.1 1.2±0.4 1.5±0.4 2.5±0.7 1.2±0.4 1020 2.8 ± 0.4 3.2 ± 0.2 3.1 ± 0.1 0.9 ± 0.4 1.2 ± 0.4 2.2 ± 0.4 1.2 ± 0.4 1064 2.8 ± 0.4 3.2 ± 0.2 3.1 ± 0.1 0.8 ± 0.3 1.2 ± 0.4 2.1 ± 0.4
5.2.1 Columnar complex refractive indices
The real (RRI) and imaginary (IRI) refractive indices ob-tained by GRASP and AERONET are not directly compa-rable because the GRASP configurations used here provide the RRI and the IRI separately for fine and coarse modes while AERONET provides only RRI and IRI equivalent val-ues for the whole size distribution. Nevertheless, the RRI and IRI values provided by AERONET are again used to study the consistency of the proposed schemes for GRASP retrievals. In this case, the mean RRI and IRI values (see Table 3) and their corresponding standard deviations corre-spond to the whole period analysed. This is done because, in contrast to VC retrievals that showed a large change between P1and P2periods, the RRI and the IRI retrieved by GRASP
(using different schemes) and AERONET were almost sta-ble and showed a very small variation throughout the whole period analysed, as indicated by the corresponding standard deviations. As can be seen in this table, standard deviations were within and even below the uncertainties associated with the AERONET retrievals, i.e. ±0.03 for the RRI and ±50% for the IRI (Dubovik et al., 2000). On the other hand, it is important to remember that complex refractive index values for the N1scheme are not reported in Table 3 because in this
case the average day values retrieved by GRASP during the daytime were used as input for this GRASP configuration scheme.
RRI values retrieved by both GRASP (using differ-ent schemes) and AERONET show no remarkable
spec-tral dependence, with maximum specspec-tral variations of 0.03, which is below the uncertainties of the AERONET method. The differences between GRASP (D and N0 scheme) and
AERONET are similar to those obtained in previous work such as Benavent-Oltra et al. (2017) and Tsekeri et al. (2017). Also, no notable differences are observed between the re-trieved values (using different GRASP schemes) between the day and night retrievals. Such coherence again shows the po-tential of the GRASP retrieval proposed. Moreover, retrieved RRI values agree with those reported in previous studies: us-ing AERONET data, Dubovik et al. (2002) reported a mean RRI value of 1.48 ± 0.05 for desert dust at Cabo Verde. Also, using the GRASP algorithm, Tsekeri et al. (2017) obtained an RRI value of 1.45 for a desert dust event at Finokalia (Crete, Greece). Nevertheless, the RRI values obtained here are lower than those used for desert dust by several mod-els (RRI = 1.53 for the visible spectral region) (Shettle and Fenn, 1979; WMO, 1983; Koepke et al., 1997). However, the differences between RRI values obtained here for the desert dust event and those reported in the literature can be explained by the differences in the chemical composition of dust (e.g. Patterson et al., 1977; Carlson and Benjamin, 1980; Sokolik et al., 1993; Sokolik and Toon, 1999).
For the IRI, consistency during the whole period analysed is observed again with smooth variations in the retrieved val-ues. For the fine mode, IRI values retrieved by GRASP (using different schemes) show neutral spectral dependence, and the differences between the three schemes (D, N0 and N2) are
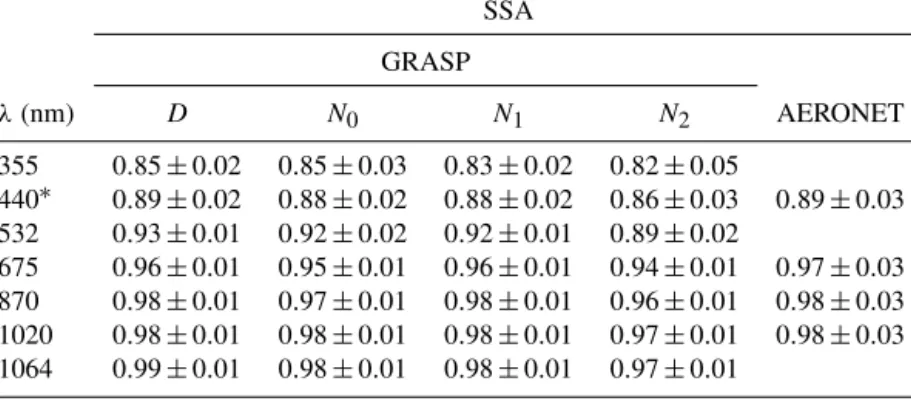
Table 4. The average values (± standard deviation) of single-scattering albedo (SSA) retrieved by GRASP (using D, N0and N2schemes) and AERONET for the period 18–21 July 2016 (∗469 nm for the N2scheme).
SSA GRASP λ (nm) D N0 N1 N2 AERONET 355 0.85 ± 0.02 0.85 ± 0.03 0.83 ± 0.02 0.82 ± 0.05 440∗ 0.89 ± 0.02 0.88 ± 0.02 0.88 ± 0.02 0.86 ± 0.03 0.89 ± 0.03 532 0.93 ± 0.01 0.92 ± 0.02 0.92 ± 0.01 0.89 ± 0.02 675 0.96 ± 0.01 0.95 ± 0.01 0.96 ± 0.01 0.94 ± 0.01 0.97 ± 0.03 870 0.98 ± 0.01 0.97 ± 0.01 0.98 ± 0.01 0.96 ± 0.01 0.98 ± 0.03 1020 0.98 ± 0.01 0.98 ± 0.01 0.98 ± 0.01 0.97 ± 0.01 0.98 ± 0.03 1064 0.99 ± 0.01 0.98 ± 0.01 0.98 ± 0.01 0.97 ± 0.01
for the coarse mode a spectral behaviour of the IRI retrieved by GRASP is observed with similar values to the AERONET retrievals. The observed spectral dependence in the IRI is that typically observed for desert dust with a higher IRI in the UV region (Patterson et al., 1977; Dubovik et al., 2002; Wagner et al., 2012). The mean IRI values retrieved using D and N0 schemes for the coarse mode are almost similar
to AERONET retrievals, the differences being within the un-certainties (about 50 %) associated with the IRI provided by AERONET (Dubovik et al., 2000) and similar to those ob-tained in previous work such as Benavent-Oltra et al. (2017) and Tsekeri et al. (2017). Although the discrepancy between IRI values retrieved using the N2scheme for the coarse mode
and those provided by AERONET is high, the IRI values of the N2scheme are consistent with IRI values of around 0.008
at 675 nm obtained at night-time during a dust event in Dakar (Senegal) by Bovchaliuk et al. (2016). Considering the suc-cess in this issue for daytime IRI retrievals, it can be con-cluded that accurate AOD and sky measurements combined with lidar measurements are useful for accurately character-izing CRI and particularly for separating the features of fine and coarse modes as discussed by Dubovik et al. (2000). The approach proposed using additional relative radiance in the lunar aureole is also promising for the retrievals of CRI val-ues. Nevertheless, further studies on the IRI retrieved using night-time sky cameras are required.
5.2.2 Columnar single-scattering albedo
Table 4 shows the averaged values of SSA and their corre-sponding standard deviations obtained by GRASP (using dif-ferent schemes) and AERONET during the whole dust event. As for IRI and RRI retrievals, SSA values retrieved by both GRASP and AERONET show very small temporal variation during the whole period analysed, as confirmed by the low standard deviations of the SSA values.
SSA retrieved by GRASP and AERONET shows a smooth variability between day and night for the total period. Actu-ally, mean differences in SSA values retrieved by GRASP
and AERONET are below 0.03, which it is within the uncer-tainty associated with AERONET retrieval for dust aerosol (Dubovik et al., 2000) and similar to those obtained in previ-ous work, such as Benavent-Oltra et al. (2017) and Tsekeri et al. (2017), for all the proposed schemes. Moreover, SSA val-ues retrieved by both GRASP and AERONET present a com-mon and remarkable spectral variability with SSA increasing from values of around 0.85 in the UV region to values of around 0.99 in the near-infrared. Such SSA values and spec-tral dependence with wavelength is typically found in pure desert dust (Dubovik et al., 2002; Valenzuela et al., 2012). These results are in agreement with the observed for the IRI, likely indicating that all proposed schemes can extract some information about aerosol absorption from the measurements used as input and/or from the self-retrieval strategy in the case of N1.
5.3 Evaluation of vertical aerosol properties
5.3.1 Aerosol extinction profiles at night-time
The multiwavelength lidar system used in this work has two channels detecting Raman scattering at 387 and 607 nm; the Raman method is applied here to independently obtain the aerosol extinction coefficient at 355 and 532 nm. The aerosol extinction profile at 1064 nm is computed using the backscat-ter coefficient retrieved from the Klett–Fernald method with a constant LR for the entire profile of 50 sr, which is a rep-resentative value of desert dust (Guerrero-Rascado et al., 2009). Because Raman measurements of this lidar system are noisy, the lidar signal is averaged to ±15 min around the GRASP retrieval time to get a high signal-to-noise ratio. Ra-man lidar profiles are obtained with a vertical resolution of 7.5 m, and then they are vertically smoothed. The compari-son presented hereafter is made between the GRASP values and the Raman values obtained at the closest chosen 60 log-spaced heights in GRASP.
Figure 5 shows the aerosol extinction profiles for the three cases where we have the three night-time scheme
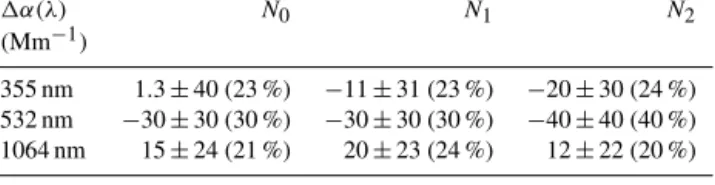
re-Table 5. Differences (± standard deviation) between the extinc-tion values retrieved by GRASP (N0, N1 and N2 schemes) and
Raman during the dust event observed over Granada from 18 to 21 July 2016. The percentage differences are in parentheses.
1α(λ) N0 N1 N2
(Mm−1)
355 nm 1.3 ± 40 (23 %) −11 ± 31 (23 %) −20 ± 30 (24 %)
532 nm −30 ± 30 (30 %) −30 ± 30 (30 %) −40 ± 40 (40 %)
1064 nm 15 ± 24 (21 %) 20 ± 23 (24 %) 12 ± 22 (20 %)
trievals by GRASP and Raman at 355, 532 and 1064 nm. In general, GRASP profiles show similar behaviour to Ra-man with a slight shift that could be caused by smoothing applied to Raman profiles. The extinction profiles retrieved by GRASP are within the uncertainties of the Raman tech-nique (around 20 %) with the exception of the second case (Fig. 5b), where the N2scheme shows large differences with
Raman at 355 and 532 nm. For this case, the N2GRASP
re-trieval fits Raman worse than the other schemes, likely since the obtained residual error was higher than the residuals of N0and N1retrievals which presented higher convergence.
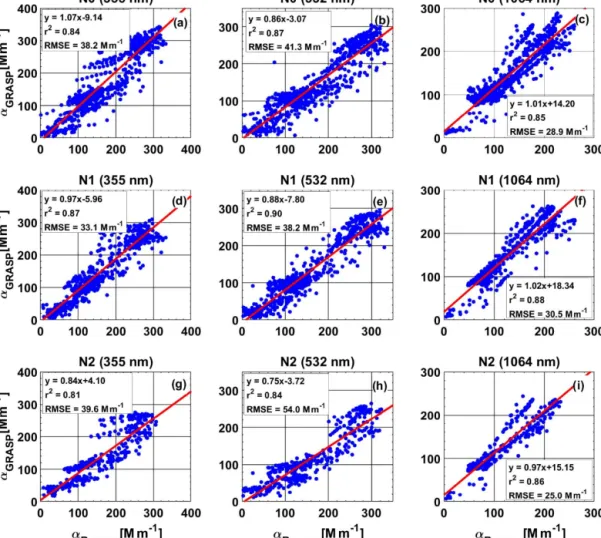
In order to quantify the agreement between the retrieved extinction with GRASP and Raman, Fig. 6 shows aerosol extinction coefficients at 355, 532 and 1064 nm retrieved by GRASP (N0, N1 and N2 schemes) at night-time versus
the values obtained by multiwavelength Raman lidar mea-surements during the dust event observed over Granada in the period 18–21 July 2016. For all schemes and all wave-lengths, α retrieved by GRASP and those obtained by Ra-man lidar measurements are highly correlated with a deter-mination coefficient (r2) ranging from 0.8 to 0.9. The slopes of the regression lines varied between 0.75 and 1.07, indicat-ing that in general the proposed GRASP schemes underes-timate the aerosol extinction coefficient obtained by the Ra-man and Klett–Fernald methods. A statistical overview of the differences between α from GRASP retrievals and from Ra-man measurements is given in Table 5. Particularly, the mean and standard deviation of the differences are given by 1α = αGRASP−αRaman, and the average of the relative absolute
dif-ferences given by 1α(%) = 100 · |αGRASP−αRaman|/αRaman
are also shown.
The relative differences at 355 nm between α values re-trieved by GRASP and those obtained from Raman lidar measurements are around 23 % for the three schemes. The lowest bias at 355 nm between values retrieved by GRASP and those obtained from Raman lidar measurements is found for the N0scheme (1.3 ± 40 Mm−1), while the highest
abso-lute bias (20 ± 30 Mm−1) is obtained for N2schemes.
How-ever, for 532 nm, the differences between GRASP and Ra-man lidar values are larger than those encountered at 355 and 1064 nm, being the relative differences of 30 %, 30 % and 40 % for N0, N1and N2schemes, respectively. In addition,
the mean biases are higher in this case, being −30 ± 30,
−30 ± 30 and −40 ± 40 Mm−1for N0, N1and N2schemes,
respectively. Finally, for 1064 nm, the lowest differences ap-pear for the N2 scheme, in contrast with the other
wave-lengths; the relative differences range from 20 % to 24 % for this wavelength. In general, the obtained GRASP aerosol ex-tinction underestimates Raman measurements at 532 nm for all night-time schemes, while these schemes overestimate the aerosol extinction obtained from Raman measurements at 1064 nm. Part of the observed differences could be asso-ciated with the assumption assoasso-ciated with the incomplete overlap region, where aerosol properties have been assumed as constant in all this area (Herreras et al., 2019). Also, the rather broad assumption of a constant lidar ratio used in the estimation of the extinction at 1064 nm, derived from the backscatter coefficient retrieved by the Klett–Fernald re-trieval, could explain a part of the observed discrepancies at 1064 nm. In general, the differences between GRASP and Raman retrievals present in this work are similar to the dif-ferences obtained in previous studies (e.g. Bovchaliuk et al., 2016; Benavent-Oltra et al., 2017; Tsekeri et al., 2017).
5.3.2 GRASP retrievals versus in situ measurements
Hereafter, σsca(λ)and VC retrieved by GRASP are compared
to the in situ measurements obtained at SNS (2.5 km a.s.l.). In Fig. 7, the averaged profiles of the scattering coefficient at 532 nm (Fig. 7a) and volume concentration profiles (Fig. 7b) retrieved by GRASP night-time schemes are shown. The se-lected profiles correspond to cases where we have retrievals of all N0, N1 and N2 schemes: three cases for P1 and six
cases for the P2period. In the same figure, we added the
av-eraged in situ measurements at SNS, both scattering coeffi-cient at 550 nm and volume concentration. N0and N1
pro-files are very similar with low differences (< 5 %), while N2profiles have lower values in comparison with these two
schemes, with differences of around 15 %. In the case of low aerosol load (P1 period), GRASP N0 and N1 profiles are
closer than in situ measurements for both σscaand VC, while
the N2scheme underestimates these measurements. In
con-trast, for the P2period, the three schemes show good
coher-ence with in situ measurements, especially the VC retrieved by the GRASP N2scheme.
For a direct comparison between GRASP and in situ mea-surements, we used the averaged values of GRASP retrievals at an altitude of 2.5 ± 0.2 km a.s.l. and in situ measurements averaged ±15 min around the GRASP retrieval time. Com-parisons of σscaare made at 450, 550 and 700 nm, and the AE
computed from GRASP retrievals is used to get the equiva-lent σscaat these wavelengths. Figure 8a shows the temporal
evolutions of σsca at 550 nm obtained by GRASP (D, N0,
N1and N2schemes) and by the integrating nephelometer at
SNS for the analysed dust event. Generally, both GRASP and in situ measurements follow the same pattern and are sen-sitive to the arrival of Saharan dust particles. Furthermore, differences between GRASP (using different schemes) and
Figure 5. The aerosol extinction profiles retrieved by GRASP (for night-time schemes) and those calculated by the Raman technique at 355 and 532 nm and the Klett–Fernald method at 1064 nm.
Figure 6. Aerosol extinction coefficient (α) retrieved by GRASP for N0(a–c), N1(d–f) and N2(g–i) as a function of the α calculated by the Raman technique at 355 (a, d, g) and 532 nm (b, e, h) and the Klett–Fernald method at 1064 nm (c, f, i) during the dust event observed over Granada during 18–21 July 2016.
Figure 7. The averaged σscaat 532 nm (a) and VC (b) profiles with its standard deviation (shaded area) retrieved by GRASP N0, N1and
Figure 8. Temporal evolutions of σscaat 550 nm (a) and VC (b) measured at SNS (red) and retrieved by GRASP (D: blue; N0: green;
N1: black; N2: purple) at 2.5 km a.s.l. from 18 to 21 July 2016.
in situ measurements are very small, the differences being less than 25 Mm−1in 90 % of the cases. Generally, the dif-ferences are negligible for the daytime. For night-time, the best agreement is found for the N1 scheme and the worst
accordance is obtained for the N2scheme. The worst
accor-dance for the N2scheme could be due to the smaller
scatter-ing angle range of the almucantar radiance retrieved from the Moon aureole. In addition, the number of available retrievals for each scheme can also be seen in Fig. 7; when a retrieval does not appear in the figure, it is because this retrieval did not pass the imposed convergence criteria.
Figure 9a–c show the scattering coefficients at 450, 550 and 700 nm retrieved by GRASP using the different schemes versus those measured in situ at SNS. As can be seen in these figures, the measured and the retrieved values are well correlated, showing high r2 values be-tween 0.87 and 0.97, although, in general, linear fits indicate that GRASP underestimates the in situ scattering coefficient measurements for low values while showing an overestima-tion for high values.
An overview of the statistical analysis of the differences between GRASP retrievals and in situ scattering coefficient measurements is given in Table 6 that shows the mean of the differences expressed as (1σsca=σscaGRASP−σscaSNS) and also
the mean of the relative differences 1σsca=100 · |σscaGRASP−
σscaSNS|/σscaSNS for each scheme. Due to the drastic change in the scattering coefficient between P1and P2periods, this
sta-tistical analysis is provided separately for these two periods. For the P1period, the GRASP algorithm underestimates the
in situ scattering coefficient measurements both during the day and at night, especially for N0and N2schemes, and at
all wavelengths. The highest differences are found for the N2scheme with differences between 30 % (at 700 nm) and
35 % (at 550 nm). However, for the other schemes (D, N0
and N1) the differences are less than 20 %. Again, the
un-certainties associated with the IRI and with the incomplete overlap assumption as well as the particle loss in the sam-pling inlet may be behind these differences. However, for the P2period, the differences are considerably small, and in
some cases they even go down to half of the differences ob-served in the P1period. By contrast with P1, GRASP
overes-timates the in situ scattering coefficient in P2for all schemes
except for N2. N1, followed by N0, presents the scattering
values fitting the in situ measurements best during the P2
pe-riod, while the D scheme shows the highest differences. The uncertainties associated with the IRI and with the incomplete overlap assumption as well as the particle loss in the sam-pling inlet and uncertainties in the measurements (used as
Figure 9. Scattering coefficient, σsca, at 450, 550 and 700 nm (a–c) and volume concentration (VC) (d) retrieved by GRASP (D: blue;
N0: green; N1: black; N2: purple) at SNS height versus in situ scattering coefficient and volume concentration measurements at SNS during
the dust event over Granada in the period 18–21 July 2016.
input in GRASP but also from the nephelometer) could also be behind at least part of the observed differences.
Figure 8b shows the temporal evolutions of the VC re-trieved by GRASP at 2500 m a.s.l. and those measured at SNS. As for the scattering coefficient, the VC retrieved by GRASP and that measured at SNS follow the same pattern, both being sensitive to the increase in dust event intensity. Differences during the daytime are negligible, while at night-time the differences depend on the GRASP scheme used, the differences in the P1period being much smaller than in the
P2 period, indicating that the differences increase with
in-creasing aerosol load. Figure 9d shows the VC values re-trieved by GRASP (using different schemes) versus those measured at SNS. The correlation between the measured and the retrieved values is very high with r2 between 0.75 and 0.98. As in the case of the scattering coefficient, linear fits indicate an underestimation by GRASP for low values and an overestimation for high values.
Table 7 presents an overview of the statistical analy-sis of VC comparisons. This table shows the mean of 1VC = VCGRASP−VCSNSand the mean of the absolute
rel-ative differences described by 1VC(%) = 100 · |VCGRASP−
VCSNS|/VCSNS. It is clearly observed that GRASP fits the
measured values within 15 % for D, N0and N1schemes
dur-ing the P1period, while for the N2scheme an
underestima-tion of around 30 % is observed. However, for the P2period,
VC from GRASP overestimates the in situ measurements with differences of around 20 % for D, N0and N1schemes;
while for the N2scheme, GRASP still underestimates the in
situ measurements again but with lower differences of around 10 % than the P1 period. The differences between GRASP
(all schemes) and in situ data are within the differences ob-tained in previous studies that compared GRASP retrievals with in situ airborne measurements and the LIRIC algorithm (e.g. Bovchaliuk et al., 2016; Benavent-Oltra et al., 2017; Tsekeri et al., 2017). The different assumption in the GRASP algorithm and the particle loss in the sampling inlet (which increases with increasing aerosol load) may be behind the observed differences between GRASP retrievals and in situ measurements.
Table 6. Differences (± standard deviation) between the scattering values retrieved by GRASP (N0, N1and N2schemes) and in situ mea-surements at SNS provided for the first period (P1) and the second period (P2).
1σsca λ D N0 N1 N2 (Mm−1) (nm) P1 450 −5 ± 4 (8 %) −17 ± 10 (14 %) −9 ± 19 (13 %) −40 ± 14 (30 %) 550 −7 ± 8 (10 %) −20 ± 9 (17 %) −14 ± 15 (13 %) −43 ± 13 (40 %) 700 −5 ± 11 (12 %) −21 ± 9 (19 %) −21 ± 11 (17 %) −36 ± 14 (30 %) P2 450 40 ± 60 (21 %) 26 ± 17 (13 %) 9 ± 8 (5 %) −31 ± 16 (14 %) 550 30 ± 60 (16 %) 11 ± 13 (7 %) 8 ± 7 (4 %) −32 ± 17 (13 %) 700 30 ± 60 (16 %) 1.3 ± 12 (4 %) 6 ± 30 (12 %) −17 ± 19 (9 %)
Table 7. Differences (± standard deviation) between the volume concentration values retrieved by GRASP (N0, N1and N2schemes) and in situ measurements at SNS provided for the first period (P1) and the second period (P2).
1VC D N0 N1 N2
(µm3cm−3)
P1 −4 ± 9 (14 %) −5 ± 7 (9 %) 1.6 ± 10 (12 %) −21 ± 14 (30 %)
P2 30 ± 50 (20 %) 29 ± 12 (20 %) 31 ± 32 (23 %) −9 ± 21 (10 %)
6 Summary and conclusions
The main goal of this work has been to explore the capac-ity and possibilities of the GRASP (Generalized Retrieval of Aerosol and Surface Properties) algorithm to retrieve verti-cal profiles and column-integrated optiverti-cal and microphysiverti-cal aerosol properties at night-time. To this end, we proposed three different schemes combining the measurements of dif-ferent remote-sensing instruments such as elastic lidar, sun– sky–lunar photometer and/or sky camera. The experimental measurements used in this wok were acquired during a Sa-haran dust event that took place during the Sierra Nevada Lidar aerOsol Profiling Experiment I (SLOPE I) campaign at Granada (Spain) from 18 to 21 July 2016. This event has been selected because intensive aerosol properties such as the Ångström exponent did not vary too much, with a value of around 0.2, and were very intense, with aerosol optical depth (AOD) reaching twice the typical values for Saharan dust outbreaks at Granada.
The three schemes proposed to run GRASP for night-time retrievals have different assumptions, such as the following: no day–night variation in aerosol intensive or extensive (ex-cept vertical distribution) properties (N0 scheme); no day–
night variation in aerosol intensive properties but possible changes in extensive aerosol properties (N1 scheme); day–
night variation in both intensive and extensive aerosol prop-erties (N2scheme).
AERONET inversion products have been used to study the coherence of GRASP night-time retrievals and of the contin-uous day-to-night aerosol evolution. For the parameters de-rived from columnar aerosol size distributions, all GRASP schemes show coherent values with AERONET. A similar
thing happens for the complex refractive index (CRI) and single-scattering albedo (SSA), although more variability is observed, particularly for the N2 scheme due likely to the
large uncertainties in relative sky radiance measurements at lunar aureole and the higher freedom degrees assumed than in the N1 scheme. Nevertheless, we were not able to go
further in the evaluation of the accuracy of the GRASP re-trieved parameters. Doing so would require a large synthetic database that is beyond the scope of the paper. Also, it is needed to study the sensitivity of retrievals to errors in the input optical data, which is the objective of future work.
In general, the aerosol extinction from GRASP and Ra-man measurements agrees quite well, with differences be-low 30 % at 355, 532 and 1064 nm. The scattering coeffi-cient (σsca) and aerosol volume concentration (VC) retrieved
by GRASP (using different schemes) at 2500 m a.s.l. have been evaluated against in situ measurements acquired at Sierra Nevada Station during a dust event classified into two periods: moderate (P1) and high (P2) aerosol load. Usually,
both GRASP retrievals and in situ measurements follow the same patterns and are sensitive to the arrival of Saharan dust particles. The GRASP N0 and N1 schemes underestimate
the in situ σscaand VC measurements for the P1period
(ex-cept for VC from the N1scheme) and overestimate them for
the P2period, with differences between 4 % and 23 %. On
the other hand, the GRASP N2 scheme underestimates the
in situ measurement both σsca and VC, with differences of
around 30 % and 10 % for the P1 and P2 periods,
respec-tively. In general, N2show slightly higher differences than
other schemes; however, the best results for VC in P2are for
The obtained differences could likely be caused by differ-ent factors like the approximation used to fill the incomplete overlap area, the uncertainties in data used as input (large dif-ferences shown in the N2scheme could be due the
uncertain-ties associated with the measurements of relative lunar sky radiance), the self-uncertainties of the GRASP algorithm un-der the configurations implemented but also the uncertainty in the values used as reference (like uncertainties in the in situ measurements), the lack of overlap between night-time retrievals and AERONET daytime retrievals used as refer-ence, and possible inhomogeneity in the atmosphere and lo-cal aerosol sources when the GRASP retrievals are compared with in situ measurements carried out in the mountains.
The analysis presented here is useful to present three con-figurations of the GRASP algorithm to retrieve night-time column-integrated and vertically resolved aerosol properties by a combination of different remote-sensing instruments. In fact, the proposed N2scheme provides a stand-alone way to
retrieve intensive and extensive aerosol properties at night in cases with high values of AOD and high Moon irradiance (at least between the first and last Moon quarters) independent of daytime information, even when this scheme usually presents higher differences than the reference values. However, this study is focuses on one aerosol episode which is represen-tative of Saharan dust transport, and hence it is necessary to use a more complete data set that includes at least different aerosol types. Additional studies are needed in this regard to investigate the accuracy and uncertainty of the retrieved GRASP products obtained with the proposed schemes; in this sense sensitivity tests could be done using synthetic data as reference. Therefore, in future studies, it is planned to de-velop different sensitivity studies with the proposed schemes. In addition, we could try to study the capabilities of GRASP to work with Raman lidar signals and implement the multi-pixel scenario proposed by Dubovik et al. (2011) to retrieve the aerosol properties at night.
Data availability. The GRASP inversion algorithm software used in this work is free and publicly available at http://www.grasp-open. com (last access: 1 July 2019). Lidar, lunar photometer and in situ raw data are available from the authors upon request. Sun– sky photometer data are accessible on the AERONET website (http: //aeronet.gsfc.nasa.gov/, last access: 25 July 2019).
Author contributions. JABO performed the GRASP retrievals, analysed the data and wrote the paper. RR processed the sky camera measurements and helped to perform GRASP retrievals. JACV and HL operated and processed the in situ measurements. The formal analysis, investigation, writing of the original draft, preparation, re-view of the writing and editing were performed by JABO, RR, DPR, JACV, HL and LAA. POA, AEBV, GdAM and JLGR operated the lidar and helped to calculate Raman profiles. AL, DF, MH, BT and OD provided feedback on the GRASP algorithm. AB and PG pro-cessed the night-time measurements of the sun–sky–lunar
photome-ter. The project administration, funding acquisition and design of the SLOPE campaign were done by FJOR and LAA. All authors provided comments on the paper and helped with paper correction.
Competing interests. The authors declare that they have no conflict of interest.
Special issue statement. This article is part of the special issue “EARLINET aerosol profiling: contributions to atmospheric and climate research”. It is not associated with a conference.
Acknowledgements. Jose Antonio Benavent-Oltra is funded by MINECO under the predoctoral programme FPI (BES-2014-068893) and by the University of Granada through “Plan Propio. Programa 7, Convocatoria 2018” and “Plan Propio. Programa 7, Convocatoria 2019”. Roberto Román is funded by MINECO under the postdoctoral programme Juan de la Cierva-Incorporación (IJCI-2016-30007). Juan Andrés Casquero-Vera is funded by MINECO under the predoctoral programme FPI (BES-2017-080015). An-drés Esteban Bedoya-Velásquez has been supported by a grant for PhD studies in Colombia, COLCIENCIAS (Doctorado Nacional – 647), associated with the Physics Sciences programme at the Uni-versidad Nacional de Colombia, Sede Medellín and the Asociación Universitaria Iberoamericana de Postgrado (AUIP). Oleg Dubovik was supported by the Labex CaPPA project, which is funded by the French National Research Agency under contract “ANR-11-LABX-0005-01”. GRASP evaluations were done during secondments funded by the Marie Skłodowska-Curie Research Innovation and Staff Exchange (RISE) GRASP-ACE (grant no. 778349) project. The authors thankfully acknowledge the FEDER programme for the instrumentation used in this work, the University of Granada, which supported this study through the excellence units programme, and the Sierra Nevada National Park. Thanks to AERONET and ACTRIS/AERONET-Europe for the scientific and technical sup-port. Finally, the authors would like to acknowledge the use of the GRASP inversion algorithm software (http://www.grasp-open.com, last access: 1 July 2019) in this work.
Financial support. This research has been supported by the European Union through the H2020 programme (ACTRIS-2, grant no. 654109) and the Spanish Ministry of Economy and Competitiveness (projects CMT2015-66742-R, CGL2016-81092-R, 85344-CGL2016-81092-R, RTI2018-097864-B-I00 and CGL2017-90884-REDT).
Review statement. This paper was edited by Eduardo Landulfo and reviewed by two anonymous referees.