HAL Id: hal-01702084
https://hal.archives-ouvertes.fr/hal-01702084
Submitted on 6 Feb 2018
HAL is a multi-disciplinary open access
archive for the deposit and dissemination of
sci-entific research documents, whether they are
pub-lished or not. The documents may come from
teaching and research institutions in France or
abroad, or from public or private research centers.
L’archive ouverte pluridisciplinaire HAL, est
destinée au dépôt et à la diffusion de documents
scientifiques de niveau recherche, publiés ou non,
émanant des établissements d’enseignement et de
recherche français ou étrangers, des laboratoires
publics ou privés.
Free Surface Length Scale Estimation in Hydraulic
Jumps
Dominique Mouazé, F. Murzyn, J. Chaplin
To cite this version:
Dominique Mouazé, F. Murzyn, J. Chaplin. Free Surface Length Scale Estimation in Hydraulic Jumps.
Journal of Fluids Engineering, American Society of Mechanical Engineers, 2005, 127 (6), pp.1191-1193.
�10.1115/1.2060736�. �hal-01702084�
FREE SURFACE LENGTH SCALE ESTIMATION IN HYDRAULIC JUMPS
D. MOUAZE, F. MURZYN, J.R. CHAPLIN School of Civil Engineering and the Environment,
University of Southampton
Southampton SO17 1BJ, United Kingdom Tel : +44 23 8059 4656, Fax : +44 23 8067 7519
[email protected] – [email protected] -
KEYWORDS
turbulence, free surface, hydraulic jump, two-phase flow, image analysis
ABSTRACT
In the context of recent work by Brocchini & Peregrine [1,2], this paper aims to document free surface elevations, and free surface length scales in hydraulic jumps with Froude numbers between 1.98 and 4.82. Although information on bubble size, frequency and velocities in hydraulic jumps are available in the literature, there is not much data on the features of the free surface, or on mixing layer thickness. In the present case, measurements at the free surface have been realized with two "home-made" miniature resistive wire gauges made of two parallel 50 micron diameter wires 1mm apart. These instruments were calibrated dynamically over a range of frequencies up to 20 Hz.
The present results extend the range of Froude numbers for which two-phase measurements in hydraulic jumps are available. In most respects, it confirms earlier results obtained with different experimental techniques. Length scales at the free surface are deduced from cross-correlation analysis of wire gauge measurements, and are compared with similar data obtained from images of the surface.
INTRODUCTION
Hydraulic jumps often occur in open channels when the transition from a super-critical to a sub-critical flow is reached. It is then characterized by a strong free surface motion leading to air entrainment. The same process is important in a number of situations and applications, notably in the air-sea
exchange of mass, momentum and heat. Indeed on the upper ocean, this mechanism has a major influence on air/sea gas exchange, mixing processes, energy dissipation. It is then relevant to investigate how the processes involved in this particular multi-phase flow are affected by turbulence, bubble features, free-surface and their interactions.
Previous studies were mainly performed with Pitot tubes and conductivity probes (Chanson, [3]), Laser Doppler Velocimetry (Waniewski et al., [4]), or Acoustic Doppler Velocimetry (Liu et al., [5]). Intrusive probes clearly suffer the disadvantage that they could affect the flow, but the non-intrusive techniques (LDV and ADV) also face strong technical limitations in such aerated conditions (due to light diffraction by bubbles).
The goal of this paper is to present some measurements of the free surface of the jump made by means of miniature resistive wires. This work presents also a comparison of free surface length scales deduced either from correlation of free surface measurements or from spectral image analysis of the hydraulic jump.
The investigations were performed for four different Froude numbers (1.98 < Fr < 4.82) in a partially-developed flow. This range of small Froude number was imposed by the experimental set-up configuration. For Fr>5, instability of the toe was observed making measurements quite complicated.
EXPERIMENTAL SET-UP
Instrumentation and data processing
The experiments were conducted in a 12m long recirculating channel at the University of Southampton. The flow rate can be controlled by a regulating valve. The flume is
0.3m wide, 0.4m high and the roughness height of the flat bottom was measured at 0.3mm. The jump was generated by a sluice gate whose elevation above the channel bottom could be adjusted between 3cm to 9cm with in fixed steps of 1cm (Fig. 1. Figure 2 represents the sketch of the experiment, the position of the axis and the parameters definition. Xfoot is defined as the
mean position of the foot of the jump.
Free surface measurements
Free surface elevations were measured with resistive probes. Each probe consists of two wires of 50m diameter, 1mm apart. A static calibration gives a direct relationship between the surface elevation and the output voltage from a wave monitor. A dynamic calibration of these wire gauges has been made with a vibrometer in order to estimate their frequency response. The results established a cut-off frequency (-3dB) of 12Hz which is quite reasonable considering previous studies. Liu et al. [6] found a cut-off frequency of 7Hz. During the hydraulic jump measurements 640 samples were collected at a rate of 128Hz for each position,
The free surface length scales are determined from the correlation between the signals Si coming from two wire gauges separated in the transverse direction. The separation, r, between the wire gauges was adjusted from 3mm to more than 100mm to follow the whole decay of the correlation coefficient Ri :
2 2 . ) ( iB iA iB iA i s s s s r AB R (2)
The free surface transverse length scale Lg is defined by :
max 0 ( ) r i g R r dr L (3)where rmax is the distance r for which Ri fells to 0.
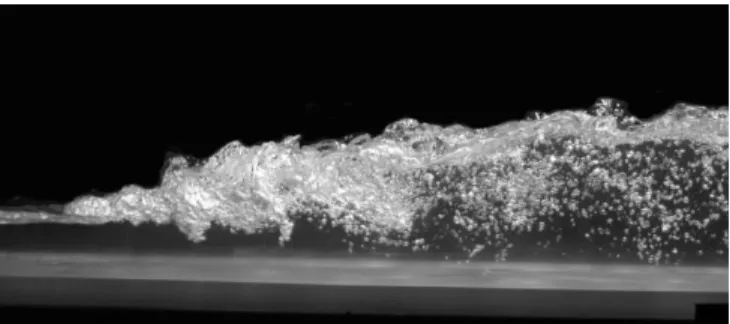
Fig. 1 Hydraulic jump in the recirculating tank (Fr = 3.65)
H1
H2
H3
Xfoot
Turbulent shear layer Sluice gate
Bubbly flow
X
“Mixture flow”
Fig. 2 Sketch of the hydraulic jump set-up
Free surface visualization
A high speed monochrome camera has been used to record the water surface of the hydraulic jump. The video acquisition rate was 120 frames per second at a frame size of 648 x 484 pixels. For each flow condition, the images were collected over 2 to 4 seconds. This is long enough as the stability of the toe has been previously improved for 2<Fr<5.
The grey levels (256) of a transverse scanning line (over 500 pixels) were collected using the Matlab image processing toolbox (Fig. 3). This toolbox is a collection of functions specialized in image processing operations (such as the image analysis and enhancement or the image transformations). These functions can be part of programs in a computing environment. The grey levels along this line were recorded in a matrix for all the frames. A one-dimensional wavenumber spectrum was calculated for each image. An averaged spectrum of the whole image set exhibits a serie of 3 to 4 peaks which identify the characteristic wavelengths of the flow. These length scales will be compared with the free surface length scales obtained by the wire gauge correlation technique.
Both transversal and longitudinal length scales have been determined with the ‘wire technique’ during the experiment. Unfortunately the position of the digital camera allows a comparison between two different techniques for the determination of the length scales only in the transversal direction. Further investigations are needed to find the right position of the camera in order to extend the study to the longitudinal scales. 648 pixels 48 4 pi xe ls 2 cm
Scanning line (500 pixels)
Incoming flow
Experimental conditions
The incident velocity U upstream of the foot of the jump and the Froude number (Fr) were estimated from the measurements of the elevations H2 and H3:
2 2 3 2 4 1 2 1 Fr H H (4) and 2 gH U Fr (5)
Four set of experiments are presented in this paper, characterized by four different Froude numbers. The following table presents the flow conditions:
Test H1(m) H2(m) H3(m) U (m/s) Fr
1 0.186 0.059 0.138 1.50 1.98
2 0.200 0.046 0.137 1.64 2.43
3 0.280 0.032 0.150 2.05 3.65
4 0.320 0.021 0.133 2.19 4.82
Table 1. Experimental conditions
EXPERIMENTAL RESULTS
The experiments were performed for a maximum incident velocity U of 2.19m/s. An estimate of the bed boundary layer at
the foot of the jump suggested a maximum thickness of 0.36H2.
Hence the hydraulic jump can be considered as partially-developed for all flow conditions [7].
Free surface measurements
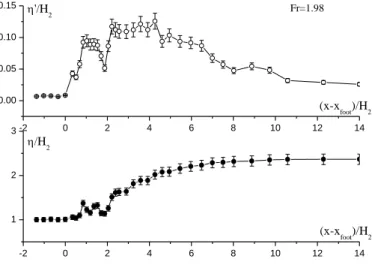
Time averaged free surface elevations ( and their standard deviations (') are plotted against streamwise position relative to that of the foot of the jump (x-xfoot)/H2 on Fig. 4 and
on Fig. 5. -2 0 2 4 6 8 10 12 14 1 2 3 -2 0 2 4 6 8 10 12 14 0.00 0.05 0.10 0.15 (x-xfoot)/H2 Fr=1.98 H 2 'H2 (x-xfoot)/H2
Fig. 4 Free surface and fluctuations profile for Fr=1.98
-4 0 4 8 12 16 20 24 1 2 3 4 5 -4 0 4 8 12 16 20 24 0.0 0.1 0.2 0.3 0.4 (x-xfoor)/H2 (x-x foot)/H2 Fr=3.65 H 2 'H 2
Fig. 5 Free surface and fluctuations profile for Fr=3.65 These plots show three distinctive regions according to ( x - xfoot )/H2 :
Upstream of the foot of the jump, the free surface is flat and there is no visible sign of turbulence.
At the position of the foot ((x-xfoot)/H2 = 0), the free surface
profile grows slightly while the fluctuations profile shows a sudden strong gradient revealing the formation of the jump. The fluctuations reach a maximum and reveal an area of intensive turbulence. The bubbles generated at the foot of the jump are entrained in the shear layer and in the roller, which is characterized by large recirculation vortices. Coherent structures, reaching the free surface, are revealed by the undulations of the free surface plots and strong variations of '. The length of this intensive turbulent area represents 25% to 30% of the total length of the jump.
Lastly, a large dissipative zone takes place downstream as the free surface fluctuations decrease quickly and as the free surface elevation approaches the horizontal.
Free surface length scales
The following plots show a superposition of the free surface length scale estimations deduced either from the wire gauge measurements or from the video analysis.
0 5 10 15 20 25 30 35 0 1 2 3 4 5 Fr=1.98 Fr=2.43 Fr=2.43 (video) Fr=3.65 Fr=4.82 Fr=4.82 (video) (x-xfoot)/H2 Lg/H2
Fig.6 Transverse free surface length scales
The transverse length scale Lg grows linearly with distance downstream from the foot of the jump (Fig. 6). As the behavior of Lg does not show any obvious dependence with the Froude number, the length scale is mostly governed by the upstream water depth H2. The results deduced from the wire gauge measurements show an increasing data scattering occurring for the highest values of (x-xfoot)/H2 as well.
The accuracy of the wire gauges is relatively high according to the calibration realized in a quite tank. Less than 5% of error have been estimated for this experimental technique. The uncertainties are mainly due to air crossing the wires below the free surface.
For the same position (x-xfoot)/H2, each cross sign on Fig. 6
refers to a peak revealed by the video spectral analysis (see the section above on Experimental set-up). The calculations of Lg based on the integral of the cross-correlation coefficient Ri provides only one measure of the surface roughness scale over the whole acquisition duration at each position (120s). The video analysis gives a range of scales over a very short time, but the averaged results presented in Fig. 7 stay within one standard deviation of the results obtained from the correlation technique.
CONCLUSION
Most previous studies in hydraulic jumps have been performed with intrusive techniques which are not necessarily well-suited to aerated flow.
The free surface elevations and turbulent fluctuations show three distinctive regions along the jump, including the region just downstream of the foot (high level of turbulence).
Free surface length scales obtained from wire gauges were in reasonable agreement with those computed from a series of images of the water surface made by high speed video from above.
Understanding the properties of the free surface turbulence is still a challenging topic [7]. Therefore this study has been extended to the case of a jet flow beneath a free surface.
Knowledge on the role of the surface tension, salinity or scale effects is still needed.
ACKNOWLEDGMENTS
This work was supported by the EPSRC (contract GR/R85068) and through a European Community Marie Curie fellowship (contract HPMF-CT-2002-01897) held by the first author.
NOMENCLATURE
ADV Acoustic Doppler Velocimetry
C Void fraction
Dt Diffusion coefficient in the shear layer
Fr Froude number
LDV Laser Doppler Velocimetry
Lg Free surface length scale (transversal)
r Separation between the two wire gauges
Ri Free surface correlation coefficient
Si Signal from the wire gauge
T Total measurement duration
i Duration of the air phaseU Incident velocity
Xfoot Mean position of the jump's foot
zCmax Position where C reaches a maximum
zshear Upper limit of the turbulent shear region
z* Lower limit of the mixing layer
REFERENCES
[1] Brocchini, M. & Peregrine D.H., 2001a, "The Dynamics of Strong Turbulence at Free Surfaces. Part 1. Description" J. Fluid Mech., 449, pp. 225-254
[2] Brocchini, M. & Peregrine D.H., 2001b, "The Dynamics of Strong Turbulence at Free Surfaces. Part 2. The Boundary Conditions" J. Fluid Mech., 449, pp. 255-290
[3] Chanson, H., 1996, "Air Bubble Entrainment in Free-Surface Turbulent Shear Flow", Academic Press, London
[4] Waniewski, T.A., Hunter, C. & Brennen, C.E., 2001, "Bubble Measurements Downstream of Hydraulic Jumps" Int. Journal of Multiphase Flow, 27, pp.1271-1284
[5] Liu, H.T., Katsaros, K.B., Weissman, M.A., 1982, "Dynamic Response of Thin Wire Wave Gauges" Journal of Geophysical Research, 87, pp. 5686-5698
[6] Liu, M., Zhu, D.Z., Rajaratnam, N., 2002, "Evaluation of ADV Measurements in Bubbly Two-phase Flows" Hydraulic Proceedings of the Measurements and Experimental Methods Conference, ASCE, EWRI, Estes Park (CO)
[7] Murzyn, F., Mouaze, D., Chaplin, J.R., 2005, "Optical Fibre Probe Measurements of Bubbly Flow in Hydraulic Jumps" Journal of Multiphase Flow, 31, 1, pp 141-154