HAL Id: hal-01832189
https://hal.archives-ouvertes.fr/hal-01832189
Submitted on 6 Jul 2018
HAL is a multi-disciplinary open access
archive for the deposit and dissemination of sci-entific research documents, whether they are pub-lished or not. The documents may come from teaching and research institutions in France or abroad, or from public or private research centers.
L’archive ouverte pluridisciplinaire HAL, est destinée au dépôt et à la diffusion de documents scientifiques de niveau recherche, publiés ou non, émanant des établissements d’enseignement et de recherche français ou étrangers, des laboratoires publics ou privés.
Non-basal dislocations should be accounted for in
simulating ice mass flow
T. Chauve, M. Montagnat, S. Piazolo, B. Journaux, J. Wheeler, F. Barou, D.
Mainprice, Andrea Tommasi
To cite this version:
T. Chauve, M. Montagnat, S. Piazolo, B. Journaux, J. Wheeler, et al.. Non-basal dislocations should be accounted for in simulating ice mass flow. Earth and Planetary Science Letters, Elsevier, 2017, 473, pp.247-255. �10.1016/j.epsl.2017.06.020�. �hal-01832189�
Non-basal dislocations should be accounted for in simulating ice
1mass flow
2T. Chauvea, M. Montagnata, S. Piazolob,c, B. Journauxa, J. Wheelerd, F. Baroue, D.
3
Mainpricee, A. Tommasie
4
aUniv. Grenoble Alpes, CNRS, IRD, G-INP1, IGE, F-38000 Grenoble, France 5
bARC Center of Excellence for Core to Crust Fluid Systems (CCFS) and GEMOC, Department of Earth 6
and Planetary Science, Macquarie University, NSW 2109, Australia
7
cSchool of Earth and Environment, University of Leeds, Leeds LS2 9JT, UK 8
dDepartment of Earth and Ocean Sciences, School of Environmental Science, University of Liverpool, 9
Liverpool L69 3GP, UK
10
eGeosciences Montpellier, Universit´e de Montpellier / CNRS F-34095 Montpellier, France 11
Abstract
12
Prediction of ice mass flow and associated dynamics is pivotal at a time of climate change. Ice
13
flow is dominantly accommodated by the motion of crystal defects - the dislocations. In the
14
specific case of ice, their observation is not always accessible by means of the classical tools
15
such as X-ray diffraction or transmission electron microscopy (TEM). Part of the dislocation
16
population, the geometrically necessary dislocations (GNDs) can nevertheless be constrained
17
using crystal orientation measurements via electron backscattering diffraction (EBSD)
as-18
sociated with appropriate analyses based on the Nye (1950) approach. The present study
19
uses the Weighted Burgers Vectors, a reduced formulation of the Nye theory that enables
20
the characterization of GNDs. Applied to ice, this method documents, for the first time, the
21
presence of dislocations with non-basal [c] or < c+a > Burgers vectors. These [c] or < c+a >
22
dislocations represent up to 35% of the GNDs observed in laboratory-deformed ice samples.
23
Our findings offer a more complex and comprehensive picture of the key plasticity processes
24
responsible for polycrystalline ice creep and provide better constraints on the constitutive
25
mechanical laws implemented in ice sheet flow models used to predict the response of Earth
26
ice masses to climate change.
27
Keywords:
28
Non-basal dislocations in ice, Weighted Burgers Vectors, cryo-EBSD, crystal plasticity
29
1. Introduction
30
Understanding the deformation behavior of ice crystals is essential for modeling the flow
31
of glaciers and ice sheets. Ice on Earth, ice Ih, has an hexagonal crystalline structure. It has
32
a strong viscoplastic anisotropy, since deformation occurs almost exclusively by dislocation
33
glide on the basal plane (Duval et al., 1983). This crystal-scale anisotropy results in strong
34
textures (crystallographic orientations) and, hence, in large-scale texture-induced anisotropy.
35
This anisotropy has crucial effects on large-scale ice flow (e.g. Durand et al. (2007)). It is
36
responsible, for instance, for abrupt changes in rheology between the ice sheet and the ice
shelf (Ma et al., 2010) and for basal folding (Bons et al., 2016). The viscoplastic anisotropy
38
of ice crystals also results in strong strain and stress heterogeneity (Grennerat et al., 2012),
39
leading to dynamic recrystallization (Duval et al., 1983; Chauve et al., 2015), a process that
40
is essentially controlled by the dislocation behavior and interactions (Chauve et al., 2017).
41
Ice is therefore a good analogue to study the behaviour of materials with high viscoplastic
42
anisotropy deforming at high temperature (T /Tmelt> 0.9), such as the Earth lower crust and
43
mantle, where the dominant rock-forming minerals (e.g. feldspar, quartz, olivine, pyroxenes,
44
micas) are highly anisotropic.
45
However, the difficulty in observing dislocations by TEM or X-ray diffraction results in a
46
lack of knowledge on the activity of other slip systems or of mechanisms such as climb or
47
cross-slip that may complement basal glide. The lack of constraints on the activity of the
48
non-basal slip systems in ice limits the ability of micro-macro crystal plasticity methods to
49
simulate the mechanical behaviour of ice and its evolution (see Montagnat et al. (2014) for a
50
review). To approach a realistic mechanical behaviour, which can be used to model the flow
51
of glaciers and polar ice sheets, strong assumptions have been made (see Castelnau et al.
52
(1997); Kennedy et al. (2013) for instance). In particular, in all models based on crystal
53
plasticity, four to five independent slip systems are required to maintain strain compatibility
54
(Hutchinson, 1977), hence for ice, glide on non-basal slip systems is allowed. Castelnau et al.
55
(1997) imposed a non basal activity 70 times harder than basal activity, while Llorens et al.
56
(2016) lowered this ratio to 20, enabling a significant contribution of non-basal systems to
57
deformation, without any experimental evidence to stand on.
58
Most observed dislocations in ice so far have one of the three equivalent 1/3 < 2¯1¯10 >
Burg-59
ers vectors and are constrained to glide in the basal plane (0001) owing to their tendency to
60
dissociate into partial dislocations (Higashi, 1988; Hondoh, 2000). Rare 1/3 < 2¯1¯10 >
dis-61
locations have been observed to glide on prismatic planes by X-ray diffraction in low strain
62
conditions where very few dislocations were activated (Shearwood and Withworth, 1989),
63
and when crystals were oriented to minimize the resolved shear stress in the basal plane (Liu
64
and Baker, 1995). Indirect evidence of double cross-slip of basal dislocations was obtained
65
from X-ray diffraction observations on single crystal deformed in torsion (Montagnat et al.,
66
2006). Dislocation Dynamic simulations estimated the local stress necessary to activate this
67
mechanism (Chevy et al., 2012).
68
So far, direct observations (via X-ray diffraction) of dislocations with Burgers vector [c] =
69
[0001] or < c + a >= 1/3 < 11¯23 > are limited to very specific conditions such as peripheral
70
dislocations of stacking faults formed during crystal growth or under cooling (Higashi, 1988).
71
The formation of stacking faults under cooling is assumed to result from climb of the basal
72
component of dislocation loops with < c + a > Burgers vector, induced by the precipitation
73
of excess point defects generated by cooling. Dislocation loops with [c]-component Burgers
74
vectors were also observed to form due to tiny inclusions (water droplets for pure ice, or
75
solute pockets for NH3-doped ice) formed during crystallization and due to thermal stress
76
imposed in the crystal growing apparatus (Oguro and Higashi, 1971). To our knowledge,
77
there are no other direct observations of dislocations with a [c]-component Burgers vector for
78
pure or natural ice.
79
Weikusat et al. (2011b) indirectly inferred [c] or < c + a > dislocations as necessary to explain
80
some subgrain boundary structures observed in ice core samples. The techniques used
(sur-81
face sublimation to extract subgrain boundaries and discrete X-ray Laue diffraction analyses
to obtain local orientations along profiles) did not provide full constraints on the nature of
83
the subgrain boundaries. Nevertheless, by assuming that the subgrain boundaries were
per-84
pendicular to the surface, some could be interpreted as tilt boundaries composed of [c] or
85
< c + a > dislocations.
86
Dislocations are nucleated and contribute to plastic deformation by gliding. The dislocations
87
can be stored in the microstructure by two modes; as trapped dislocations due to dislocation
88
interaction, called Statistically Stored Dislocations (SSDs) and as Geometrically Necessary
89
Dislocations (GNDs) (Fleck et al., 1994). GNDs are intimately associated with lattice
cur-90
vature, and hence contribute to local strain that can be detected by EBSD as misorientation
91
gradients. They contribute to heterogeneous plastic strain, such as bending or twisting but
92
they can develop even though the experimental conditions allows the possibility of a
homo-93
geneous deformation (Van der Giessen and Needleman, 2003). It is generally acknowledged
94
that density of GNDs is significantly higher than density of SSDs (Kubin and Mortensen,
95
2003).
96
EBSD analyses of ice were recently made possible thanks to cryo-stages able to maintain
97
samples at very cold temperatures (-100 to -150◦C), under low vacuum. This technique gives
98
access to full crystal orientations over reasonably large polycrystalline samples (few cm2),
99
with a good spatial resolution (down to 0.1 µm). The first applications of EBSD on ice
100
were oriented towards full crystal orientation measurements at the grain level (Obbard et al.,
101
2006). High spatial resolution crystal misorientations within grains were recently used to
102
characterize dislocation substructures (Piazolo et al., 2008; Montagnat et al., 2011; Weikusat
103
et al., 2011a; Montagnat et al., 2015; Chauve et al., 2017). EBSD observations performed in
104
the above mentioned studies are post-mortem and therefore record the effects of the GNDs
105
remaining after relaxation of the internal stress field through anelastic deformation.
106
Since conventional EBSD maps are 2D, they do not give access to the full dislocation (Nye)
107
tensor α but only to five components (α12, α21, α13, α23, α33) where the subscript 3 refers to
108
the normal to the EBSD surface. By this mean, EBSD observations provide lower bounds
109
of GND density (Pantleon, 2008). Recently, Wheeler et al. (2009) proposed a method of
110
characterization of the GNDs called the “weighted Burgers vector” (WBV) (see Appendix A
111
for a detailed description). It corresponds to the projection of the Nye tensor on the EBSD
112
surface and can be expressed as W BV = (α13, α23, α33). The WBV tool does not aim at
ap-113
proaching the full dislocation density tensor (as attempted by Pantleon (2008) for instance),
114
but does not require the third dimension to provide meaningful information about the GND
115
population. Its amplitude gives a lower bound for the density of GNDs and its direction
116
refers to the Burgers vector of the sampled GNDs. One important point is that although the
117
WBV does not record all the GNDs present, it cannot contain phantom directions. If it has
118
a significant [c]-component then at least some of the Burgers vectors of the GNDs must have
119
a [c]-component though this does not mean they have to be parallel to [c].
120
As for the Nye tensor, the WBV analysis only reflects the GND contribution to the
dislo-121
cation density. Without further assumptions, this contribution cannot be directly related to
122
the mobile dislocations responsible for most of the plastic deformation.
123
Cryo-EBSD associated with the WBV analysis was recently shown to be very efficient to
124
characterize the nature of GNDs in ice (Piazolo et al., 2015). Although restricted to small
125
areas, this previous study revealed a contribution of dislocations with [c]- or < c + a
>-126
component. These observations encouraged us to perform new EBSD observations on ice
polycrystals deformed in the laboratory, with a higher spatial resolution and over larger
ar-128
eas than in the preliminary study of Piazolo et al. (2015).
129
The present work aims therefore at (i) documenting the presence of dislocations with
Burg-130
ers vectors comprising a component along [c], (ii) estimating quantitatively the significance
131
of these dislocations within the observed GNDs, and (iii) discussing the implication of this
132
observation for the micro-macro modeling of ice mechanical behaviour, up to the scale of
133
glaciers and polar ice flow.
134
2. Material and Methods
135
Large ice polycrystalline samples were deformed in torsion and uniaxial unconfined
com-136
pression under constant imposed load at high homologous temperature (T /Tmelt∼ 0.98, in a
137
cold room). The samples deformed by compression had a columnar initial grain shape with
138
large grain size (1 to 4 cm2) (see Grennerat et al. (2012); Chauve et al. (2017) for details)
139
and were deformed under a constant load of 0.5 M P a applied in the plane perpendicular to
140
the column directions, up to a macroscopic strain of about 3%. Torsion tests were performed
141
on solid cylinders (radius × height = 18 mm × 60 mm) of granular ice (millimetre grain
142
size), under a maximum applied shear stress at the outer radius between 0.5 and 0.6 M P a
143
(experimental conditions similar to the ones in Bouchez and Duval (1982); Montagnat et al.
144
(2006)). Several tests enabled to cover a range of maximum shear strain between 0.01 and
145
2. These two experimental conditions are complementary. The compression tests enable to
146
follow the first step of deformation in a model microstructure invariant in the third dimension
147
(parallel to the columns) that is close to a 2.5D configuration, where surface observations are
148
a good proxy to the bulk mechanisms (Grennerat et al., 2012). The torsion experiments give
149
access to large strain levels on an initially isotropic microstructure and texture. A summary
150
of the experimental conditions of the tests used in this study is given in table 1.
151
Id Sample Mechanical test T ◦C Stress εmax γmax CI01 Columnar ice Uniaxial comp. −7 0.5 M P a 0.03
TGI01 Granular ice Torsion −7 0.46 M P a 0.006 0.012 TGI02 Granular ice Torsion −7 0.49 M P a 0.1 0.2 TGI03 Granular ice Torsion −7 0.59 M P a 0.21 0.42 TGI04 Granular ice Torsion −7 0.63 M P a 0.87 1.96
Table 1: Summary of the experimental conditions for the tests used in the study. Compression tests were performed under constant applied load, and torsion test under constant applied torque (the corresponding maximum shear stress is given here).
Samples (20×10×3 mm3) were extracted from the deformed blocks for cryo-EBSD
obser-152
vations (angular resolution of 0.7◦, spatial resolution of 5 and 20 µm for this study). The
153
torsion samples were cut perpendicular to the radius, as close as possible to the external
154
side of the cylinder. Appropriate adjustment of the vacuum and temperature (1 Pa and
155
-100◦C) to reduce sublimation was made following Montagnat et al. (2015). This allowed
156
EBSD mapping of the entire selected areas with indexation rates higher than 85%.
157
At the compression and shear strains reached, dynamic recrystallization mechanisms such
158
as nucleation at triple junctions, highly misoriented subgrain boundaries and kink bands are
observed as in Chauve et al. (2017). In the compression sample analyses we focused on grain
160
boundaries and triple junction areas. “Typical” dislocation substructures are presented in
161
figures 1 and 2. Similar features were observed in the torsion samples. In these samples,
162
we analyzed larger areas in order to obtain statistical information about the nature of the
163
dislocations involved in the observed substructures.
164 165
In order to characterize the dislocations involved in the formation of subgrain boundaries,
166
we used WBV analyses following Wheeler et al. (2009) (see Appendix A for a detailed
de-167
scription). The WBV represents the sum over different dislocation types of the product of
168
[(density of intersections of dislocation lines within a selected area of the map) × (Burgers
169
vector)]. Each dislocation line crossing the EBSD surface contributes to the WBV but the
170
weight of this contribution depends of the angle between the dislocation line and the EBSD
171
surface. It is one (zero) if the dislocation line is perpendicular to (within) the EBSD surface.
172
The WBV analysis gives a vector which can be expressed in the crystal or sample reference
173
frame.
174
The WBV analyses were performed as (i) a point by point analysis that enables to plot
175
the WBV direction and magnitude along the dislocation substructures and (ii) an integral
176
WBV calculation of the net Burgers vector content of dislocations intersecting a given area
177
of a map by an integration around the edge of this area. The integral WBV calculated over
178
a given area is projected over the four non-independent lattice components of the
hexago-179
nal symmetry ([11¯20],[¯2110],[1¯210] and [0001] noted W BVa1, W BVa2, W BVa3, W BVc). This
180
integral WBV analysis complements the point-by-point WBV calculations and, due to the
181
integration over an area, reduces the noise level in the analysis (see Appendix A). In special
182
cases the integration also induces a loss of information. For instance, in the case of an integral
183
calculation over an area containing a perfect kink band, the resulting integral WBV will be
184
null if the two opposite tilt bands have similar misorientation angles.
185
The proportion of dislocations with a [c]-component Burgers vector (that includes dislocations
186
with [c] and < c + a > Burgers vectors, thereafter referred to as [c]-component dislocations)
187
in the subgrain boundaries is estimated as the ratio between the W BV c component over
188
the Euclidian norm of the WBV (|W BVc|/||WBV||), thereafter called rW BVc. For the
189
pixel-scale calculations, a cut-off value was defined in such a way to restrict the analysis to
190
sub-structures with a misorientation higher than 0.9◦, to remain slightly above the EBSD
191
resolution. This cut-off value transposed to the WBV norm depends on the EBSD step-size
192
since the WBV is calculated per unit length (1.4 × 10⁻³ µm−1 for 5 µm EBSD step size
193
and 3.5 × 10⁻⁴ µm−1 for 20 µm EBSD step size). Subgrain boundaries are distinguished by
194
selecting the pixels for which the norm of the WBV is higher than this threshold and lower
195
that the upper bound for a subgrain boundary set at 7◦ of misorientation (Chauve et al.,
196
2017). The cut-off value is coherent with the limit of accuracy of EBSD data and leads
197
to a good agreement with the subgrain boundary segmentation defined based on the local
198
misorientation only. By doing so, less that 1% of pixels are selected as ”sub-structures” in
199
the non deformed sample and the corresponding values of |W BVc|/||WBV|| are uniformly
200
distributed.
201
The WBV analyses are associated with classical measurements of the rotation axis of the
202
misorientation induced by the subgrain boundary (by making use of absolute orientations
203
from EBSD data) together with the orientation of the boundary trace. From this method
known as “boundary trace analysis” (Mainprice et al., 1993; Lloyd et al., 1997; Prior et al.,
205
2002; Piazolo et al., 2008), the boundary plane can be inferred. These information are used
206
as a visualisation tool in figure 2.
207
Finally, statistical analyses were performed by using a probability density function that
rep-208
resents the ratio between the number of pixels with a WBV norm higher than the threshold
209
(defined above) over the total number of pixels. It can be seen, for instance in figure 4,
210
that this ratio is small for the low torsion strain experiment. The pixels with a WBV norm
211
higher than the threshold are also separated as a function of the nature of the WBV, meaning
212
mostly composed of [c]-component dislocations, mostly composed of < a > dislocations, or
213
composed of a similar amount of both types of dislocations.
214
3. Experimental observations
215
We present first detailed observations of a few subgrain boundaries that illustrate the
216
techniques used to distinguish < a > from [c]-component Burgers vectors on GND
sub-217
structures, and then a global analysis performed over large-scale EBSD maps containing
218
hundreds of grains (from the torsion test samples), which aims at evaluating the statistical
219
significance of the dislocations with [c]-component Burgers vectors within the substructures.
220
Frequently observed subgrain structures in ice deformed by plasticity include “closed” shaped
221
subgrain boundaries (SGBs) formed in the vicinity of serrated grain boundaries (Fig. 1), in
222
areas where the microstructure is very heterogeneous. These “closed” shaped SGBs were
223
shown in (Chauve et al., 2017) to act as precursor of nucleation by strain induced boundary
224
migration (SIBM) and bulging. The superposition of the WBV data (projection of the WBV
225
on the sample plane and relative contribution of [c]-component dislocations, rW BVc) to the
226
trace of the SGBs (Fig. 1) highlights the complexity of the dislocation sub-structures and
227
the variability of the contribution of [c]-component Burgers vector dislocations (from almost
228
null to almost 1) in the different subgrain boundary segments.
229
The ”closed loop” substructure on the left side of figure 1 has been selected for a detailed
230
characterization (Fig. 2 and Table 2). It can be separated into three domains with distinct
231
WBV orientations. Two of them, domains 1 and 3, have WBV orientations pointing in two
232
opposite < m > (< 1¯100 >) axis directions. These two subgrains accommodate a rotation
233
around an axis parallel to the boundary plane (along < a > axes) but with opposite rotation
234
directions. Such a configuration, characteristic of two tilt-bands with opposite signs, forming
235
a kink band, is frequently observed in ice (Montagnat et al., 2011; Piazolo et al., 2015).
236
The subgrain boundary in domain 2 is characterized by a boundary plane that is
perpen-237
dicular to the ones of the SBGs from domains 1 and 3. However its rotation axis is also
238
parallel to an < a > axis and it is contained within the subgrain boundary plane. Subgrain
239
segment 3 is therefore also a tilt boundary. The WBVs are, this time, aligned along the [c]
240
axis and perpendicular to the rotation axis. This configuration cannot be explained without
241
an important contribution of edge dislocations with a [c]-component Burgers vectors. This
242
interpretation is confirmed quantitatively by the estimation of the integral WBV in the three
243
areas of interest (table 2). The relative contribution of the [c]-component dislocations, which
244
is estimated as the ratio rW BV c is shown to dominate in domain 2.
245 246
The torsion experiments provide samples deformed in simple shear in the range γ = 0.012
200 µm
0
|WBVc|/||WBV||1
x y
Figure 1: Serrated grain boundary observed in sample CI01. The ratio |W BVc|
||WBV|| (see text) and the WBVs
are plotted for the pixels where ||WBV|| is higher than 1.4 × 10⁻³ µm−1. The red arrows show the in-plane projections of the WBV direction (above a threshold of 1.4 × 10⁻³ µm−1, EBSD step size 5 µm).
Analyzed Integral WBV µm−2
area W BVa1 W BVa2 W BVa3 W BVc |W BVc|/||WBV||
1 −2.77 1.14 1.64 −0.12 0.03
2 −0.60 0.47 0.13 2.65 0.94
3 1.84 −1.02 −0.82 −0.16 0.06
Table 2: Integral WBV projections over the four non-independent axes of the hexagonal crystal symmetry and the ratio rW BVc(see Materials and Methods), calculated for the areas of sample CI01 selected in figure
2.
to 1.94, for which EBSD observations reveal a high density of subgrain boundaries (Fig.
248
3). For each sample, the local WBV analysis was performed over the entire mapped surface
249
(about 20×10 mm2). In figure 3a, data for the most deformed sample are plotted as a function
250
of the relative amount of [c]-component dislocations, rW BVc. This analysis highlights the
251
high frequency of subgrain boundaries with a high proportion of [c]-component dislocations
252
(yellow pixels in figure 3). The [c]-component dislocations are not confined to grain
bound-253
ary areas, as some subgrain boundaries in the central part of grains display non-negligible
254
contribution of [c]-component dislocations (Fig. 3c).
255
Similar analyses were performed on samples deformed up to different finite shear strains.
256
The resulting evolution of the relative occurrence of GNDs composed of [c]-component
dislo-257
cations with finite strain is presented in figure 4. Although the overall number of pixels with
258
a significant WBV magnitude increases significantly with strain, the ratio of substructure
259
composed of [c]-component dislocations remains stable. Except for the almost non-deformed
260
sample, which shows a higher proportion of [c]-component dislocations, about 65% of the
261
pixels belonging to substructures are made of < a > dislocations, whereas the substructures
262
containing [c]-component dislocations represent a non-negligible contribution of about 35%
263
(substructures with clear [c]-component dislocation dominant are 13%, those including
simi-264
lar proportion of < a > and [c]-component dislocations, 22%)
Upper Upper Upper Lower x y x y x y x y #2 #1 #3 50 µm 3 1 2 0 1 |WBVc| ||WBV|| <0001> = <c> <2-1-10> = <a> <01-10> = <m> WBV rotation axis boundary trace boundary plane x y basal plane
Figure 2: Weighted Burgers Vectors plotted over a zoomed area from the left side of figure 1, sample CI01. The colorscale gives the relative magnitude of [c]-component dislocations, rW BVc, and the red arrows show
the in-plane projection of the WBV directions (above a threshold of 1.4 × 10⁻³ µm−1, EBSD step size of 5 µm). ”Boundary plane” refers to ”inferred” boundary plane, see text. Rectangular areas mark the domains selected for integral WBV calculations (table 2).
500 µm Grain boundaries (>7°) Sub-grain boundaries (1°<θ<7°) 5 mm x y x y (a) (b) 0 |WBVc| 1 ||WBV|| relative to y-axis [0001] [1210] [1100] 5 mm 500 µm 1 mm 1 mm 1 mm 1 mm g1 g2 g1 g1 g2 g2 (c)
Figure 3: a) Ratio between the W BV c component over the norm of the full WBV (rW BVc) calculated at
the pixel scale on sample TGI04 deformed in torsion up to γ = 1.94. As EBSD step size is 20 µm, a cut-off value of 3.5 × 10⁻⁴ µm−1 was taken for ||WBV|| below which pixels are not considered in the calculation. b) Inverse Pole Figure color-coded EBSD image of the microstructure showing subgrain boundaries (in red) and grain boundaries (in black). c) Four small images to provide a focus on two illustrative cases, with the legend of respectively a) (left) and b) (right).
Another important observation is that at first sight, the presence of dislocations with a [c]-0 0.2 0.1 Prob abi lit y d en si ty f un ction
Total shear strain
γ=0.012 γ=0.2 γ=0.42 γ=1.94 48 % 27 % 25 % 65 % 23 % 12 % 64 % 23 % 13 % 65 % 22 % 13 % 0 1 1/3 2/3 |WBVc| ||WBV|| a >> c a c
~
a << cFigure 4: Distribution of pixels with a ||WBV|| higher than a threshold of (3.5 × 10⁻⁴ µm−1, EBSD step size of 20 µm). Evolution with torsion strain of the relative [c] and < a > components over the norm of the full WBV (|W BVc|/||WBV||)) for four distinct torsion creep tests.
266
component Burgers vector does not seem to be correlated with the orientation of the crystal.
267
To further test this point, orientation data at the pixel scale were correlated with the relative
268
amplitude of the WBV components. To do so, we selected data from the sample deformed
269
by torsion at γ = 0.42 (TGI03), since at this rather low shear strain the macroscopic texture
270
remains reasonably weak to provide a wide enough orientation range (Fig. 5).
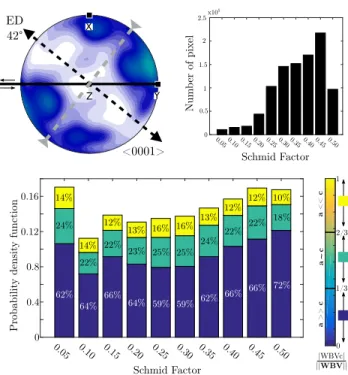
271
As performed in (Grennerat et al., 2012), an adapted Schmid factor, that does not account for
272
slip direction, is used to describe the pixel orientation relative to the imposed stress
configu-273
ration (S =p|σ.c|2− (c.σ.c)2, where σ is the stress tensor and c is the c-axis orientation).
274
The distribution of this Schmid factor (Fig. 5) reveals a slight under representation of
orien-275
tation with low Schmid factors, which may slightly bias the statistics. With this limitation in
276
mind, figure 5 gives an overview of the relative contributions of the different components of
277
the WBV as a function of the Schmid factor, and therefore as a function of the orientation of
278
the pixel. First, the density of substructures (evaluated by the density of pixels with a WBV
279
norm higher than the threshold) is similar independently of the crystallographic orientation.
280
The slight increase with Schmid factor must result from a statistical bias due to different
281
number of pixels analysed for each orientation range (see top of Fig. 5). Second, dislocations
282
with a [c]-component occur within similar proportions for every orientation. This statistical
283
analysis confirms that there is no clear relationship either between local orientation and the
284
density of GNDs, or between local orientation and the type of dislocations involved in the
285
GND substructures.
286 287
(11¯20) X 6 7 8 9 Y (10¯10) X Y Z (11¯20) X Y Z 0 1 2 3 4 5 6 7 8 9 (0001) X Y Z (1010) X Y Z (0001) Y (0001) Y X Z (11¯20) Y X Z ED 42° <0001> 0.05 0.10 0.15 0.20 0.25 0.3 00.350.40 0.45 0.50 Schmid Factor 0 0.5 1 1.5 2 2.5x10 5 Num ber of pi xel 0.05 0.10 0.15 0.20 0.25 0.3 0 0.35 0.40 0.45 0.50 0 0.4 0.12 0.16 Schmid Factor Prob abi lit y d en si ty f un ction 0.8 0 1 1/3 2/3 |WBVc| ||WBV|| a >> c a c ~ a << c 62% 24% 14% 64% 22% 14% 66% 22% 12% 64% 23% 13% 59% 25% 16% 59% 25% 16% 62% 24% 13% 66% 22% 12% 66% 22% 12% 72% 18% 10%
Figure 5: Distribution of the WBV dominant component as a function of the pixel orientation characterised by its adapted Schmid factor (S =p|σ.c|2− (c.σ.c)2, where σ is the stress tensor and c is the axis orientation),
from the sample TGI03 deformed in torsion up to γ = 0.42. Top: c-axis pole figure and distribution of Schmid factors. Bottom: Ratio of pixels with ||WBV|| higher than 3.5 × 10⁻⁴ µm−1 (EBSD step size of 20 µm). Each ratio is decomposed in 3 parts showing the dominant component of the WBV.
4. Discussion
288
From these results, one important observation can be emphasized. Dislocations in ice,
289
more specifically here GNDs, are clearly not composed solely by dislocations with < a >
290
Burgers vectors. A non negligible amount of dislocations with a [c] component in their
Burg-291
ers vectors contributes to the formation of subgrain boundaries in various configurations
292
(boundary conditions, strain levels...) under laboratory conditions.
293
Dislocations with a [c] component Burgers vector are theoretically energetically unfavourable,
294
and possess a Peierls barrier up to 10 times the one of < a > dislocations (Hondoh, 2000).
295
They require therefore a higher level of resolved shear stress to be activated. Previous work
296
on ice highlighted the link between local subgrain boundary development and local strain
297
and/or stress concentrations based on misorientation measurements associated with full-field
298
modeling approach (Montagnat et al., 2011; Piazolo et al., 2015), on direct comparison
be-299
tween strain field estimation by Digital Image Correlation and microstructure observations
300
(Chauve et al., 2015) and full-field modeling predictions (Grennerat et al., 2012). Based on
301
these recent works, we can assume that the combined effect of local redistribution of stress
302
due to strain incompatibilities between grains (Duval et al., 1983; Montagnat et al., 2011;
303
Piazolo et al., 2015) and the built up of dislocation fields and their associated internal stress
304
field (Chevy et al., 2012; Richeton et al., 2017) may produce local stresses that allow the
305
activation of non-basal slip systems or the glide of non-basal dislocations, and in particular
306
[c]-component dislocations as observed here. The assumed link between local stress
con-307
centrations and formation of GNDs is consistent with high-resolution EBSD measurements
recently performed on copper which show a correlation between high GND density and high
309
intragranular residual stresses, directly inferred from HR-EBSD (Jiang et al., 2015).
310
WBVs only capture part of the GNDs, which are, in turn, a fraction of the total
disloca-311
tion population. The total contribution of [c]-component dislocations may therefore differ
312
from the present estimations. Moreover, the GNDs populations observed on post-morten 2D
313
cryo-EBSD data might not be proportional to the population of glissile dislocations, that is,
314
representative of the relative activity of the slip systems, which are responsible for
deforma-315
tion. However they are responsible for the accommodation of stress heterogeneities through
316
their contribution to the formation of the subgrain boundaries. By the association of strain
317
measurements by DIC and microstructural observations, Chauve et al. (2015) demonstrated
318
that the formation of subgrain boundaries lead to a marked strain redistribution within a
319
polycrystal, which in the case of kink bands resulted in shear along the newly formed
bound-320
aries. GNDs act significantly during dynamic recrystallization by controlling nucleation by
321
SIBM for instance (Piazolo et al., 2015; Chauve et al., 2015). Last but not least, the internal
322
stress fields resulting from dislocation fields (Varadhan et al., 2006) can induce the activation
323
of mechanisms such as climb and cross-slip (Montagnat et al., 2006).. We therefore expect
324
GNDs to play a significant role during deformation at local and large scales.
325 326
All micro-macro modelling approaches applied to ice are so far based on drastic
assump-327
tions concerning the activated slip systems and on the mechanisms accommodating strain.
328
These assumptions are directly projected on the plasticity (or visco-plasticity) laws
describ-329
ing the dislocation glide and interactions during deformation. In most homogenization
ap-330
proaches (mean or full-field), plasticity is assumed to occur only through dislocation slip
331
on at least four independent slip systems, and their interactions are taken into account by
332
the critical resolved shear stresses which control the relative activities of the various slip
333
systems, and their evolution laws. These laws are generally adjusted based on
compari-334
son of the modelled macroscopic mechanical response with experimental results (Castelnau
335
et al., 1996, 2008; Suquet et al., 2012). These assumptions led to an unavoidable minimal
336
activation of non-basal slip which compensates for the lack of knowledge of accommodating
337
mechanisms (climb and cross-slip for instance), and the inability of the models to represent
338
them, except for a few attempts (Lebensohn et al., 2010, 2012). The non-basal activity, and
339
more specifically the fact that a minimum of pyramidal slip-system activity associated with
340
[c] dislocations is always necessary was, until now, not justified by any observations. Most
341
of these empirically adjusted parameters were used in further applications with, sometimes,
342
limited validation tests (Lebensohn et al., 2009; Montagnat et al., 2011; Grennerat et al.,
343
2012; Llorens et al., 2016).
344
The fact that we have observed for the first time a non-negligible contribution of [c]-component
345
dislocations to the GNDs population in ice polycrystals deformed in the laboratory provides
346
new constraints for modeling the deformation of ice. First, it gives a first order justification
347
for the introduction of the activity of pyramidal slip that requires [c]-component dislocations
348
into crystal plasticity laws. Indeed, Castelnau et al. (2008) and Suquet et al. (2012) both
349
highlighted the necessity of a minimum amount of pyramidal slip to correctly simulate the
350
behavior of ice polycrystals during transient creep by mean of full-field approaches. Secondly,
351
the present observations open the possibility for a direct comparison between model
predic-352
tions based on Dislocation Dynamics (Devincre et al., 2008) or Dislocation Field approaches
(Taupin et al., 2007, 2008; Richeton et al., 2017) and the actual distribution of < a > and
[c]-354
component dislocations in experimentally and naturally deformed ice samples as performed
355
in Richeton et al. (2017). Finally, it suggests the necessity to introduce secondary
mecha-356
nisms such as climb and cross-slip in the micro-macro approaches just mentioned, that is,
357
of simulating the complexity of dislocation interactions and assessing its impact on the
me-358
chanical behaviour.
359
Only recently attempts have been made to consider the long-range internal stress field
asso-360
ciated with dislocation substructures in crystal plasticity models (Taupin et al., 2007, 2008;
361
Richeton et al., 2017). These approaches, based on the elastic theory of continuously
dis-362
tributed dislocations account for the build up of GNDs and their transport during plasticity
363
but they are limited to multi-crystals with few grains (∼ 20) because of numerical costs.
364
The validation of these approaches could strongly benefit from an accurate description of the
365
nature of GNDs such as the one presented here. They could, in turn, provide constraints on
366
the internal stress field favorable for the activation of [c]-component dislocations.
367 368
Coupling detailed analyses of dislocation substructures, like the one presented here, with
369
such models, will produce a new generation of crystal plasticity laws which, when
imple-370
mented in micro-macro approaches coupled with large-scale flow models, will provide more
371
accurate estimations of the mechanical response of ice in the extreme conditions encountered
372
in natural environments. These large-scale models will be able to accurately represent the
373
texture evolution with strain and, hence, to take into account the mechanical anisotropy
374
associated with the texture evolution with deformation in ice sheets (Gillet-Chaulet et al.,
375
2006). These new plasticity laws will also be able to tackle complex boundary conditions as
376
the cyclic loading encountered in extraterrestrial bodies submitted to tidal forcing, as the
377
saturnian satellite Enceladus (Shoji et al., 2013).
378 379
5. Conclusions
380
The present study reveals for the first time the presence of a non-negligible (between 13%
381
and 35%) proportion of dislocations with [c]-component Burgers vector within dislocation
382
substructures in pure ice deformed in the laboratory at close to the melting temperature.
383
The characterization was made possible by the use of Weighted Burgers Vectors (WBV)
384
analyses that estimate the nature of geometrically necessary dislocations (GNDs) from
”rou-385
tine” EBSD measurements. This method is an alternative to classical techniques (X-ray
386
diffraction, TEM) to identify the Burgers vector components of the GNDs, which has proven
387
to be well adapted to the characterization of large, strongly deformed and recrystallized ice
388
samples.
389
The fraction of dislocations with [c]-component Burgers vector in substructures is similar for
390
various strain geometries and levels (compression or torsion creep, low to high strain). As
391
[c]-component dislocations are energetically less favourable and possess higher Peierls
bar-392
riers than < a > dislocations, they are expected in areas submitted to high local stresses.
393
Hence they should play an important role on the dislocation interactions during
deforma-394
tion (responsible for local hardening, internal stress field evolution), but also in the dynamic
395
recrystallization processes (nucleation and grain boundary migration) that strongly impact
microstructure and texture evolution in ice sheets. The present experimental evidence for
397
activation of [c]-component dislocations in ice is a first, but essential step for perfecting the
398
current crystal plasticity models and constraining the simulation of the role of these
disloca-399
tions on the mechanical response of ice. To be able to represent this complexity in the chain
400
of modeling tools that leads to the prediction of ice sheet and shelf flow is a step further
401
toward an accurate prediction of their evolution in the frame of global climate changes.
402 403
6. Acknowledgements
404
Financial support by the French Agence Nationale de la Recherche is acknowledged
405
(project DREAM, ANR-13-BS09-0001-01). This work benefited from support from
insti-406
tutes INSIS and INSU of CNRS. It has been supported by a grant from Labex OSUG@2020
407
(ANR10 LABEX56) and from INP-Grenoble and UJF in the frame of proposal called
Greno-408
ble Innovation Recherche AGIR (AGI13SMI15). Visiting exchanges for SP and MM were
409
financed by ESF RPN MicroDICE (08RNP003) and by CCFS visiting research funds. MM
410
benefited from a invited researcher fellowship from WSL, at SLF-Davos (2016-2017).
411
7. References
412
Bons, P. D., Jansen, D., Mundel, F., Bauer, C. C., Binder, T., Eisen, O., Jessell, M. W.,
413
Llorens, M.-G., Steinbach, F., Steinhage, D., Weikusat, I., 2016. Converging flow and
414
anisotropy cause large-scale folding in Greenland’s ice sheet. Nat Commun 7.
415
URL http://dx.doi.org/10.1038/ncomms11427
416
Bouchez, J. L., Duval, P., 1982. The fabric of polycrystalline ice deformed in simple shear :
417
experiments in torsion, natural deformation and geometrical interpretation. Textures and
418
microstructures 5, 171–190.
419
Castelnau, O., Canova, G. R., Lebensohn, R. A., Duval, P., 1997. Modelling viscoplastic
420
behavior of anisotropic polycrystalline ice with a self-consistent approach. Acta Materialia
421 45 (11), 4823 – 4834. 422 URL http://www.sciencedirect.com/science/article/B6TW8-3SPV0K1-1D/2/ 423 4d05120a0c90c52e1e4e3023faba79fb 424
Castelnau, O., Duval, P., Montagnat, M., Brenner, R., 2008. Elastoviscoplastic
micromechan-425
ical modeling of the transient creep of ice. Journal of Geophysical Research Solid Earth
426
113 (B11203).
427
Castelnau, O., Thorsteinsson, T., Kipfstuhl, J., Duval, P., Canova, G. R., 1996. Modelling
428
fabric development along the GRIP ice core, central Greenland. Ann. Glaciol. 23, 194–201.
429
Chauve, T., Montagnat, M., Barou, F., Hidas, K., Tommasi, A., Mainprice, D., 2017.
Inves-430
tigation of nucleation processes during dynamic recrystallization of ice using cryo-EBSD.
431
Phil. Trans. R. Soc. A 375, 20150345.
Chauve, T., Montagnat, M., Vacher, P., 12 2015. Strain field evolution during dynamic
433
recrystallization nucleation; a case study on ice. Acta Materialia 101, 116–124.
434
URL http://www.sciencedirect.com/science/article/pii/S1359645415006102
435
Chevy, J., Louchet, F., Duval, P., Fivel, M., 2012. Creep behaviour of ice single crystals
436
loaded in torsion explained by dislocation cross-slip. Phil. Mag. Let. 92 (6), 262–269.
437
Devincre, B., Hoc, T., Kubin, L., 2008. Dislocation Mean Free Paths and Strain Hardening
438
of Crystals. Science 320 (5884), 1745–1748.
439
URL http://www.sciencemag.org/cgi/content/abstract/320/5884/1745
440
Durand, G., Gillet-Chaulet, F., Svensson, A., Gagliardini, O., Kipfstuhl, S., Meyssonnier, J.,
441
Parrenin, F., Duval, P., Dahl-Jensen, D., Azuma, N., 2007. Change of the ice rheology with
442
climatic transitions. Implication on ice flow modelling and dating of the EPICA Dome C
443
core. Climates of the Past 3, 155–167.
444
Duval, P., Ashby, M., Anderman, I., 1983. Rate controlling processes in the creep of
poly-445
crystalline ice. J. Phys. Chem. 87 (21), 4066–4074.
446
Fleck, N., Muller, G., Ashby, M., Hutchinson, J., 1994. Strain gradient plasticity : theory
447
and experiment. Acta Metall. Mater. 42, 475–487.
448
Gillet-Chaulet, F., Gagliardini, O., Meyssonnier, J., Zwinger, T., Ruokolainen, J., 2006.
449
Flow-induced anisotropy in polar ice and related ice-sheet flow modelling. J.
Non-450
Newtonian Fluid Mech. 134, 33–43.
451
Grennerat, F., Montagnat, M., Castelnau, O., Vacher, P., Moulinec, H., Suquet, P., Duval,
452
P., 5 2012. Experimental characterization of the intragranular strain field in columnar ice
453
during transient creep. Acta Materialia 60 (8), 3655–3666.
454
URL http://www.sciencedirect.com/science/article/pii/S1359645412002054
455
Higashi, A., 1988. Lattice defects in ice crystals. Hokkaido University Press, Sapporo Japan.
456
Hondoh, T., 2000. Nature and behavior of dislocations in ice. In: Hondoh, T. (Ed.), Physics
457
of Ice Core Records. Sapporo: Hokkaido University Press, pp. 2–34.
458
Hutchinson, J., 1977. Creep and plasticity of hexagonal polycrystals as related to single
459
crystal slip. Metall. Trans. 8A (9), 1465–1469.
460
Jiang, J., Benjamin Britton, T., Wilkinson, A. J., 8 2015. Evolution of intragranular stresses
461
and dislocation densities during cyclic deformation of polycrystalline copper. Acta
Mate-462
rialia 94 (0), 193–204.
463
URL http://www.sciencedirect.com/science/article/pii/S1359645415002736
464
Kennedy, J. H., Pettit, E. C., L., D. P. C., 2013. The evolution of crystal fabric in ice sheets
465
and its link to climate history. Journal of Glaciology 59 (241), 357–373.
466
Kubin, L., Mortensen, A., 2003. Geometrically necessary dislocations and strain-gradient
467
plasticity: a few critical issues. Scripta materialia 48 (2), 119–125.
Lebensohn, R. A., Hartley, C. S., Tom´e, C. N., Castelnau, O., 02 2010. Modeling the
me-469
chanical response of polycrystals deforming by climb and glide. Philosophical Magazine
470
90 (5), 567–583.
471
URL http://dx.doi.org/10.1080/14786430903213320
472
Lebensohn, R. A., Holt, R. A., Caro, A., Alankar, A., Tom´e, C. N., 2012. Improved
consti-473
tutive description of single crystal viscoplastic deformation by dislocation climb. Comptes
474
Rendus M´ecanique 340 (4), 289–295.
475
URL http://www.sciencedirect.com/science/article/pii/S1631072112000484
476
Lebensohn, R. A., Montagnat, M., Mansuy, P., Duval, P., Meyssonnier, J., Philip, A.,
477
2009. Modeling viscoplastic behavior and heterogeneous intracrystalline deformation of
478
columnar ice polycrystals. Acta Materialia 57 (5), 1405 – 1415.
479
URL http://www.sciencedirect.com/science/article/B6TW8-4V9252Y-3/2/
480
c091590918643e4f9e7b480ce3cef3f4
481
Liu, F., Baker, I., 1995. Thermally induced dislocation loops in polycrystalline ice. Phil. Mag.
482
A 71, 1–14.
483
Llorens, M.-G., Griera, A., Bons, P. D., Lebensohn, R. A., Evans, L. A., Jansen, D., Weikusat,
484
I., 9 2016. Full-field predictions of ice dynamic recrystallisation under simple shear
condi-485
tions. Earth and Planetary Science Letters 450, 233–242.
486
URL http://www.sciencedirect.com/science/article/pii/S0012821X16303326
487
Lloyd, G. E., Farmer, A. B., Mainprice, D., 1997. Misorientation analysis and the formation
488
and orientation of subgrain and grain boundaries. Tectonophysics 279 (1), 55–78.
489
URL http://www.sciencedirect.com/science/article/pii/S0040195197001157
490
Ma, Y., Gagliardini, O., Ritz, C., Gillet-Chaulet, F., Durand, G., Montagnat, M., 2010.
491
Enhancement factors for grounded ice and ice shelves inferred from an anisotropic ice-flow
492
model. Journal of Glaciology 56 (199), 805–812.
493
Mainprice, D., Lloyd, G. E., Casey, M., 1993. Individual orientation measurements in quartz
494
polycrystals: advantages and limitations for texture and petrophysical property
determi-495
nations. Journal of Structural Geology 15 (9), 1169–1187.
496
URL http://www.sciencedirect.com/science/article/pii/0191814193901624
497
Montagnat, M., Blackford, J. R., Piazolo, S., Arnaud, L., Lebensohn, R. A., 2011.
Measure-498
ments and full-field predictions of deformation heterogeneities in ice. Earth and Planetary
499 Science Letters 305 (1-2), 153 – 160. 500 URL http://www.sciencedirect.com/science/article/B6V61-52G1S1V-3/2/ 501 9c22100ee12109d27e843354e8caa75b 502
Montagnat, M., Castelnau, O., Bons, P. D., Faria, S. H., Gagliardini, O., Gillet-Chaulet,
503
F., Grennerat, F., Griera, A., Lebensohn, R. A., Moulinec, H., Roessiger, J., Suquet, P.,
504
4 2014. Multiscale modeling of ice deformation behavior. Journal of Structural Geology
505
61 (0), 78–108.
506
URL http://www.sciencedirect.com/science/article/pii/S0191814113000837
Montagnat, M., Chauve, T., Barou, F., Tommasi, A., Beausir, B., Fressengeas, C., 2015.
508
Analysis of dynamic recrystallization of ice from EBSD orientation mapping. Frontiers in
509 Earth Science 3 (81). 510 URL http://www.frontiersin.org/cryospheric_sciences/10.3389/feart.2015. 511 00081/abstract 512
Montagnat, M., Weiss, J., Chevy, J., Duval, P., Brunjail, H., Bastie, P., Gil Sevillano,
513
J., 2006. The heterogeneous nature of slip in ice single crystals deformed under torsion.
514
Philosophical Magazine 86 (27), 4259–4270.
515
Obbard, R., Baker, I., Sieg, K., 2006. Using electron backscatter diffraction patterns to
516
examine recrystallization in polar ice sheets. Journal of Glaciology 52 (179), 546–557.
517
Oguro, M., Higashi, A., 09 1971. Concentric dislocation loops with [0001] Burgers vectors in
518
ice single crystals doped with NH3. Philosophical Magazine 24 (189), 713–718.
519
URL http://dx.doi.org/10.1080/14786437108217043
520
Pantleon, W., 2008. Resolving the geometrically necessary dislocation content by
conven-521
tional electron backscattering diffraction. Scripta Materialia 58 (11), 994 – 997.
522
URL http://www.sciencedirect.com/science/article/pii/S1359646208000912
523
Piazolo, S., Montagnat, M., Blackford, J. R., 2008. Sub-structure characterization of
exper-524
imentally and naturally deformed ice using cryo-EBSD. Journal of Microscopy 230 (3),
525
509–519.
526
Piazolo, S., Montagnat, M., Grennerat, F., Moulinec, H., Wheeler, J., 5 2015. Effect of local
527
stress heterogeneities on dislocation fields: Examples from transient creep in polycrystalline
528
ice. Acta Materialia 90 (0), 303–309.
529
URL http://www.sciencedirect.com/science/article/pii/S1359645415001615
530
Prior, D. J., Wheeler, J., Peruzzo, L., Spiess, R., Storey, C., 2002. Some garnet
microstruc-531
tures: an illustration of the potential of orientation maps and misorientation analysis
532
in microstructural studies. Journal of Structural Geology 24 (6-7), 999 – 1011, micro
533
structural Processes: A Special Issue in Honor of the Career Contributions of R.H. Vernon.
534
URL http://www.sciencedirect.com/science/article/B6V9D-458WFD3-2/2/
535
3cb45b2c164c23c3fdae838da879e0e2
536
Richeton, T., Le, L., Chauve, T., Bernacki, M., Berbenni, S., Montagnat, M., 2017. Modelling
537
the transport of geometrically necessary dislocations on slip systems: application to
single-538
and multi-crystals of ice. Modelling and Simulation in Materials Science and Engineering
539
25 (2), 025010.
540
URL http://stacks.iop.org/0965-0393/25/i=2/a=025010
541
Shearwood, C., Withworth, R., 1989. X-ray topographic observations of edge dislocation
542
glide on non-basal planes in ice. J.Glaciol. 35 (120), 281–283.
543
Shoji, D., Hussmann, H., Kurita, K., Sohl, F., 2013. Ice rheology and tidal heating of
Ence-544
ladus. Icarus 226 (1), 10 – 19.
545
URL http://www.sciencedirect.com/science/article/pii/S0019103513002042
Suquet, P., Moulinec, H., Castelnau, O., Montagnat, M., Lahellec, N., Grennerat, F., Duval,
547
P., Brenner, R., 2012. Multi-scale modeling of the mechanical behavior of polycrystalline
548
ice under transient creep. Procedia IUTAM 3, 76–90.
549
URL http://www.sciencedirect.com/science/article/pii/S2210983812000077
550
Taupin, V., Richeton, T., Chevy, J., Fressengeas, C., Weiss, J., Louchet, F., Miguel, M.,
551
2008. Rearrangement of dislocation structures in the aging of ice single crystals. Acta
552 Materialia 56 (7), 1555 – 1563. 553 URL http://www.sciencedirect.com/science/article/B6TW8-4RR217B-1/2/ 554 5689f7454a1fb98e258daa4f24dcd1df 555
Taupin, V., Varadhan, S., Chevy, J., Fressengeas, C., Beaudoin, A. J., Montagnat, M., Duval,
556
P., Oct 2007. Effects of size on the dynamics of dislocations in ice single crystals. Phys.
557
Rev. Lett. 99 (15), 155507.
558
Van der Giessen, E., Needleman, A., 2003. GNDs in nonlocal plasticity theories: lessons from
559
discrete dislocation simulations. Scripta materialia 48 (2), 127–132.
560
Varadhan, S., Beaudoin, A., Fressengeas, C., 2006. Coupling the dynamic of statistically
561
distributed and excess dislocations. Proc. of Science SMPRI2005, 004, 1–11.
562
Weikusat, I., De Winter, D. A. M., Pennock, G. M., Hayles, M., Schneijdenberg, C. T. W. M.,
563
Drury, M. R., 2011a. Cryogenic EBSD on ice: preserving a stable surface in a low pressure
564
SEM. Journal of Microscopy 242 (3), 295–310.
565
URL http://dx.doi.org/10.1111/j.1365-2818.2010.03471.x
566
Weikusat, I., Miyamoto, A., Faria, S. H., Kipfstuhl, S., Azuma, N., Hondoh, T., 2011b.
Sub-567
grain boundaries in Antarctic ice quantified by X-ray Laue diffraction. Journal of
Glaciol-568
ogy 57 (57), 111–120.
569
Wheeler, J., Mariani, E., Piazolo, S., Prior, D. J., Trimby, P., Drury, M. R., 2009. The
570
weighted Burgers vector: a new quantity for constraining dislocation densities and types
571
using electron backscatter diffraction on 2D sections through crystalline materials. Journal
572
of Microscopy 233 (3), 482–494.
573
URL http://dx.doi.org/10.1111/j.1365-2818.2009.03136.x
574
Appendix A. The Weighted Burgers Vector tool
575
Dislocations produce local distortions in crystal lattices. When dislocations of different signs are close together these distortions balance out and are not visible at the scale of mi-crons. However when significant numbers of dislocations with the same signs are present, op-tically visible and (with EBSD) measurable variations of lattice orientation are a consequence the dislocations are then called geometrically necessary dislocations (GNDs). Crystalline ma-terials generally have large elastic moduli meaning that lattice bending due to elastic stress is likely to be small; significant curvature generally relates to the presence of GNDs. Nye (1953) recognized that the lattice curvature can be described by a second rank tensor (now
named after him), in general non-symmetric so having 9 independent components, and that this can be directly linked to the densities of GNDs and their line vectors.
αiγ =X N
ρNbNi lNγ (A.1)
where (N ) indicates the Nth type of dislocation line, and for each type ρ is the density
576
(m−2), bi the Burgers vector in crystal coordinates (m) and lγ the unit line vector in sample
577
coordinates. As written the first index in α relates to the crystal reference frame and the
578
second to sample reference frame and its units are m−1.
579 580
The idea is explained concisely in (Sutton and Balluffi, 1995). It provides in principle
581
a powerful way of constraining possible GND types from lattice curvature, although there
582
is not a unique way of deciding on dislocation types (lines and Burgers vectors) without
583
further information or assumptions. Using EBSD data from 2D maps only 3 out of the 9
584
components of the tensor can be unambiguously determined without further assumptions,
585
but Wheeler et al. (2009) argued that even these three can provide valuable insights into
586
possible dislocation types. Specifically the 3 components αi3 (where 3 indicates the sample
587
coordinate direction perpendicular to the map) make up a vector related to the Burgers
vec-588
tors of dislocations present. It is weighted with regard to the individual dislocation densities
589
(through ρ) and the angles the dislocation lines make to the EBSD map (through l3): hence
590
Weighted Burgers Vector (WBV). For hexagonal phases such as ice the WBV can indicate
591
the presence of vectors with a [c] component. Although the WBV does not record all the
592
GNDs present, it cannot contain phantom directions. If it has a significant [c] component
593
then at least some of the Burgers vectors of the GNDs must have a [c] component though
594
this does not mean they have to be parallel to [c]. Wheeler et al. (2009) give two versions of
595
the calculation.
596
1. In the differential form, local orientation gradients are used to calculate the WBV.
597
Errors are likely to be significant because of error-prone small misorientations, although
598
Wheeler et al. (2009) show how they may be mitigated by filtering out the shortest
599
WBVs. Adjacent measurement points with misorientations above a threshold value are
600
omitted from gradient calculations, so as to exclude high angle boundaries which lack
601
organised dislocation substructures. The magnitude and direction of the WBV can be
602
displayed on maps in a variety of ways. Given that the shortest WBVs are the most
603
error prone, the display may be chosen to show only those above a particular magnitude
604
(cf. Fig 3a).
605
2. In the integral form, contour integration round the edge of a region on an EBSD map
606
gives the net dislocation content of that region, though the spatial distribution of
607
dislocations (domains of high or low density) within the region are not constrained.
608
The advantage is that errors are lower. This was asserted in (Wheeler et al., 2009)
609
on the basis that numerical integration reduces the effects of noise, and has since
610
been demonstrated using model EBSD maps for distorted lattices with added noise.
611
The method rejects any regions with high angle boundaries intersecting the border,
612
using the threshold value mentioned above. The integral and differential methods are
613
complementary and are built on the same mathematical foundation (they are linked
614
via Stokes theorem).
In this contribution we discuss subgrain boundaries (SGBs). As happens in many
mate-616
rials, GNDs have moved by recovery into discrete structures. As these are two dimensional
617
features, with zero volume, then strictly the dislocation density is infinite. However the
inte-618
gral method still gives a rigorous measure of the dislocation content within a region, if that
619
region includes a subgrain boundary: Sutton and Balluffi (1995) show how closely the
anal-620
ysis of SGBs relates to the analysis of smoothly curved lattices. Hence the direction of the
621
integral WBV still carries useful information related to the GNDs in SGBs. We show colour
622
coded maps of the magnitude of the differential form of the WBV. When this is calculated,
623
numerical differentiation is used. Suppose we have two measurement points with 2.5◦
differ-624
ence in orientation separated by a 5 µm step size, then the calculated orientation gradient
625
will be 0.5◦ / µm. This may in reality be a smoothly curved lattice, or relate to a sharp
626
2.5◦ SGB passing between the two measurement points the method cannot distinguish such
627
possibilities. If it is an SGB then a smaller step size of 2.5 µm would give rise to an apparent
628
gradient of 1◦ / µm. Consequently around SGBs the magnitude of the WBV depends on
629
step size (and hence should be interpreted with caution) but the direction can still be used
630
to constrain GND types.
631
The disadvantages of the WBV approach are: it is less precise than calculations using high
632
(angular) resolution EBSD (Wallis et al. 2016), it is biased towards dislocation lines
inter-633
secting the EBSD map at a high angle, and it does not give a decomposition of the GND
634
population into different dislocation types. The latter can be attempted by making
particu-635
lar assumptions about the dislocation types present and then making a calculation assuming
636
total dislocation energy is minimised. As argued in Wheeler et al. (2009), though,
minimis-637
ing energy without taking into account elastic interactions between dislocations (which will
638
mean that line energies are not simply additive) may not be an appropriate procedure.
639
The advantages of the WBV are: it can be calculated from routinely collected EBSD data,
640
in a way free from assumptions except that the elastic strains be small. The integral form
641
reduces the propagation of errors inherent in Kikuchi pattern indexing, and can be used to
642
analyse both smoothly curved lattices and SGBs, without any assumptions about twist or
643
tilt nature. As this contribution shows the WBV approach is sufficient to test the hypothesis
644
that dislocations with [c] component Burgers vectors in ice form a significant part of the
645 dislocation substructures. 646 647 References - Appendix 648 649
Nye, J., 1953. Some geometrical relations in dislocated crystals. Acta Materialia 1,
650
153162.
651
Sutton, A. P., Balluffi, R. W., 1995. Interfaces in crystalline materials. Clarendon Press.
652
Wheeler, J., Mariani, E., Piazolo, S., Prior, D. J., Trimby, P., Drury, M. R., 2009. The
653
weighted Burgers vector: a new quantity for constraining dislocation densities and types
654
using electron backscatter diffraction on 2D sections through crystalline materials. Journal
655
of Microscopy 233 (3), 482494.
656
Wallis, D., Hansen, L. N., Britton, T. B., Wilkinson, A. J., 2016. Geometrically necessary
657
dislocation densities in olivine obtained using high-angular resolution electron backscatter
658
diffraction. Ultramicroscopy 168, 3445.
659 660