HAL Id: hal-00299146
https://hal.archives-ouvertes.fr/hal-00299146
Submitted on 11 Feb 2005
HAL is a multi-disciplinary open access
archive for the deposit and dissemination of
sci-entific research documents, whether they are
pub-lished or not. The documents may come from
teaching and research institutions in France or
abroad, or from public or private research centers.
L’archive ouverte pluridisciplinaire HAL, est
destinée au dépôt et à la diffusion de documents
scientifiques de niveau recherche, publiés ou non,
émanant des établissements d’enseignement et de
recherche français ou étrangers, des laboratoires
publics ou privés.
Acoustic module of the Acquabona (Italy) debris flow
monitoring system
A. Galgaro, P. R. Tecca, R. Genevois, A. M. Deganutti
To cite this version:
A. Galgaro, P. R. Tecca, R. Genevois, A. M. Deganutti. Acoustic module of the Acquabona (Italy)
debris flow monitoring system. Natural Hazards and Earth System Science, Copernicus Publications
on behalf of the European Geosciences Union, 2005, 5 (2), pp.211-215. �hal-00299146�
European Geosciences Union
© 2005 Author(s). This work is licensed under a Creative Commons License.
and Earth
System Sciences
Acoustic module of the Acquabona (Italy) debris flow monitoring
system
A. Galgaro1, P. R. Tecca2, R. Genevois1, and A. M. Deganutti2
1Department of Geology and Geophysics, University of Padova, Padova, Italy 2CNR-IRPI, C. so Stati Uniti 4, Padova, Italy
Received: 5 May 2004 – Revised: 9 December 2004 – Accepted: 16 December 2004 – Published: 11 February 2005 Part of Special Issue “Ground vibrations measurements and debris flow discharge estimates (Acquabona, Italy)”
Abstract. Monitoring of debris flows aimed to the
assess-ment of their physical parameters is very important both for theoretical and practical purposes. Peak discharge and to-tal volume of debris flows are crucial for designing effective countermeasures in many populated mountain areas where losses of lives and property damage could be avoided.
This study quantifies the relationship between flow depth, acoustic amplitude of debris flow induced ground vibra-tions and front velocity in the experimental catchment of Acquabona, Eastern Dolomites, Italy. The analysis of data brought about the results described in the following. Debris flow depth and amplitude of the flow-induced ground vibra-tions show a good positive correlation. Estimation of both mean front velocity and peak discharge can be simply ob-tained monitoring the ground vibrations, through geophones installed close to the flow channel; the total volume of de-bris flow can be so directly estimated from the integral of the ground vibrations using a regression line. The application of acoustic technique to debris flow monitoring seems to be of the outmost relevance in risk reduction policies and in the correct management of the territory. Moreover this estima-tion is possible in other catchments producing debris flows of similar characteristics by means of their acoustic charac-terisation through quick and simple field tests (Standard Pen-etration Tests and seismic refraction surveys).
1 Introduction
Monitoring of debris flows aimed to the assessment of their physical parameters is very important both for theoretical and practical purposes. Peak discharge and total volume of debris flows are crucial for designing effective counter-measures in many populated mountain areas where losses of lives and property damage could be avoided. Different types of sensors systems designed both for debris flow
de-Correspondence to: P. R. Tecca
(pia.tecca@irpi.cnr.it)
tection and warning, and for specific research purposes have been installed in Japan (Suwa and Okuda, 1985; Itakura et al., 2000), the Philippines (Marcial et al., 1996), Indonesia (Hadley, 1991; Lavigne et al., 2000), Columbia (LaHusen, 1996), China (Zhang, 1993) and Italy (Arattano et al., 1997; Genevois et al., 2000). In 1997 an automated monitoring sys-tem has been installed in the Acquabona channel (Dolomites, Eastern Italian Alps) aimed to the knowledge of the meteoro-logical and hydrogeometeoro-logical conditions leading to debris flow initiation, the dynamic properties of debris flow motion and deposition processes.
The aim of this study is to quantify the relationship be-tween flow depth, acoustic amplitude of debris flow induced ground vibrations and front velocity. Continuous geophone recordings find application not only for the measurement of front velocities but also for the estimation of debris flow dis-charge (Suwa et al., 2000). The study in the Acquabona catchment is still in progress; preliminary results presented here are based on data collected at one of the monitoring sta-tions during the event of 17 August 1998.
2 Study site
The Acquabona Creek is located on the left side of the Boite River Valley, near Cortina d’Ampezzo, in the Eastern Dolomites, Italy (Fig. 1). The upper rock basin is formed of Upper Triassic to Lower Jurassic massive dolomite and limestone cliffs. A thick talus covers the slope from the base of the rock-cliffs to the valley bottom; it consists of poorly sorted debris containing boulders up to 3—4 m in diameter and includes heterogeneous scree, alluvium and old debris flow deposits. The flow channel is deeply incised mostly into the talus, and its depth reaches more than 30 m in the inter-mediate part. In order to contain the debris discharged by the flows and protect the national road running downstream the Acquabona Creek, a retention basin was built at the channel outlet. The artificial embankment, made of the same debris material is about 4 m high.
212 A. Galgaro et al.: Ground vibrations measurements and debris flow discharge estimates
Fig. 1. Geological sketch and location of monitoring stations 1, 3 and 5.
Fig. 1. Geological sketch and location of monitoring stations 1, 3
and 5.
Table 1. Main morphometric parameters of Acquabona rock basin
and channel.
Rock basin area (km2) 0.30
Basin maximum elevation (m a.s.l.) 2667 Basin outlet elevation (m a.s.l.) 1650 Average rock basin slope (◦) 43
Channel length (m) 1632
Channel slope in the initiation area (◦) 30 Channel slope in the deposition area (◦) 7 Average channel slope (◦) 18
The main morphometric parameters of Acquabona basin and channel are listed in Table 1.
The ravine produces 1–2 debris flows per year during summer-early autumn season. Small flows, with total vol-umes generally less than 1000 m3, are triggered by rain-storms characterised by peak intensity of about 6 mm/10 min and total precipitation of 10–12 mm. Larger flows (more than 8–9000 m3) are triggered by intense localised rainstorms with higher peak intensity (more than 10–12 mm/10 min) and total precipitation (more than 30 mm).
Particle size analyses were carried out on the fraction finer than 20 mm of debris sampled in the initiation area, along the flow channel and in the deposition area (Fig. 2).
2.1 Monitoring system
The monitoring system is equipped with sensors for measur-ing rainfall, pore-water pressure in the mobile channel bot-tom, ground vibrations, debris flow depth, total normal stress and fluid pore-pressure at the base of the flow. Three video
Figure 2. Grain-size distribution of Acquabona debris. a: initiation area (5 samples); b: flow
channel (7 samples) and deposition area (3 samples).
0 100 20 40 60 80 100 10 1 0.1 0.01 0.001
Gravel Sand Silt Cl
P a ss in g ( % ) mm (log)
b
a
Fig. 2. Grain-size distribution of Acquabona debris. (a) initiation
area (5 samples); (b) flow channel (7 samples) and deposition area (3 samples).
Figure 3. Channel view of the monitoring station 3. A: antenna; SP: solar panel; G: geophone;
PT: pore pressure transducer; LC: load cell; US: ultrasonic sensor; VCZ: zenithal
videocamera.
Fig. 3. Channel view of the monitoring station 3. A: antenna; SP:
solar panel; G: geophone; PT: pore pressure transducer; LC: load cell; US: ultrasonic sensor; VCZ: zenithal videocamera.
cameras take motion picture of the events at the initiation zone, in the lower channel and in the deposition area.
The system is completely automated and remotely con-trolled, and consists of three on-site stations and an off-site station located 1.3 km from Acquabona site. The three on-site stations (Fig. 1) are located on the right debris channel bank. Continuous data acquisition is set up in two different modes: in pre-event mode, with a sampling rate of 0.011 Hz; an event mode, with a sampling rate of 5 Hz. Data from the on-site stations are radio-transmitted to an off-site station and stored in a host PC, from where they are telemetrically down-loaded and used by the Padova University for the study of debris flows.
2.2 Lower channel monitoring station
The measuring station 3 (Fig. 3) is set up near the middle of a 300 m straight reach of the lower channel, which has an average slope of 6◦.
An ultrasonic sensor and a video-recording system (com-posed of an analogical video-camera and a VCR) are
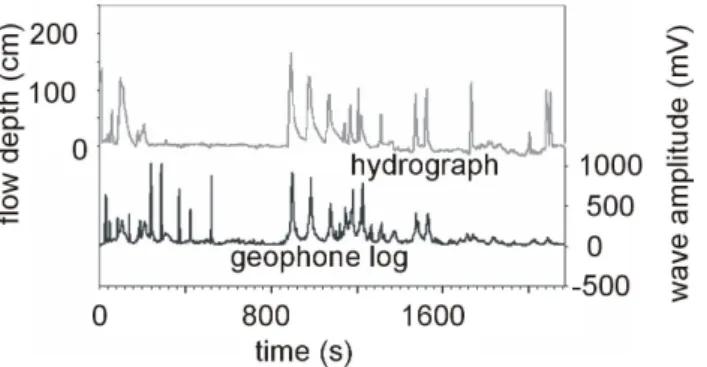
sus-Figure 4. Hydrograph and geophone logs of August 17, 1998 debris flow.
Fig. 4. Hydrograph and geophone logs of 17 August 1998 debris
flow.
pended on a rotating steel arm about 6.5 m above the channel bed. Four induction-type geophones are set along the chan-nel at a distance of 100 m from each other; geophone no. 3 is set up in correspondence of the ultrasonic sensor. The most suitable distance of the geophones from the channel axe has been chosen based on the results of a refraction seismic sur-vey carried out in the channel bed deposits as well as in the talus. The best performance was obtained in the range of 50– 130 Hz, at a distance of 10 m from the signal source. The sensors are induction geophones, sensitive to ground vibra-tions with a specific frequency of 10 Hz. Mean front velocity is calculated from the time interval between the passage of a single debris surge and the distance between the sensors considered.
A load cell and two pore pressure transducers complete the measuring system at station 3.
3 Methods
Among all debris flow data recorded at station 3, only geo-phone and ultrasonic recordings have been utilised for the present study.
3.1 Geophone recordings
Continuous geophone recordings are used to compute the mean front velocity of individual surges from the ratio of the travelled distance between two neighbour sensors to the elapsed time. The use of this kind of seismic sensors for debris-flow monitoring has been already analysed in Italy by Arattano (1999).
In order to choose the best location of the geophones, the velocities of seismic waves were measured in the channel bed deposits as well as in the talus by refraction seismic surveys. Obtained results have been compared with Standard Penetra-tion Test data carried out in order to detect the thickness of the loose bed material and its in situ relative density.
Standard Penetration Tests were executed in order to de-tect the depth of the loose bed material and to measure the in situ relative density of the material.
Figure 5. Acoustic amplitude vs flow depth.
Fig. 5. Acoustic amplitude vs. flow depth.
Moreover, using the same SPT instrumentation as seismic source it has been possible to characterise the ground re-sponse in terms of wave propagation velocities, energy prop-agation and attenuation. Recent superficial debris flow de-posits (3–4 m) at Acquabona site are characterised by max-imum wave velocity values of about 300 m/s, whilst more deep and compacted sediments show higher values (more than 400 m/s).
3.2 Ultrasonic logs
Hydrographs during the debris-flow propagation are obtained from the ultrasonic sensor, which has a reading range be-tween 0 and 10 m, with a resolution of 3 cm. The sensor measurements, calibrated on the base of laser topographic survey carried out before and after each event, provide the relationship between flow section area and flow depth.
4 Results and discussion
Data elaborated in this study are related to the debris flow recorded on 17 August 1998.
The ultrasonic sensor at station 3 recorded the passage of 16 surges over 40 min.
Figure 4 shows the debris-flow hydrograph and corre-sponding geophone log.
It can be observed that, although the flow-induced ground vibrations start a little bit before, their peaks occur at the same time of hydrograph peaks (Suwa et al., 2000).
Debris flow discharge is computed from the mean front velocity and the flow section area.
The amplitude of the flow-induced ground vibrations rep-resents the typical voltage response of the used geophones (10 Hz central frequence) with a circuit resistence of 1 KOhm; its values were obtained from the recorded geophone logs.
A linear relationship has been found between amplitude of flow-induced ground vibrations and flow depth of differ-ent surges (Fig. 5). Such a relationship may be then used to predict the flow depth of other debris flows occurring in other channels featuring similar characteristics, and giving
214 A. Galgaro et al.: Ground vibrations measurements and debris flow discharge estimates
Figure 6. Mean front velocity and discharge of 17.08.98 event.
Fig. 6. Mean front velocity and discharge of 17 August 1998 event.
the same ground response in terms of wave propagation ve-locities, energy propagation and attenuation.
Based on field survey, the considered flow section is trape-zoidal in shape, with the channel bed 3.5 m wide, and banks having a slope of 60◦. The bed scouring after the passage of the flow has proved negligible. Flow section areas have been evaluated by the flow depth values both measured by the ul-trasonic gauge and by the equation represented in Fig. 5.
d =0.13λ, (1)
where d is flow depth and λ is acoustic amplitude.
Mean translational velocities (Suwa et al., 1993; Ricken-mann, 1999) range between 2.00 and 7.7 m/s (Fig. 6) and the obtained values of debris flow peak discharge range from 4– 5 and 25–30 m3/s for both cross sections evaluation methods. The total volume of the debris flow has been computed by in-tegrating the discharge data of the recorded surges, obtained both by geophone logs (Fig. 6: acoustic) and ultrasonic hy-drographs (Fig. 6: US): volumes of 15 500 m3and 13 700 m3 have been obtained, respectively.
Peaks in the initial (200–600 s) and final (after 1600 s) phase have not been considered as they rise, respectively, from the acoustic interference of thunders and from differ-ent material transported by the debris flow tail.
5 Conclusions
Flow depth and debris flow-induced ground vibrations have been recorded during the debris flow of 17 August 1998 at Acquabona. Although the study is ongoing, the analysis of data brought about the following results:
– Debris flow depth and amplitude of the flow-induced
ground vibrations show a good positive correlation.
This correlation results from the fact that the larger the peak discharge the higher the acoustic wave ampli-tude is, as a consequence of the largest collision force of blocks and boulders on the channel banks and bed. An improvement of the estimation accuracy of the flow depth deduced from the output acoustic amplitude can be attained increasing the sampling frequency during acquisition, from 5 Hz to 5000 Hz. In such a way, it is possible to filter the signal and eliminate the noise (Itakura et al., 1997), discarding frequencies out of the range typical of a debris flow (from some Hz to around 100 Hz).
– Estimation of both mean front velocity and peak
dis-charge can be simply obtained from flow-induced ground vibrations; the total volume of debris flow can be so directly estimated from the integral of the ground vibrations using a regression line like that presented in this paper.
– Peak discharge and total volume of debris flows are
among the most important parameters for risk assess-ment and planning countermeasures. Since they can be estimated by the only monitoring of the ground vi-bration, through geophones installed close to the flow channel, the application of acoustic technique to debris flow monitoring seems to be of the outmost relevance in risk reduction policies and in the correct management of the territory. Moreover this estimation is possible in other catchments producing debris flows of similar char-acteristics by means of their acoustic characterisation through fast and simple field tests. The acoustic ampli-tude should be evaluated by means of seismic refrac-tion surveys using the SPT hammer as a seismic source so that the system of transmission of the energy to the ground is standardized. Measuring the vibrations re-sponse at the geophones array in different areas allow to compare different lithostratigraphical settings, normal-ize the acoustic amplitude and characternormal-ize the studied sites.
Edited by: M. Arattano
Reviewed by: Y. Itakura and L. Marchi
References
Arattano, M.: On the use of seismic detectors as monitoring and warning systems for debris flows, Natural Hazards, 20, 2–3, 197– 213, 1999.
Arattano, M., Deganutti, A. M., and Marchi, L.: Debris flow moni-toring activities in an instrumented watershed on the Italian Alps, Proc. 1st Int. Conf. on Debris-Flow Hazard Mitigation: Mechan-ics, Prediction and Assessment, San Francisco, USA, 7–9 August 1997, edited by: Chen, ASCE, New York, 506–515, 1997. Genevois, R., Tecca, P. R., Berti, M., and Simoni, A.:
Debris-flows in the Dolomites: Experimental data from a monitoring system, Proc. 2nd Int. Conf. on Debris-Flow Hazard Mitigation: Mechanics, Prediction and Assessment, Taipei/Taiwan/August
2000, edited by: Wieczorek and Naeser, Balkema, Rotterdam, 283–291, 2000.
Hadley, K. C. and LaHusen, R. G.: Deployment of an acoustic flow-monitor system and example of its application at Mount Pinatubo, EOS, Trans., American Geophysical Union, 72, 67, 1991.
Itakura, Y., Koga, Y., Takahama, J., and Nowa, Y.: Acoustic detec-tion sensor for debris flow. Proc. 1st Int. Conf. on Debris-Flow Hazard Mitigation: Mechanics, Prediction and Assessment, San Francisco, USA, 7–9 August 1997, edited by: Chen, ASCE, New York, 747–756, 1997.
Itakura, Y., Fujii, N., and Sawada, T.: Basic Characteristics of Ground Vibration Sensors for the Detection of Debris Flow, Phys. Chem. Earth (B), 25, 9, 717–720, 2000.
La Husen R.G.: Detecting debris flow using ground vibration. USGS Fact sheet 236-92, Open file, 1996.
Lavigne, F., Thouret, J. C., Voight, B., Young, K., LaHusen, R., Marso, J., Suwa, H., Sumaryono, A., Sayudi, D. S., and Dejean, M.: Instrumental lahar monitoring at Merapi Volcano, Central Java, Indonesia, J. Volcan Geotherm. Res., 100, 457–478, 2000.
Marcial, S., Melosantos, A. A., Hadley, K. C., LaHusen, R. G., and Marso, N.: Instrumental lahar monitoring at Mount Pinatubo, in: Fire and mud: eruptions and lahars of Mount Pinatubo, Philip-pines, edited by: Newhall, C. G. and Punongbayan, R. S., Wash-ington Press, Seattle, 1015–1022, 1996.
Rickenmann, D.: Empirical relationships for debris flows, Natural Hazards, 19, 47–77, 1999.
Suwa, H., Okunishi, K., and Sakai, M.: Motion, debris size and scale of debris flows in a valley on Mount Yakedake, Japan, Proc. of Sediment Problems: Strategies for Monitoring, Prediction and Control, Yokohama, IAHS, 217, 239–247, 1993.
Suwa, H. and Okuda, S.: Measurement of debris flows in Japan, Proc. IV Int. Conf. and Field Workshop on Landslides, August 1985, Tokyo, 391–400, 1985.
Suwa, H., Yamakoshi, T., and Sato, K.: Relationship between debris-flow discharge and ground vibration. Proc. 2nd Int. Conf. on Debris-Flow Hazard Mitigation: Mechanics, Prediction and Assessment, Taipei/Taiwan/August 2000, edited by: Wieczorek and Naeser, Balkema, Rotterdam, 311–318, 2000.
Zhang, S.: A comprehensive approach to the observation and pre-vention of debris flows in China, Natural Hazards, 7, 1–23, 1993.