HAL Id: hal-02136493
https://hal.archives-ouvertes.fr/hal-02136493
Submitted on 22 May 2019
HAL is a multi-disciplinary open access archive for the deposit and dissemination of sci-entific research documents, whether they are pub-lished or not. The documents may come from teaching and research institutions in France or abroad, or from public or private research centers.
L’archive ouverte pluridisciplinaire HAL, est destinée au dépôt et à la diffusion de documents scientifiques de niveau recherche, publiés ou non, émanant des établissements d’enseignement et de recherche français ou étrangers, des laboratoires publics ou privés.
Mélanie Davranche, Gérard Gruau, Aline Dia, Martine Bouhnik-Le Coz, Remi
Marsac, Mathieu Pédrot, Olivier Pourret
To cite this version:
Mélanie Davranche, Gérard Gruau, Aline Dia, Martine Bouhnik-Le Coz, Remi Marsac, et al.. Rare Earth Elements in wetlands. Trace Elements in Waterlogged Soils and Sediments, Taylor & Francis Group/CRC Press, pp.135-162, 2017, 978-1-4822-4051-1. �10.1201/9781315372952-9�. �hal-02136493�
1
Chapter 7 Rare Earth Elements in wetlands
Mélanie Davranche1, Gérard Gruau1, Aline Dia1, Martine Le Coz-Bouhnik1, Rémi Marsac2, Mathieu Pédrot1, Olivier Pourret3
1
:Géosciences Rennes UMR 6118, Université Rennes 1, CNRS, 35042 Rennes cedex, France 2: Institute of Technology, Institute for Nuclear Waste Disposal, D-76021 Karlsruhe, Germany 3 : Institut Polytechnique LaSalle Beauvais, 19, rue Pierre Waguet, 60026 Beauvais Cedex - France
I. Introduction 1
II. Rare earth elements analysis 6
II. 1. Analytical techniques 6
II.1.1. Quadrupole-Inductively coupled plasma- mass spectrometer measurements: Q-ICP-MS 6 II. 1.2. High-resolution or sector field inductively coupled plasma mass spectrometer measurements:
HR-ICP-MS or SF-ICP-HR-ICP-MS 9
II. 2. REE measurement in wetland soils, sediments and solution 9
II. 2.1. Sample pre-treatment 9
II. 2.2. Separation and speciation of Rare Earth Elements 10
II. 2.2.1. Ultra filtration systems 11
II. 2.2.2. CE-ICP-MS 11
II. 2.2.3. SEC-ICP-MS and FFF-ICP-MS. 12
III. REE in waterlogged soil and sediments 12
III. 1. REE signature of the solid fraction 14
III. 2. REE fingerprinting the paleoredoximorphic features in waterlogged soils 15
IV. Biogeochemical factors controlling REE signature in wetlands waters 17
IV. 1. Seasonal flooding and redox conditions 18
IV. 2. Colloidal control 22
IV. 3. Impact of biological parameters 25
IV. 4. Organic matter control 26
V. REE as probes of water circulation pathways and trace element sources 30
V. REE impact on the human health and environment quality 36
I. Introduction
In the periodic table, rare earth elements represent a group of 15 elements, specifically the lanthanides (Table 7.1). They are often referred to as REE and share common physiochemical properties and therefore often occur together as elemental constituents of their host minerals.
2
Table 7.1 Yttrium and lanthanide (REE) symbols, atomic weight, and ionic radius for
coordination number 6 (Shannon, 1976).
symbol Atomic Number (g mol-1) Ionic radius (Å) Yttrium Y 88.9 0.9 lanthanum La 138.9 1.03 cerium Ce 140.1 1.01 praseodymium Pr 140.9 0.99 neodynium Nd 144.2 0.98 promethium Pr smarium Sm 150.4 0.96 europium Eu 152 0.95 gadolimium Ga 157.2 0.94 terbium Tb 158.9 0.92 dysprosium Dy 162.5 0.91 holmium Ho 164.9 0.9 erbium Er 167.3 0.89 terbium Tb 168.9 0.88 ytterbium Yb 173 0.87 Lutetium Lu 175 0.86
The term “rare” is a carryover the metallurgical processes needed to isolate the individual metal species which are complex and low productive. As a result, lanthanide metals or metal oxides were difficult to obtain and are thus considered rare (Sonich-Mullin et al., 2013). Rare earth element form a coherent series of elements whose chemical properties display small but systematic changes with increasing atomic number. This chemical coherence is due to the gradual filling of their 4f electron shell. Because outer electrons (n = 5, 6) shield this inner shell, there are only minor differences in the chemical reactivity along the series (e.g., de Baar et al., 1991; McLennan, 1994). On the basis of their atomic number, REE are segregated into light (LREE) and heavy REE (HREE) with a division between Eu and Gd. Some authors distinguish middle REE (MREE) from Sm to Tb (e.g., Hannigan and Sholkovitch, 2001, Tang and
3 Johannesson 2003). This "weight" distinction is used to simplify the description and quantification of the inter-element relationship, typically ratios of normalized concentrations. Similarly, the anomalies of certain REE due to the Ce and Eu redox behavior, and the large anthropogenic emission of Gd are used to interpret geochemical processes.
Figure 7.1 REE patterns normalized using the UCC, NASC and PAAS references. In , a
negative Ce anomaly is illustrated
In aquatic systems, with regards to their slight solubility, REE concentrations are low compared to their concentration in rocks. Numerous studies suggest that the solution and interface chemistry are the major controlling factors of the REE concentration in aquatic systems (Goldstein and Jacobsen, 1988; Elderfield et al., 1990; Sholkovitz, 1995). In solution, an important chemical property is that REE can form strong complexes with a number of different ligands. In general, REE3+ ions prefer the donor atoms in the following order O>N>S. The resulting chemical species tend to form mainly ionic bonds with REE within their unoccupied lower high-energy orbitals (Weber, 2008).
1E-05 1E-04 La Ce Pr Nd Sm Eu Gd Tb Dy Ho Er Tm Yb Lu [R EE] n o rm a li ze d [REE]/UCC [REE]/NASC [REE]/PAAS
4 For the sake of convenience, the REE distribution in natural materials and water is usually illustrated by normalized REE patterns. Two geological reservoirs are used for the normalization, the upper continental crust and shales. The REE abundance is thereby normalized to the Post-Archean Australian Shale, PAAS (McLennan, 1989), North American shale composite, NASC (Gromet et al. 1984), or upper continental crust, UCC (Taylor et McLennan, 1985) (Table 7.1, Figure 7.1). A dominant systematic change is observed in the REE chemical properties, such as solution complexation, caused by the decrease in the ionic radius with an increasing atomic number. This change results in a systematic REE fractionation on the pattern called the "REE contraction". A normalized REE pattern allows for the recognition of an anomalous concentration for an individual REE as a positive or negative anomaly in an otherwise smooth pattern. This type of anomaly can occur in response to the redox behavior of Ce and Eu which can exist as a tetravalent or divalent state. Processes that convert Ce3+ to Ce4+ include biologically mediated oxidation (Moffett, 1990, 1994a, b) and abiotic oxidation on the surfaces of Mn oxides (Koeppenkastrop and De Carlo, 1992; Sholkovitz et al., 1994; Ohta and Kawabe, 2001). The reduction of Eu generally occurs at high temperatures and pressures, such as in hydrothermal fluids (e.g., Michard et al., 1983; German et al., 1990; Klinkhammer et al., 1994). The anomalous behaviors of Ce and Eu are quantified via Ce and Eu anomalies such as the Ce anomaly = 3CeN⁄(2LaN+ 2PrN) or 2CeN⁄(LaN+ PrN)) and the Eu anomaly = 2EuN⁄(SmN+ GdN)with N equal to the normalized abundance (Figure 7.1).
The REE pattern therefore results from the combination of several processes able to induce their fractionation. These processes are themselves controlled by several physicochemical mechanisms and parameters. In between, three processes can be distinguished: (i) precipitation/dissolution, (ii) sorption onto colloids and particles, and (iii) complexation in
5 solution with organic and inorganic ligands. The REE pattern therefore corresponds to the REE pattern for the mineral sources modified by the sorption/complexation constants of REE with ligands, colloids and particles. The result is highly diverse REE patterns that can be measured by a degree of depletion or enrichment relative to heavy REE (La/Yb or Sm/Yb ratios) or by whether or not anomalies are present.
Table 7.2 REE abundance in the various references used for the REE pattern normalization
UCC NASC PAAS
ppm mol. L-1 ppm mol. L-1 ppm mol. L-1
La 30 216.0 32 230.4 38.2 275.0 Ce 64 456.8 73 521.0 79.6 568.1 Pr 7.1 50.4 7.9 56.1 8.83 62.7 Nd 26 180.3 33 228.8 33.9 235.0 Sm 4.5 29.9 5.7 37.9 5.55 36.9 Eu 0.88 5.8 1.24 8.2 1.08 7.1 Gd 3.8 24.2 5.2 33.1 4.66 29.6 Tb 0.64 4.0 0.85 5.3 0.774 4.9 Dy 3.5 21.5 5.8 35.7 4.68 28.8 Ho 0.8 4.9 1.04 6.3 0.991 6.0 Er 2.3 13.8 3.4 20.3 2.85 17.0 Tm 0.33 2.0 0.5 3.0 0.405 2.4 Yb 2.2 12.7 3.1 17.9 2.82 16.3 Lu 0.32 1.8 0.48 2.7 0.433 2.5
The coherent physicochemistry of REE allows their abundances and fractionation in rock to be used as a tracer and fingerprint for cosmochemical, geodynamic and petrogenetic processes (e.g., Henderson, 1984; Taylor and McLennan, 1985). The decrease in the quantification limit for REE analytical techniques such as ICP-MS also offers the opportunity for REE patterns to be used as a tracer for processes occurring in hydrosystems (ocean, surface and groundwater) (e.g. Goldberg et al., 1963; Elderfield and Greaves,1982; De Baar et al., 1983; Byrne et Kim, 1990; German et al., 1991; Bau et al., 1997; Duncan and Shaw, 2004; Sholkovitz, 1993; Bau and Dulski, 1996; Dupré et al., 1996; Elbaz-Poulichet and Dupuy, 1999; Shiller et al., 2002; Fee et al., 1992; Möller and Bau, 1993; De Carlo and Green, 2002; Gammons et al., 2003; Johannesson
6 et al., 1995; 1996; 1997; Viers et al.,1997; Aubert et al., 2001; Janssen and Verweij, 2003). More specifically, REE fractionation patterns and abundances have been used to investigate the processes occurring in wetlands, such as the hydrology of the system, the mineral phases activated during water saturation, the trace element sources and the fine sorption processes occurring on wetland colloidal organic matter (Dia et al. 2000; Grybos et al. 2007, 2009; Pourret et al., 2007; 2010; Marsac et al., 2011; Davranche et al. 2011).
II. Rare earth elements analysis
II. 1. Analytical techniques
Rare earth elements are analyzed using several techniques such as NAA (neutron activation analysis) or TIMS (thermal ionization mass spectrometry). TIMS is a highly precise technique but this method requires laborious preparations. After acidic digestion, liquid column chromatography is used before analysis to separate REE from the solution. Since the 1990s, the development of ICP-MS (Inductively coupled plasma mass spectrometer) allows the direct determination of REE and thus became the most widely used technique. This method is used to introduce solutions with weak concentrations of REE while providing a low detection limit and is able to measure all REE simultaneously without any separation from the matrix.
II.1.1. Quadrupole-Inductively coupled plasma- mass spectrometer measurements: Q-ICP-MS
Ions produced in high temperature plasma are identified on the basis of the mass to charge ratio, m/z, which is characteristic of a given isotope. Each REE has at least one isotope that is free from isobaric overlap and the sensitivity is relatively uniform from 139La to 175Lu.
The major analytical problem encountered with Q-ICP-MS is the level of oxide formation in the plasma (Longerich et al., 1987; Jarvis et al., 1992) (Table 3). REE form a continuous group from
7 139 to 175 m/z, and the formation of light REE and barium oxide can produce significant middle REE interferences. In many cases, the LREE concentrations are higher than those for heavy REE, and the potential for interferences is increased. Refractory oxide ions are influenced by the plasma operating parameters. The oxide production level is close to 1 to 2%. The operating conditions are presented in Table 7.3. Mathematical corrections are required in order to suppress these spectroscopic interferences; these corrections are calculated as a function of the oxide level (Aries et al., 2000; Raut et al., 2005a, b). Previous studies have shown the importance of these corrections for accurate REE quantification. The choice of the measured isotopes and interferences that can be applied are summarized in Table 7.3.
Table 7.3 Preferred isotopes for REE analysis, isotopic abundance in %, oxides and hydroxides
interference on analyte. REE Element
Isotope Mass Abundance (%) oxide and hydroxide interferences
La 139 99.91
Ce 140 88.48
Pr 141 100
Nd 146 17.19
Sm 147-149 15 130BaOH
Eu 151-153 47.8-52.2 135BaO, 137BaO, 136 BaOH, Gd 157-158 15.65-24.84 142CeO,142NdO,141PrO, 141PrOH
Tb 159 100 143NdO Dy 163 24.9 147SmO, 146NdOH, Ho 165 100 149SmO Er 166 33.6 151EuO Tm 169 100 Yb 172-174 21.9-31.8 157GdOH Lu 175 97.41 159TbO
Table 7.4 Instrument operating conditions
Plasma conditions
RF Power 1450-1550W
Carrier Gas 15 L/min
Auxiliary argon flow 1 L/min
Nebulizer argon flow 0.9- 1.0 L/min
CeO+/Ce+ 1%
Ce2+/Ce+ <2 %
8 2% HNO3. The quality of the blanks is fundamental because the level of concentrations for this
technique is very low. Instrument drift is monitored and corrected by spiking each sample with an internal standard (In, Re, Rh, etc.) or by introducing it on-line using a peristaltic pump.
All of the experimental solutions used must be prepared with ultrapure analytical grade solution. Polyethylene and Teflon® vessels must have been previously decontaminated, and a clean room is recommended in order to obtain lower values for the blanks. The accurate and precise determination of the REE element concentration requires very low detection limits (DL). For the whole group of REE, the DL are typically between 0.01 and 0.1 ng mL-1. These values are presented in Table 7.5.
Table 7.5 Detection limits in ng L-1 (ppt), set values obtained on HP 7700x ICP-MS, calculated from the AFNOR standards and based on the blank measurement
Element Isotope Detection Limit (ppt) La 139 0.15 Ce 140 0.14 Pr 141 0.06 Nd 146 0.16 Sm 147 0.23 Eu 153 0.10 Gd 157 0.22 Gd 158 0.13 Tb 159 0.04 Dy 163 0.17 Ho 165 0.05 Er 166 0.15 Tm 169 0.04 Yb 174 0.17
ICP-MS analysis normally includes three consecutive replicate measurements, producing a repeatability error less than 2%. To control the quality of the REE element measurements, certificated reference material is necessary. SLRS-4 followed by SLRS-5 standards (National Research Council –CNRC Canada) distributed without certificated values of REE can be used to analyze fresh water and soil solutions. Several studies have published REE concentrations (Yeghicheyan et al. 2002 and 2013; Lawrence et al., 2006; Heimburger et al., 2013). For peat
9 and organic material, no references are available, and therefore geological standards (USGS or NIST) and plant references (NIST1515, 1573a, etc.) are used (Ferrat et al., 2012).
II. 1.2. High-resolution or sector field inductively coupled plasma mass spectrometer measurements: HR-ICP-MS or SF-ICP-MS
HR-ICP-MS (high-resolution sector mass spectrometer) is more sensitive than Q-ICP-MS. This technique is used to analyze the REE concentration with high precision in aqueous samples. HR-ICP-MS is able to eliminate or reduce interferences due to mass overlap. Typically, HR-HR-ICP-MS presents resolving powers for mass separation up to 10,000 and operates at preset resolution settings for low-, medium- or high-resolution.
To increase the precision of the REE measurements, a sample can be enriched with a pre-concentrated multi-spike REE solution, and the matrix can be removed using ion chromatography (Bakers et al., 2002; Rousseau et al., 2013). The level of the detection limit is very low, close to a pg L-1 (ppq) level.
II. 2. REE measurement in wetland soils, sediments and solution
II. 2.1. Sample pre-treatment
In water soil samples, the levels of the REE concentrations are close to the µg L-1 to ng L-1 level (ppb to ppt). These solutions are rich in organic matter and Fe. Water samples must be collected and filtered using 0.22 µm or 0.45 µm filters (cellulose acetate membrane filters) that have previously been decontaminated. The water is sampled in acid-washed polyethylene bottles and is immediately acidified after filtration with ultrapure HNO3 up to 2% to prevent iron oxide or
hydroxide precipitation. Acidified samples are stored at 4°C. The level of dissolved organic carbon (DOC) must be controlled, as a high concentration affects the ICP-MS analysis. For a
10 high DOC concentration, the sample must be treated in order to eliminate the organic matter, after an acidic digestion with a mix of HNO3 and H2O2 at 95°C on a hotplate or in a microwave
furnace, and thus the sample is entirely solubilized.
In wetland soil and sediment samples, the levels of the REE concentrations are close to the mg kg-1 to µg kg-1 (ppm to ppb) level. The organic-rich soil sample is dried at 20°C and then sieved at 2 mm. Dried soil samples (approximately 0.1-0.2g) are first digested in a HNO3 and HF mixture in Teflon® containers using hot plate or microwave autoclave protocols. Then, two acidic digestions are needed to remove the excess of HF, and sometimes a H2O2 treatment is
necessary. The dried residue is dissolved to a clear nitric acid solution (2%) for analysis. Finally, the sample is diluted by a factor ranging from 500 to 2000. The pre-treatment protocols are summarized in Figure 7.2.
Figure 7.2 Pretreatment protocol for REE analysis in wetland soils and water soil samples
II. 2.2. Separation and speciation of Rare Earth Elements
REE concentrations in wetland solutions are strongly associated with dissolved and colloidal organic matter (e.g. Dia et al., 2000; Grybos et al., 2007, Pédrot et al., 2008). The reactive fraction of this soluble organic matter is mainly comprised of humic substances (Fulvic Acid and
Water soil sample Sample collection Filtration 0.22µm or 0.45 µm acidification up to 2% HNO3 Digestion HNO3 –H2O2 Dilution Residue diluted in 2% HNO3 ICP-MS measurement
Dilution applied to a high concentration Weltland soil: sample collection Drying 20°C Sieving at 0.2mm Digestion: Step1: HNO3-HF Step 2: HNO3/H2O2 Hotplate; microwave Dilution: Residue diluted in HNO3 2%
11 Humic Acid), which are known to strongly bind metals and influence the sorption of trace metals onto the mineral surfaces (e.g. Avena and Koopal, 1998). It is therefore interesting to study and to precisely identify the distribution of REE in the different organic and inorganic fractions. Several technologies can be used to identify this distribution, such as capillary electrophoresis, field-flow fractionation and size exclusion coupled to ICP-MS or ultrafiltration systems.
II. 2.2.1. Ultra filtration systems
Ultrafiltration systems are used to study the control of organic-colloidals on metal partitioning in water samples. To separate the colloidal bound elements from the non-colloidal elements, ultrafiltration experiments can be performed using centrifugal tubes at different molecular cut-off sizes (Amicon Ultra Millipore®, Vivaspin Sartorius®, Macrosep Pall®, etc.) equipped with permeable membranes of decreasing pore size ranging from 30-20-15-10-5-3 or 2 kDa, with 1 Da = 1 g mol-1. Each centrifugal filter device must be washed prior to use, in order to remove the glycerin protecting the membranes. Blank tests must be performed to determine possible contaminations (DOC and REE elements). The centrifugation speed is approximately 3000-4000 g; this is a function of the choice of ultrafiltration cells. The temperature must be controlled during centrifugation and the length of time is determined from the experiment. According to the different cutoffs, REE-colloid complexes are retained by the ultrafiltration membrane while free ions and smaller complexes pass into the ultrafiltrate. The degree of metal– colloid complexation is usually determined from the metal concentration in the ultrafiltrate, relative to the original solution (e.g. Pourret et al., 2007; Pédrot et al., 2010; Vasuykovas et al., 2012).
II. 2.2.2. CE-ICP-MS
12 (ICP-MS) is used as a speciation tool in order to investigate the complexation of humic acids with trivalent REE. CE separates the elements with a short separation time; ICP-MS has an excellent elemental selectivity with a high sensitivity. The main advantage of this speciation method is the simultaneous detection of metal that is either complexed and not by humic acid in only one analytical run. CE-ICP-MS studies are able to identify free and complexed HA-REE species and qualify the ligand effect (Sonke and Salters, 2005; Stern, 2007, Kautenburger, 2014). II. 2.2.3. SEC-ICP-MS and FFF-ICP-MS.
SEC (size-exclusion chromatography) is usually used to separate natural organic matter over a column with a stationary phase using a porous gel material. The high molecular mass of the organic matter elutes first, followed by the smaller components. Coupled with UV detection and ICP-MS, SEC can be used to explore metal/organic matter complexation (Neubauer et al., 2013). The FFF (field-flow fractionation) technique determines the continuous size distribution of colloids without the disadvantage of the stationary phase. It determines the size and REE-composition of the distinct types of colloids, information that usually cannot be acquired from standard ultrafiltration. FFF-ICP-MS is used to characterize REE-binding to colloids (Stolpe et al., 2012; Neubauer et al., 2013).
III. REE in waterlogged soil and sediments
Waterlogged soils and sediments are probably one of the most striking investigated surface environments involving the use of REE as efficient tracers of processes and/or matter sources. Wetland and paddy soils are temporally or permanently flooded which involve the development of anoxic conditions and subsequent soil reduction. Both organic matter adsorption and Fe(III) oxyhydroxides reduction accompanying wetland soil flooding strongly control the mobility,
13 transfer and fate of REE in wetlands. (e.g. Grybos et al., 2007, 2009). Thereby, specific REE patterns that are displayed within these environments are related to the sources, but also to the prevailing reduction processes and associated organic matter and Fe dynamics.
Mihajlovic et al. (2014) who studied the REE distribution in wetland soil profile (Eutric Fluvisols, at the Wupper River, Germany) found very small differences between the total REE concentration and distribution between the different horizons as evidenced in Figure 7.3. Total REE concentrations and indicators of REE pattern fractionation (Eu/Eu*, Ce/Ce*, La/Yb ratio) do not evolve significantly. They explained these so small differences by the wetland soil flooding and the subsequent homogenization processes.
Figure 7.3 Evolution of the total REE concentration, LaUCC/YbUCC, Eu/Eu* and Ce/Ce* relative
to the different soil horizons (Ah1, Ah2, Ah3, Ah-Bg, C1, C2, Cq, C, WRB classification) in Eutric Fluvisols, at the Wupper River, Germany (Mihajlovic et al., 2014).
Sequential extractions that are performed on soils wetland generally show -whatever the protocol- that REE dominate in the residual fraction, followed by the reducible and the oxidizable fraction, the exchangeable fraction being very low (Leybourne and Johannesson, 2008; Pédrot et al., 2008; Davranche et al., 2011; Mihajlovic et al., 2014).
0 1 2 3
Ah1 Ah2 Ah-Bg1 Ah3 Ah-Bg2 C1 C2 Cq C3
T o ta l R E E , L a /Y b , C e /C e *, E u /E u *
Total REE La/Yb Ce/Ce* Eu/Eu*
14
III. 1. REE signature of the solid fraction
The REE patterns displayed by wetland soils or floodplain sediments could provide a large amount of information. The REE patterns of floodplain sediments taken from the Kaveri River basin (southern India) were discussed in terms of the REE behavior during sedimentary processes and as provenance tracers (Singh and Rajamani, 2001). As reported elsewhere (McLennan, 1989; Morey and Setterholm, 1997; Vital and Stattegger, 2000), this study clearly pointed out that fluvial sorting processes affect the REE distribution in the sediments. This type of physical sorting by fluvial processes could result in the accumulation of various minerals that are possibly enriched in REE. As a consequence, a REE-mediated provenance assessment study should be undertaken with sediments characterized by similar granulometric grades, because they would more closely reflect the source area (Singh and Rajamani, 2000). However, it should also be considered that a large amount of REE could be also present as surface coatings on grains in addition to those occurring within heavy minerals and clay minerals.
Paddy fields are usually distributed in flood plains along rivers and associated tributaries and valley floor plains incised by small rivers (Egashira et al., 1997; 2004), such as those occurring in the Mekong River. The REE content and associated patterns were studied, as well as the particle-size distribution and clay mineralogical composition, to estimate both the origin and fertility potentiality of the soil materials (Figure 7.4) (Egashira et al., 1997; Singh and Rajamani, 2000). The various REE patterns displayed in the paddy field samples along the Mekong River were divided into two groups establishing that the material origin was controlled by local composite materials and sediment carried by the Mekong River. This division was (i) confirmed through a mineralogical survey establishing differences in the origin and genesis of the soils, notably between the upper and lower areas, (ii) compared with indicators of soil potentiality such
15 as the exchangeable Ca or organic C content. However, conversely to samples recovered along the Mekong River (Egashira et al., 1997), unambiguously use of REE patterns was not possible to assess the t soil origins in floodplains of the Brahmaputra, Meghna and Ganges rivers in Bangladesh (Egashira et al., 2004). It is of prime importance to remember that whereas the REE composition in soils has mostly been considered as being inherited from the parent rock (Taylor and McLennan, 1984), given the low solubility and relative immobility of REE in the upper Earth’s crust, the environmental parameters and processes involved in soil formation cannot be neglected nor can the anthropogenic inputs (e.g. manure, phosphate fertilizers or waste effluents...) (Tsumura and Yamasaki, 1993; Yuan et al., 2001; Protano and Riccobono, 2002).
Figure 7.4 Chondrite-normalized REE patterns of a soil recovered in a low land of the Mekong
River floodplain in Laos (Egashira et al., 1997) and a sediment collected in the floodplain of the Kaveri River basin in southern India (Singh and Rajamani, 2001).
III. 2. REE fingerprinting the paleoredoximorphic features in waterlogged soils
Wetlands and paddy soils are at the heart of alternating redox processes induced by waterlogging associated with the occurrence of large amounts of organic matter responsible for leaching, Fe-oxide dissolution or precipitation as Fe-oxide coatings, concretions or amorphous organo-mineral
1E+00 1E+01 1E+02 1E+03 La Ce Pr Nd Sm Eu Gd Tb Dy Ho Er Tm Yb Lu [R E E ]/ C h o n d ri te Mekong Laos
16 colloidal phases.
Since both REE are strongly associated with Fe- and Mn-oxides and their fractionation is related to the drainage conditions, they are particularly interesting with regards to tracing the redox conditions, especially when considering Ce and Eu. However, all Eu fractionation must be precluded in the soils since the required reducing conditions that result in Eu reduction are far from the conditions possibly encountered within the soils (Bonnot-Courtois, 1981; Henderson, 1984; Panahi et al., 2000). By contrast, if the Eu anomaly cannot trace any redox processes occurring within the soils, the oxidation of Ce(III) to Ce(IV) can take place in soils, as previously established through field observations and experiments (Takahashi et al., 2000). This process results in the precipitation of the so-called cerianite (CeO2) coupled with the reduction of Mn(IV)
to Mn(III) on the surface of the Mn oxides (Ran and Liu, 1992; Bau, 1999; Ohta and Kawabe, 2001). Oxidative conditions allow for new Fe and Mn oxide precipitation preferentially incorporating Ce over REE, leading to the development of a positive Ce anomaly. Conversely, when reducing conditions prevail, notably during podzolisation, Fe-oxides are reduced by organic matter and Fe can be transferred within the organic complex, and then possibly precipitated again as ferrihydrite (Schwertmann and Fisher, 1973; Buurman and Jongmans, 2005; Sauer et al., 2007; Laveuf and Cornu, 2009). The newly precipitated Fe-rich phases might be enriched in HREE with regards to LREE, in response to the observed preferential transfer of HREE as organic complexes, but might also be enriched in MREE when the newly formed phases remain amorphous (Aubert et al., 2004). The dissolution of the Fe and Mn oxides, which releases all REE except Ce bound to cerianite, the dissolution of which is more dependent on pH than Eh, results in the persistence of the Ce anomaly, whereas Fe and Mn oxides disappear as shown by Koppi et al. (1996) in clayey areas bleached by flooding and drainage - and subsequent
17 degradation - in northern Australia. The Cerium anomaly resulting from cerianite precipitation could trace the redox processes (Koppi et al., 1996), keeping in mind that the relative contribution to the mobilization of REE that is made through redox conditions by primary minerals depends on both their initial proportion in the different pedological features possibly related to different redox processes, their relative mobilization during the redox process of concern, and their initial REE signatures (Laveuf et al., 2012).
IV. Biogeochemical factors controlling REE signature in wetlands waters
One of the critical questions concerning REE behavior in wetlands is whether REE concentrations are controlled by the sources or the physico-chemistry. Besides the specific characteristics of a specific site, it seems reasonable to state that the REE dynamics in the water– soil system depends on: (i) the fractionation characteristics of the host rock/sediment, III) the weathering process that might improve the dissolution of a mineral that is either depleted or enriched in REE, (ii) the water physicochemical characteristics (pH, Eh, organic and inorganic ligands, colloids/particles) and (iii) the water hydrodynamics. A systematic evolution in the REE pattern is thereby observed between the wetland soil/sediments and the soil solution or shallow groundwater. This evolution indicates that soil cannot be the one single factor controlling REE dynamics in wetland solutions (Figure 7.5). Several chemical and physical parameters either combined or not, have been advanced to explain this discrepancy.
18
Figure 7.5 (a) REE patterns for a solid peat sample and peat solutions from the Cotentin
marshland (France) (Auterives, 2007). (b) REE pattern for the uppermost soil horizon and its soil solution at various sampling dates from the riparian Le Home wetland (Brittany, France) (modified from Gruau et al., 2004). The peat and soil REE patterns are flat whereas the peat and wetland soil solution patterns exhibit a LREE depletion significant of a REE fractionation during their solubilization.
IV. 1. Seasonal flooding and redox conditions
In wetlands, redox conditions and their alternations are the main factors accounting for REE solubilization and mobilization in the environment. Many authors have therefore considered Mn and Fe-oxides reducing dissolution/precipitation as a major parameter controlling trace metal mobility in wetland soils (Charlatchka and Cambier, 2000; Chuan et al., 1996; Davranche et al., 2003; Francis & Dodge, 1990; Green et al., 2003; Quantin et al., 2001; Quantin et al., 2002). However, in the case of REE, Fe and Mn-oxides seem to just act indirectly. The gradual establishment of reducing conditions in wetlands results in the release of metals, either redox-sensitive or not, such as Fe or Mn, and Pb, Cd, etc. as well as a large concentration of dissolved/colloidal organic matter (fraction < 0.45 or 0.2 m). Several studies report positive
1E-06 1E-05 1E-04 La Ce Pr Nd Sm Eu Gd Tb Dy Ho Er Tm Yb Lu [R EE]/ U C C REE patterns of peat shallow groundwater 1E-05 1E-04 1E-03 La Ce Pr Nd Sm Eu Gd Tb Dy Ho Er Tm Yb Lu [R EE] /U C C REE patterns of uppermost soil solution 1E-02 1E-01 1E+00 La Ce Pr Nd Sm Eu Gd Tb Dy Ho Er Tm Yb Lu [R EE] /U C
C of peat solid REE patterns
samples 5E-01 5E+00 La Ce Pr Nd Sm Eu Gd Tb Dy Ho Er Tm Yb Lu [R EE ]/ U C C REE pattern of the uppermost soil horizon
19 correlations between Mn(II) and Fe(II) concentrations in wetland soil solutions and dissolved organic matter (DOC) (Hagedorn et al., 2000; Olivie-Lauquet et al., 2001; Gruau et al., 2004). Grybos et al. (2009) demonstrated that organic matter is mainly released as humic substances desorbed from soil minerals in response to the rise in pH caused by the reduction reactions (H+ consumption). They also reported that the colloidal fraction of this organic matter strongly bound a large range of metals including REE. They experimentally demonstrated that the REE speciation was entirely dominated by their binding with the dissolved/colloidal organic fraction of the soil solution. This strong binding of REE by organic matter has been confirmed by several field, experimental and modeling studies (Tang and Johannesson, 2003, Sonke and Salters, 2006; Pourret et al., 2007a-b, Stern et al., 2007; Pédrot et al., 2008, Kerr et al., 2008; Marsac et al., 2011). Using REE patterns as a tracer for REE sources in wetland soil, Davranche et al. (2011) demonstrated that soil organic matter was the main source of REE and trace metals during wetland soil reduction. Iron was mainly present in the soil as amorphous Fe(III)-nanoparticles, which are poor in REE and trace elements, embedded within the organic matter. Therefore, in permanently or temporarily flooded wetlands, the establishment of reducing conditions produces an increase in pH (H+ consumption by reductive reactions) which is responsible for the desorption of soil organic matter from the solid phases. This organic matter is solubilized with its metal loading constituted notably with REE (Grybos et al., 2007; Pourret et al., 2007; Pédrot et al., 2008; Shiller et al., 2010). During the flood period, REE are thus solubilized and transported to the hydrosystem mainly as organic colloidal phases. The flood period constitutes the major input of REE into hydrosystems. Shiller (2010) calculated that reducing conditions resulting from the spring flood of soil near the Loch Vale (Colorado, USA) led to an 8-fold increase in all REE concentrations. In the Amazon River main stream and its major tributaries surrounded by
20 many floodplains, the highest concentrations of REE are reported in winter during water saturation and when reducing conditions are established (Barroux et al., 2006). Tachikawa et al., (2003) calculated that during the high water season, the maximum Nd flux measurement is 1,277 t yr-1, constituting 30% of the required flux to the Atlantic Ocean. Shiller (2010) suggests that the seasonal flooding of wetlands may be an important regulator of REE concentrations in hydrosystems.
Under oxidizing conditions, in the low water season, the exported flux of REE is low and mainly controlled by the dynamics of the soil organic matter. Pourret et al. (2010) showed that REE speciation is controlled by colloidal organic matter present in wetland soil solution even under oxidizing conditions. In the same way, Dia et al. (2000) did not observe any significant evolution in the REE patterns in shallow groundwater from the Naizin wetland (Brittany, France) between periods of oxidized and reduced conditions. Figure 7.5 shows that Eh decreases and the Fe concentration increases in solution subsequent to the reductive solubilization of Fe(III). The establishment of the moderately reducing condition caused a rise in the dissolved REE concentration but without any drastic modification of the REE pattern (Figure 7.6). The speciation of REE in the shallow groundwater was therefore not significantly modified between the oxidized and reduced periods. Thus, REE are bound to the dissolved/colloidal organic matter present in the soil solution and shallow groundwater under oxidizing and reducing conditions
21
Figure 7.6 (a) Evolution of the REE pattern relative to time in shallow groundwater from the
Naizin wetland (Brittany, France), (b) Evolution of the Eh and Fe concentration indicating the establishment of moderately reducing conditions and the reductive dissolution of soil Fe oxides (Dia et al., 2000). Although the redox conditions became moderately reduced, the REE pattern was not significantly modified suggesting no drastic change in the REE speciation.
6E-09 6E-08 La Ce Pr Nd Sm Eu Gd Tb Dy Ho Er Tm Yb Lu [R EE]/ U C C 12/17/97 01/07/1998 1/14/98 1/21/98 02/03/1998 2/18/98 03/05/1998 3/17/98 04/01/1998 04/03/1998 04/08/1998 4/22/98 05/06/1998 5/20/98 Oxidizing period sligtly to moderately reducing period a) 0 100 200 300 400 500 0 4 8 12 16 Eh (m V)/ SH E [F e ] (p p m ) Fe Eh (mV) sligtly to moderatly reducing period Oxidizing period b)
22
IV. 2. Colloidal control
In wetland soil solution or shallow groundwater surrounded by wetlands, REE are closely associated with colloids. Studies performed on surface water that drains wetlands, wetland solution or shallow wetland groundwater from various type of boreal, tropical, Mediterranean or temperate wetlands, used an ultrafiltration analysis and various pore sizes to demonstrate that REE are mainly concentrated in the high molecular weight fraction, namely bound to the colloid phases (Viers et al., 1997; Dia et al., 2000; Tang and Johannesson 2003; Pourret al., 2007, Pédrot et al., 2008; Cidu et al., 2012; Vasyukova et al., 2012; Neubauer et al., 2013). If colloids are regarded as the main transfer and binding phases of REE in wetland solutions and waters, there is no real consensus on the nature of the REE carrier phases in the colloids themselves. The iron and organic matter phases are the major components of the colloids encountered and formed within wetlands or waterlogged soils. The term wetland covers a large diversity of areas that are subject to various hydrodynamic and climatic conditions which drastically influence the nature of the colloids released in solution. Andersson et al. (2006) demonstrated that in subarctic boreal rivers, draining organic-rich soils, two different REE colloid phases can be distinguished. During the sole spring flood, subsequent to soil saturation, small organic-rich colloids (3 nm) are released. By contrast, large Fe-rich colloids (12 nm) are formed during the winter and spring floods. Rare earth elements are bound to both C-rich and F-rich colloids. However, the amount of released REE is higher during the spring flood when organic-rich colloids are present. Moreover, the subsequent LREE-enriched REE pattern suggests that REE are released with the organic-rich colloids found in the litter of the organic-rich topsoil. In a temperate climate, in swamp water, speciation modeling and the voltammetric titrations all indicate that dissolved REE in the Great Dismal Swamp water are controlled by the REE complexation with natural
23 organic matter (Johannesson et al. 2004). Neubauer et al. (2013) applied Flow Field-Flow Fractionation analyses (FlowFFF) to water sampled in a small stream draining an unpolluted wetland (Tanner Moor) in Upper Austria to study the REE colloidal distribution. They showed that the REE size distribution corresponds to that of organic matter, namely that REE are bound to organic-rich colloids. Several authors, who studied temperate wetlands that are temporarily flooded from autumn until spring, have reached the same conclusions although they used different analyses or experimental methods (Pourret et al., 2007; Davranche et al., 2012). The controlling parameters for the REE distribution between organic and Fe-rich colloids probably does not account for climate or redox conditions. The same organic colloidal binding was demonstrated to dominate REE speciation in a humid tropical watershed in Cameroon (Viers et al., 1997; Braun et al., 1998). Pédrot et al. (2008), who performed leaching experiments on wetland soils under an oxidizing condition, provided evidence that REE speciation is dominated by their binding with organic colloids, such as under reducing conditions (Grybos et al., 2007). By contrast, it has been shown that REE patterns and therefore speciation in shallow groundwater along a catchment transect is strongly related to topography (Dia et al., 2000; Gruau et al., 2004; Pourret et al., 2010). These studies demonstrated that REE are mainly bound to colloids which are Fe enriched in the top of the catchment and organic-enriched in the bottom of the catchment where riparian wetlands are encountered (Pourret et al., 2010). The major feature of this evolution in the REE patterns is the decrease in the Ce anomaly with the topography. Pédrot et al. (2015) observed that this spatial variation is strongly correlated with the soil organic carbon/Fe ratio. They observed that for a low organic carbon/Fe ratio, the negative Ce anomaly amplitude in the soil solution is high, whereas for a high organic carbon/Fe ratio, the negative Ce anomaly is small or insignificant. They showed that REE pattern for soil Fe oxyhydroxides
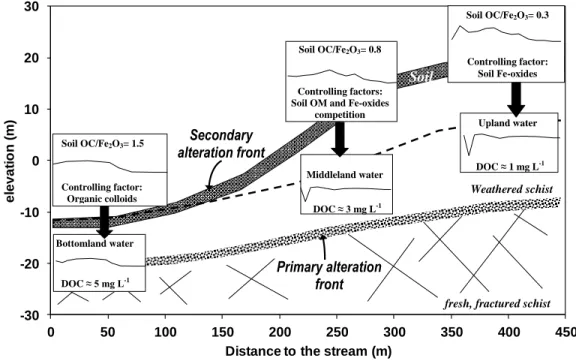
24 exhibited a positive Ce anomaly and HREE enrichment, indicating that in the upland, the REE signature may be sourced in the Fe-oxyhydroxides in the upper soil horizons. Iron oxides are, indeed, able to present this positive Ce anomaly with regards to their capacity to oxidize Ce(III) in Ce(VI) and preferentially trap Ce(IV) compared to the other REE(III) (Bau, 1999; Davranche et al., 2005). By contrast, in soil with a high organic carbon/Fe ratio, the REE patterns obtained under reducing conditions did not exhibit any Ce anomaly suggesting that in the bottomland, the REE signature is sourced in the organic carbon in the uppermost soil which is solubilized as organic colloids in the wetland soil solution. These mechanisms are summarized in Figure 7.7 Therefore in wetlands, the patterns, speciation and transfer of REE are mainly controlled by colloids. The composition of these colloids (organic or Fe-rich) is dependent on the wetland soil composition, and on the mechanisms that themselves control the formation and transfer of colloids in solution such as, for instance, hydrodynamic conditions.
Figure 7.7 Sketch summarizing the processes responsible for the topography-related REE
pattern in a theoretical catchment. In the top of the catchment, a negative Ce anomaly in the -30 -20 -10 0 10 20 30 0 50 100 150 200 250 300 350 400 450 e le v a ti o n ( m )
Distance to the stream (m)
fresh, fractured schist
Secondary alteration front
Soil OC/Fe2O3= 0.8
Controlling factors: Soil OM and Fe-oxides
competition Soil DOC ≈ 5 mg L-1 Bottomland water Weathered schist Primary alteration front Controlling factor: Organic colloids Soil OC/Fe2O3= 1.5 DOC ≈ 3 mg L-1
Middleland water DOC ≈ 1 mg L
-1
Upland water Soil OC/Fe2O3= 0.3
Controlling factor: Soil Fe-oxides
25 shallow groundwater is sourced in the presence of Fe-oxide in the uppermost soil although the REE pattern is controlled by the solubilization of organic colloids in the bottomland occupied by riparian wetlands.
IV. 3. Impact of biological parameters
Biological parameters could potentially influence the REE distribution in wetland waters through direct and indirect mechanisms. Several authors have demonstrated the ability of the bacterial cell surface to bind REE (Takahashi et al., 2005; 2010; Ngwenya et al., 2009; 2010). The resulting REE pattern exhibits a tetrad effect and a prominent enrichment in HREE (from Er to Lu). Based on EXAFS evidence and modeling calculations, this shape was further attributed to the binding of REE as inner sphere complexes with carboxylic and multiple phosphate sites occurring on the surface cells (Takahashi et al., 2010; Ngwenya et al., 2010; Martinez et al., 2014). Simpson et al. (2007) suggested that bacterially derived biomass could constitute more than 50 % of the total soil organic carbon in aerobic soils. However, in wetlands, with regards to the temporary or permanent saturation of the soil, the bacterial activity is low, the nitrate respiratory or Mn and Fe reduction is less energetic compared to the O2 respiratory in soil where
aerobic conditions prevailed. A direct consequence is that organic molecules are transformed into humic substances rather than been degraded. The proportion of bacterial biomass as compared to humic ligand is therefore potentially lower than 50%. Moreover, bacteria and cells residues have also to compete with the soil organic ligand present in high amounts for REE binding. Therefore, it is unlikely that REE binding by bacterial cells could account significantly for the REE pattern and distribution. Another mechanism that can be inferred in the REE behavior in wetlands is the mechanism used by plants. The absorption of REE by plants is low (Lima e Cunha et al., 2012). The REE concentration varied from 1 to 500 ppm depending on the
26 plant species, organs and soil concentration. However, the internal processes of plants can fractionated the REE (Ding et al., 2006; Lima e Cunha et al., 2009). For example, Ding et al. (2006) observed MREE enrichment in the roots and MREE and HREE enrichment in the leaves. These results suggest that the REE patterns observed in the wetland solution could potentially be inherited from their fractionation in wetland plants. However, further studies need to be carried out in order to confirm or dispel this hypothesis.
Therefore, the major biological mechanism that seems account significantly for the behavior and distribution of REE in wetlands is the indirect bioreduction of Mn(IV) and Fe(III) which is mediated by the bacteria consortium occurring in wetlands. The saturation of wetland soil with water promotes the use of Mn and Fe oxides as the e- acceptor by the bacteria for their growth. This reduction involves the concomitant dissolution of Mn and Fe oxides and the rise in pH which is responsible for the release of REE in solution.
IV. 4. Organic matter control
In wetland soil solution or shallow groundwater, REE are mainly associated with organic colloids. However, two types of REE patterns are generally observed, a MREE downward concavity (Figure 7.8a) and a HREE enrichment (Figure 7.8b). Pourret et al. (2007) experimentally demonstrated that the distribution coefficient (Kd) between REE and humic acid (HA) increases for MREE at pH < 7 and at high REE concentrations with respect to HA (figure 8a). Between pH values from 6 to 9 and with a low REE concentration in regards to HA, Sonke and Salters (2006) observed a regular increase from La to Lu, i.e. a “lanthanide contraction” (Figures 7.8b). Marsac et al. (2010, 2011) demonstrated that this discrepancy between both kinds of REE patterns is explained by the combined effect of the metal loading and the surface
27 heterogeneity of HA. At low loading, REE are complexed to strong but less abundant HA sites, namely phenolic and/or multidendate sites. The resulting REE pattern exhibits a lanthanide contraction. By contrast at high metal loading, REE are complexed to weak but more abundant HA sites, the carboxylic group. The resulting REE pattern exhibits a MREE downward concavity.
Figure 7.8 REE patterns in the dissolved fraction (< 0.2 m) of the organic-rich shallow groundwater from the (a) Kervidy Naizin wetland (France) (DOC ≈ 15 ppm) and (b) The Le Home-Pleine Fougère wetland (France) (DOC ≈ 27 ppm). Both REE patterns are different although the modeling calculations using Model VI and ultrafiltration analysis showed that REE are bound to colloidal organic matter at around 90% (Gruau et al., 2004; Pourret et al., 2007).
1,0E-11 1,0E-10 1,0E-09 La Ce Pr Nd Sm Eu Gd Tb Dy Ho Er Tm Yb Lu [R EE] /UCC Le Home-Pleine-Fougère Wetland 1,0E-11 1,0E-10 1,0E-09 La Ce Pr Nd Sm Eu Gd Tb Dy Ho Er Tm Yb Lu [R EE] /UCC Kervidy-Naizin a) b)
28 Humic acids can be regarded as a group of discrete sites. It is thus possible to compare HA binding properties with the binding properties of organic ligand models. The REE pattern corresponding to the binding of REE with acetate (carboxylic group) exhibits a MREE downward concavity whereas catechol and NTA (phenolic and chelate group) exhibit a lanthanide contraction effect corresponding to both REE-HA patterns obtained respectively at high and low metal loadings (Figures 7.8 and 7.9). Figure 7.9d plots the evolution of the log(K Lu-organic ligand /K La-organic ligand) relative to the average log K REE-organic ligand for the 101 organic ligands compiled by Byrne and Li (1995). This figure shows that when the ligand is stronger, HREE are more strongly bound to the ligand compared to LREE. This result is supported by infra-red spectroscopy findings demonstrating that HREE, compared to LREE, are preferentially bound to aromatic functional groups of organic matter such as phenolic sites (Gangloff et al., 2014).
29
Figure 7.9 Log K REE pattern with (a) acetate, (b) catechol and (c) NTA, and (d)
log(KLu-organic ligand/KLa-log(KLu-organic ligand) relative to the average log KREE-log(KLu-organic ligand for the 101 organic ligands compiled by Byrne and Li (1995).
In a second step, Marsac et al. (2011) used a modeling to provide evidence that HREE and LREE are not complexed to HA via the same functional sites. At high loading and acidic pH, LREE are bound to carboxylic groups and HREE to carboxylic and chelate groups. For circumneutral pH, LREE are bound to carboxylic groups and HREE via phenolic groups. The denticity of the REE-HA complex is also dependent on the metal loading (Marsac et al., 2011; 2014). More recently, Marsac et al. (2015) from EXAFS records suggest that at high loading, REE are bound to HA through bi-ligand complexes without any chelation effect in which REE act as cation bridge between two organic molecules whereas at low loading, REE are bound to HA via multi-carboxylic chelate ligands.
-1 0 1 2 3 4 5 0 5 10 15 20 25 L o g ( K L u /K L a ) Average log K 1.5 2 2.5
La Ce Pr NdSmEuGd Tb DyHo Er TmYb Lu
lo g K OH O Acetate 9 10 11 12 13 La Ce Pr NdSmEu Gd Tb Dy Ho Er TmYb Lu lo g K OH OH catechol 10 11 12 13 La Ce Pr Nd SmEu Gd Tb Dy Ho Er Tm Yb Lu lo g K NTA
30 Competition between cations in solution in terms of their binding to HA also appeared to be another important controlling factor for the REE pattern developed in organic-rich wetland solution and shallow groundwater (Tang and Johannesson, 2003; Marsac et al., 2012; 2013). In natural water, the HA metal loading is generally imposed by other dissolved metals, such as Fe and Al, which occur in much higher concentrations than REE. Marsac et al. (2012; 2013) demonstrated that (i) Fe3+ competes more strongly with HREE than LREE, whereas Fe species formed at higher pH values (i.e. FeOH2+ or Fe polymer) compete equally with LREE and HREE, and that (ii) Al3+ has the same competitive effect on REE-HA binding as Fe3+, but AlOH2+ competes mainly with LREE. Kohler et al. (2014) studied the mobilization of REE, Al, Fe and U in a boreal catchment. They demonstrated that organic matter controls their speciation in solution. However, the pH increases downstream from the catchment and involves the precipitation of Fe and Al as ferrihydrite and gibbsite, respectively. This selective removal of Al and Fe from the organic matter binding sites results in a higher La concentration downstream, namely a higher amount of La bound to colloidal organic matter present in the solution. Therefore the pH, which controls the chemical species of the competitor present in the solution, appears to drive this competition between trivalent cations and REE and the resulting REE pattern.
V. REE as probes of water circulation pathways and trace element sources
In recent years, REE have received much attention from hydrochemists because of their potential to be used as tracers or probes of water movement and water mixing (e.g. Smedley et al., 1991; Johannesson et al., 1997; Lawrence et al., 2006; Pourret et al., 2010; Siebert et al., 2012; Lu, 2014; Noack et al., 2014). In this respect, the discovery of a major difference in terms of the REE
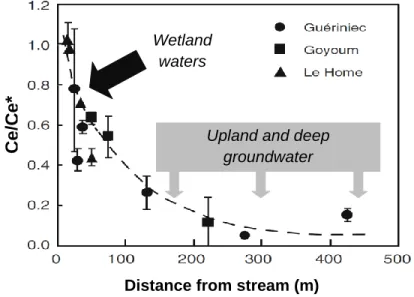
31 signatures between organic-rich, wetland waters, and organic-poor surrounding groundwater (see previous sections of this chapter) could be extremely useful in detecting the contributions of wetland waters to stream and river waters, or in determining groundwater circulation pathways at the catchment scale. The most significant and useful difference here could be the lack of a Ce anomaly that characterizes the REE patterns in wetland waters, and which can be used to differentiate these waters from the less organic-rich, deeper groundwater that most commonly display profound negative Ce anomalies (see compilations in Gruau et al., 2004 and Pourret et al., 2010) (Figure 7.10).
Figure 7.10 Strong difference in the negative Ce anomaly amplitude between wetland waters
(reduced or non-reduced negative Ce anomaly) and deep/upland ground waters (deep negative Ce anomaly) as revealed by data from three toposequences located in Europe (Gueriniec; Le Home) and Africa (Goyoum).
This spatial variation in the negative Ce anomaly amplitude, which was earlier shown in this chapter to be due to the essentially organic speciation of REE in wetland waters, provides the basis for using REE patterns as a probe of the occurrence of a wetland water component in streams and rivers, notably during high flow periods when wetland domains and rivers and streams often become hydrologically connected to each other. This principle is illustrated in
Distance from stream (m)
Ce
/C
e*
Upland and deep groundwater Wetland
32 Figure 7.11, which shows a conceptual model comparing high-flow and low-flow periods in a theoretical catchment developed on low-permeability basement rocks (e.g. shales or granites), and consisting of the juxtaposition of a poorly-drained bottomland domain (wetland area) and a well-drained upland domain. Because of the spatial difference in the Ce anomaly amplitude depicted in Figure 7.10, the model predicts that during low-flow periods, when most of the flow is expected to come from deep and upland groundwater because of the water table drawdown, REE patterns in stream waters should exhibit a deep negative Ce anomaly. By contrast, during high-flow periods, the connection between the wetland area and the stream induced by the rise in the water table should result in REE patterns showing much reduced negative Ce anomaly amplitudes.
This possibility of using the negative Ce anomaly amplitude as a probe to detect the occurrence of wetland water contributions in stream and river waters and to evaluate the temporal variability of this contribution has been tested in the Kervidy-Naizin catchment in western France, where extensive information exists regarding the spatial and temporal variability of the REE signatures in both organic-rich (wetland) and organic-poor groundwater (Gruau et al., unpublished). The test proved to be successful as the daily monitoring of the dissolved (< 0.22 m) REE concentrations during almost one entire hydrological year (1999-2000) revealed strong Ce anomaly amplitude fluctuations (Figure 7.12). Systematic reductions in the Ce anomaly amplitude were observed in phase with the stream discharge and increases in the DOC concentration (Figure 7.12); two features that are known to correspond to wetland water inputs into the stream of this catchment (Olivié-Lauquet et al., 2001; Morel et al., 2009).
33
Figure 7.11 How the Ce anomaly amplitude in stream and river waters could be used to detect
the contribution of a wetland water component and the possible temporal variability of this contribution.
Stream water
Wetland
Ce
Wetland water Water Table
Ce
Groundwater Ce
Stream water
Low flow period (groundwater dominated stream flow)
Stream water
Wetland
Ce
Wetland water Water Table
Ce
Groundwater
High flow period (wetland water dominated stream flow)
Ce
34
Figure 7.12 Synchronous Ce anomaly amplitude, discharge and DOC concentration variations in
the stream at the outlet of the Kervidy-Naizin catchment during hydrological year 1999-2000.
This use of the Ce anomaly amplitude variation as a probe of wetland water contributions to stream and river water flows could be regarded as having limited applicability, as the example presented relies on the daily monitoring of REE concentrations, which could be seen as a severe limitation for extrapolation to other river systems. However, comparable variations (i.e. decrease in the negative Ce anomaly amplitude along with an increase in the discharge and DOC concentrations) were observed at the Loch Vale catchment outlet in Colorado and in the Kalix River in Sweden based on weekly sampling (Ingri et al., 2010; Shiller, 2014), suggesting that the
0 200 400 600 800 1000 1200 0,15 0,20 0,25 0,30 0,35 0,40 0,45 0,50 0,55 Ce/Ce* Discharge 0 200 400 600 800 1000 1200 0 5 10 15 20 25 DOC Discharge Ce/Ce* DO C (m g/L ) Dischar ge ( L/s) Dischar ge ( L/s)
Kervidy-Naizin catchment, France Streamwater at the oulet
Kervidy-Naizin catchment, France Streamwater at the oulet
0.55 0.50 0.45 0.40 0.35 0.30 0.25 0.20 0.15
35 method does not necessarily require a systematic daily monitoring frequency. Although possibly difficult to implement, this ability of the negative Ce anomaly to serve as a tool to identify the periods when the rivers and streams are becoming hydrologically connected to wetland soils is worth considering. For example, it could be used to show that some of the pollutants occurring at that time in the rivers and streams considered (e.g. some trace metals) have these soils as an ultimate source.
Figure 7.13 How the REE pattern can be used to determine the ultimate soil source of the REE
and trace metals released during the reduction of wetland soils (Davranche et al., 2011).
Another domain in which REE can be used as a probe concerns the identification of soil components that host trace metals which are released during wetland/floodplain soil reduction. The release of trace metals such as Pb, Cr, Ni, Zn, Cd, and As during flooding and their subsequent reduction is a classical feature of floodplain/wetland soils (Schulz-Zunkel and Krueger, 2009; Du Laing et al., 2009). In this type of soil, several soil phases such as Mn(IV)- Fe(III)–oxyhydroxides, organic matter (OM) or mixed Fe–OM particles can host trace metals,
0,0 0,2 0,4 0,6 0,8 1,0 1,2 1,4 1,6 1,8 2,0 0,0 0,5 1,0 1,5 2,0 2,5 3,0 3,5 Fe oxide control
Organic matter control
(Gd/Yb)
N(La
/Sm
)
NWetland water
Wetland soil organic matter (pH7 extraction)
Wetland soil Fe oxides (chemical reduction) Wetland organic colloids (microbial reduction) 2.0 1.6 1.2 0.8 0.4 0.0 I. 0.5 1.0 1.5 2.0 2.5 3.0 3.5
36 and one important question is to know which of these phases is(are) mobilized during the release process. Davranche et al. (2011) tackled this question by using REE as a probe of the activated phases. To do this, they used a wetland soil from the Kervidy Naizin catchment in France for which previous field monitoring data (Dia et al., 2001) revealed trace metal release during reduction. Their work was based on (i) the difference in the REE pattern between soil OM (relative MREE enrichment) and soil Fe(III) oxhydroxides (LREE enrichment) and (ii) the virtual absence of REE in the Fe components of the mixed Fe-OM particles. By performing different incubation laboratory experiments, Davranche et al. (2011) demonstrated that the REE fraction released in solution during the reduction of the studied soil had a pattern similar to that of the soil OM fraction, suggesting in turn that this fraction is the main source of REE and other trace metals that are released during the reduction of this soil (Figure 7.13).
The methodology developed by Davranche et al. (2011) is very promising with regards to the potential of REE to serve as a probe to identify the soil components from which trace metals are released during the reduction of wetland/floodplain soils. However, this use is clearly dependent on the occurrence of significant differences in the REE patterns between the end-members involved in the soil-water exchange process, a pre-requisite condition that should be evaluated in a greater number of sites.
V. REE impact on the human health and environment quality
Rare earth elements have been long considered as rare since the metallurgic extraction of individual elements is complicated and because of their low concentrations (ppb to ppt) in natural waters. However, over the past several decades, REE became of critical importance to many high-tech products and medical applications, and are therefore of great economic interest
37 (U.S. GAO, 2010). The global production of REE oxides increased from 10,000 t y-1 in 1965 to > 80,000 t y-1 in 2000 (Haxel et al., 2002). In 2008, the consumption of REE oxides was approximately 129,000 t (Goonan, 2011). The various applications of REE and the intense use of fertilizers in agriculture (0.1 to 1% REE in natural phosphate, Otero et al., 2005) may lead to a significant release of REE into the environment (Cidu et al., 2013). Kulaksiz and Bau (2011) showed abnormally high concentrations of Gd and La in the Rhine River (France). These authors highlighted that La was extremely mobile in this environment since La contamination was present more than 400 km after the source of the contamination. Tagami and Uchida (2006) provided evidence that REE are able to accumulate in soil and water and to bioaccumulate in the food chain. Sonich-Mullin et al. (2012) compiled the studies concerned with the specific human health effects of elevated REE concentrations. They only found a few studies which are, for the most part, dedicated to epidemiological data mixtures of REE rather than individual elements. These data indicate that the pulmonary toxicity of REE in humans may be a concern. Additionally, it has been shown that the larger, lighter (i.e. smaller atomic number), and less soluble REE are primarily deposited in the liver, while the smaller, heavier and more soluble REE are similar, in terms of their ionic radius, to divalent calcium and are primarily distributed to the bones. Therefore, it appears especially important to assess the occurrence and fate of aqueous REE in the environment.
Specifically concerning wetlands, previous concerns suggest that REE could be trapped by wetland soil components, notably organic matter. Their subsequent fate would thereby be controlled by the soil components and the behavior of the organic matter, which are themselves relative to the redox conditions prevailing in the wetland. Smuc et al. (2012) investigated the mobility of REE in contaminated paddy soil in Macedonia. Paddy soil can be considered as an
38 anthropogenic wetland, as the soils are regularly saturated. Although there were elevated REE concentrations in the soil, low amounts of REE occurred as soluble and exchangeable forms, as showed by the sequential extractions. The rice did not accumulate REE. Sequential extractions indicated that REE are mainly distributed in the organic and residual fractions, namely bound to soil organic matter and as minerals. Chen at al. (2014), who studied a series of paddy soil profiles with approximately 50, 300, 700 and 1000 years of paddy cultivation history, showed that paddy cultivation favors the accumulation of all REE in the soil profile. Several studies used sequential extractions of wetland soils under oxidizing conditions to demonstrate that REE are not very water soluble or exchangeable (Pédrot et al., 2008; Davranche et al., 2011; Mihajlovic et al., 2014). However under reducing conditions, when the organic phases of the soil are solubilized with their REE charge, REE are released into the wetland solution, and the question is now to know if the affinity between REE and organic ligands is strong enough to limit their bioavailability. Unfortunately, no ecotoxicology study is available to assess the potential bioavailability of REE bound to humic substances sourced in wetlands.
References
Andersson K., Dahlqvist R., Turner D., Stolpe B., Larsson T., Ingri J., Andersson P. (2006) Colloidal rare earth elements in boreal river: Changing sources and distributions during the spring flood. Geochim. Cosmochim. acta 70, 3261–3274.
Aries S., Valladon M., Polvé M., Dupré B. (2000) A routine method for oxide and hydroxide interference corrections in ICP-MS chemical analysis of environmental and geological samples. Geostand. Newsl. 24,19-31