HAL Id: hal-01255820
https://hal-univ-rennes1.archives-ouvertes.fr/hal-01255820
Submitted on 21 Apr 2016
HAL is a multi-disciplinary open access
archive for the deposit and dissemination of
sci-entific research documents, whether they are
pub-lished or not. The documents may come from
teaching and research institutions in France or
abroad, or from public or private research centers.
L’archive ouverte pluridisciplinaire HAL, est
destinée au dépôt et à la diffusion de documents
scientifiques de niveau recherche, publiés ou non,
émanant des établissements d’enseignement et de
recherche français ou étrangers, des laboratoires
publics ou privés.
the differentiation of HepaRG cells into mature
hepatocytes
Yichiro Higuchi, Kenji Kawai, Tatsuro Kanaki, Hiroshi Yamazaki, Christophe
Chesné, Christiane Guguen-Guillouzo, Hiroshi Suemizu
To cite this version:
Yichiro Higuchi, Kenji Kawai, Tatsuro Kanaki, Hiroshi Yamazaki, Christophe Chesné, et al..
Func-tional polymer-dependent 3D culture accelerates the differentiation of HepaRG cells into mature
hepatocytes. Hepatology Research, Wiley, 2016, 46 (10), pp.1045-1057 �10.1111/hepr.12644�.
�hal-01255820�
Original Article
Functional polymer-dependent 3D culture accelerates the
differentiation of HepaRG cells into mature hepatocytes
Yichiro Higuchi,
1Kenji Kawai,
1Tatsuro Kanaki,
2Hiroshi Yamazaki,
3Christophe Chesné,
4Christiane Guguen-Guillouzo
4and Hiroshi Suemizu
11
Central Institute for Experimental Animals, Kawasaki,2Nissan Chemical Industries, Shiraoka,3Showa Pharmaceutical University, Tokyo, Japan; and4Biopredic International, Rennes, France
Aim: The hepatoma-derived cell line HepaRG is regarded as an in vitro model of drug metabolism because fully differentiated HepaRG cells demonstrate functional metabolic responses com-parable to those of primary human hepatocytes. Recently, it was demonstrated that the 3D culture of HepaRG cells enhanced their metabolic functions and toxicological responses. We approached the mechanisms underlying these enhancement effects.
Methods: We compared 2D-cultured HepaRG cells with 3D-cultured HepaRG spheroids in the gene expression patterns and the metabolic functions. In the present study, we performed 3D culture of HepaRG cells using functional polymers (FP). To reveal the in vivo differentiation ability, we transplanted the 3D-cultured HepaRG spheroids into TK-NOG mice.
Results: A comparison between 2D and 3D cultures revealed that 3D-cultured HepaRG spheroids demonstrated reductions
in bile duct marker expression, accelerated expression of cytochrome P450 3A4, and increases in the ratio of albumin-expressing hepatocytes. Furthermore, catalytic activities of cytochrome P450 3A4 were modified by omeprazole and rifam-picin in the 3D-cultured HepaRG spheroids. Transplantation analysis revealed that 3D-cultured HepaRG spheroids formed hepatocyte-like colonies rather than cholangiocytes in vivo.
Conclusion: Our results indicated that the enhancement of hepatic functions in 3D-cultured HepaRG cells was induced by selective hepatocyte differentiation and accelerated hepatocyte maturation. HepaRG spheroids reproduced the metabolic responses of human hepatocytes. Therefore, FP-dependent 3D-cultured HepaRG cells may serve as an excellent in vitro model for evaluating the hepatic metabolism and toxicity.
Key words: FP001, HepaRG cells, TK-NOG mouse, 3D culture
INTRODUCTION
T
HE LIVER GOVERNS several types of in vivo metabolic functions, such as carbohydrate metabolism, urea and lipid metabolism, storage of essential nutrients, produc-tion of plasma proteins and secreproduc-tion of bile acids. Because drug metabolism is also performed in the liver, in vitro liver culture techniques are important for pharmacology studies designed to elucidate the mechanisms and metabolism of drugs and other chemicals as well as excretion and toxicity. Primary human hepatocyte cultures were recently regarded as a gold standard model for evaluating hepatic metabo-lism and toxicity in vitro. However, the availability of primary human hepatocytes is limited, and there areindividual differences in hepatic functions and in vitro life spans. Therefore, immortalized hepatic cell lines are generally used to overcome these challenges.
HepaRG cells in particular have been successfully applied in the evaluation of chemicals and drug candidates.1,2These cells, which were isolated from a hepatic-differentiated grade 1 Edmonson hepatocholangiocarcinoma, retain their bipotent hepatic progenitor-like characteristics.3 HepaRG cells have the ability to differentiate into hepatocytes and cholangiocytes both in vitro and in vivo, and fully differenti-ated hepatocytes demonstrate physiological functions simi-lar to primary-cultured human hepatocytes.4,5Recently, it has been demonstrated that in vitro 3D) culturing of HepaRG cells enhanced their hepatic characteristics and metabolic functions. For example, researchers have applied 3D bioreactors for the cultivation of HepaRG cells and dem-onstrated that HepaRG cells showed enhanced metabolic functions and formed tissue-like structures in the bioreac-tors.6,7Furthermore, additional researchers have reported that the 3D culture of HepaRG cells using a hanging drop
Correspondence: Dr Yuichiro Higuchi, Laboratory Animal Research Department, Biomedical Research Laboratory, Central Institute for Experimental Animals, 3-25-12 Tonomachi, Kawasaki-ku, Kawasaki 210-0821, Japan. Email: y-higuchi@ciea.or.jp
Received 3 August 2015; revision 28 December 2015; accepted 29 December 2015.
1 © 2016 The Authors. Hepatology Research published by Wiley Publishing Asia Pty Ltd on behalf of Japan Society of Hepatology
method, multi-well platforms or nanofibrillar cellulose and hyaluronan-gelatin hydrogels resulted in the enhancement of metabolic responses.8–11On the other hand, it remains unclear how the 3D culture enhances the metabolic activi-ties of HepaRG cells.
In the present study, we performed a large-scale 3D culture of HepaRG cells using functional polymers (FP; FP001). FP001 is an additional chemical compound that can maintain the 3D-cultured spheroids in suspension. It consists of low-acyl gellan gum, which was isolated as an extracellular polysaccharide secreted by Sphingomonas paucimobilis. Because it allows the 3D culture of spheroids without the requirement for stirring, FP001 is used for the 3D culture of human iPS cells.12 Corresponding to the results of previous studies, HepaRG spheroids that formed in the medium containing FP001 demonstrated a greater level of mature hepatic characteristics than that of 2D cultured HepaRG cells. Furthermore, the comparison of gene expression patterns and albumin-expressing hepa-tocytes revealed that 3D culture accelerated the differentia-tion of HepaRG cells into hepatocytes rather than cholangiocytes in vitro and in vivo. Based on these results, we concluded that accelerated hepatocyte maturation and selective hepatocyte differentiation in HepaRG spheroids upregulated their hepatic characteristics and metabolic functions.
METHODS
HepaRG cells
I
N ACCORDANCE WITH the manufacturer’s protocol, HepaRG cells were maintained in HepaRG maintenance medium (Biopredic International, Rennes, France). In the case of 2D cultures, HepaRG cells were cultured in Williams’ medium E (Life Technologies, Grand Island, NY, USA) supplemented with 10% fetal bovine serum (Life Technologies), 50 units/mL penicillin, 50 μg/mL streptomycin (P/S; Nacalai Tesque, Kyoto, Japan), 5μg/mL insulin (Sigma-Aldrich, St Louis, MO, USA) and 5 × 10 5M hydrocortisone hemisuccinate (Sigma-Aldrich) as previously described.4HepaRG cells were seeded onto six-well cell culture plates (Thermo Fisher Scientific, Waltham, MA, USA) at a density of 2 × 10⁴cells/cm2. Cells were cultured until 14 days after seeding, when the medium was replaced with differentiation medium containing 1.7% dimethylsulfoxide (DMSO). For the 2D culture, the medium was changed every 2 days. In the case of the 3D culture, Williams’ medium E containing 0.005% FP001 (culture medium composition and method of cul-turing cell or tissue using thereof, US 2014/0106348A1) was used as the basal medium. We supplied the sameadditive agents used for 2D culture. HepaRG cells were seeded onto six-well plates with Ultra-Low Attachment surface (Corning, Lowell, MA, USA) at a density of 2 × 10⁴cells/cm2. Cells were cultured in the medium con-taining 0.005% FP001 until 14 days after seeding, when the medium was replaced with differentiation medium containing 0.005% FP001 and 1.7% DMSO. For the 3D culture, the medium was changed once per week.
Reverse transcription polymerase chain
reaction (RT
–PCR)
Total RNA was obtained from HepaRG cells and human hepatocytes using an RNeasy Mini Kit (Qiagen, Tokyo, Japan). RT–PCR was performed using a High-Capacity cDNA Reverse Transcription kit (Life Technologies). Quan-titative RT–PCR (qRT–PCR) was performed using a SYBR Premix Ex Taq II (Takara Bio, Shiga, Japan). The primer sequences for each primer set are shown in Table 1. The qRT–PCR conditions were as follows: denaturation at 95°C for 3 s and annealing and extension at 60°C for 30 s for up to 40 cycles. Target mRNA levels, expressed as arbitrary units, were determined using a standard curve. The amplification was then conducted using an ABI 7500 Fast Real-time PCR System (Life Technologies). The expression of all genes was normalized to the expression of glyceraldehyde 3-phosphate dehydrogenase.
Enzyme-linked immunoassay (ELISA)
We measured the increases in the level of human albumin (ALB) in the HepaRG culturing medium or mouse blood using a Human Albumin ELISA Quantifi-cation Kit (Bethyl Laboratories, Montgomery, TX, USA) according to the manufacturer’s protocol. In the case of in vitro culture, the media were changed and collected on days 7, 14, 21 and 28.
Flow cytometry analysis
Twenty-eight days after seeding, 2D- or 3D-cultured HepaRG cells were dissociated using 0.05% trypsin-ethylenediaminetetraacetic acid (EDTA; Life Technolo-gies). For viability analyses, cells were suspended in 2μg/ml propidium iodide (PI)/Hank’s balanced salt so-lution (Sigma-Aldrich). For ALB analysis, 1 × 10⁶cells were fixed and stained using a BD Cytofix/Cytoperm Plus Fixation/Permeabilization Kit (BD Bioscience, Bed-ford, MA, USA). Biotin-conjugated polyclonal goat anti-human ALB antibody (Bethyl Laboratories) was used as the primary antibody. In the case of isolated hepatocytes, mouse and human hepatocytes were stained for antigen-presenting cell-conjugated monoclonal mouse antihuman human leukocyte antigen (HLA) antibody
(clone G46-2.6; BD Bioscience). The stained cells were analyzed using a fluorescence-activated cell sorting (FACS) Canto (BD Bioscience). Data were recorded with the BD FACS Diva Software program (BD Bioscience) and analyzed using the FlowJo program (Tree Star, San Carlos, CA, USA).
Assay of cytochrome P450 (CYP) function
As a positive control for the P450 assay, human hepato-cytes were isolated from the TK-NOG mouse with humanized livers using the two-step collagenase perfusion method13. Isolated-human hepatocytes were seeded onto Matrigel (BD Bioscience)-coated 24-well cell culture plates (Thermo Fisher) at a density of 6 × 10⁵cells/well and then cultured in the HepaRG main-tenance medium. For P450 induction, 100μM omeprazole (Sigma-Aldrich) or 10μM rifampicin (Sigma-Aldrich) was added to the medium 72 h before analysis. For P450 inhibi-tion, 100μM erythromycin (Sigma-Aldrich) was added in the medium 72 h before analysis. We treated the 2D- or 3D-cultured HepaRG cells with P450 inducers/inhibitors from day 25 to 28 after seeding. In the case of the isolated human hepatocytes, we treated the cells with P450 inducers/inhibitors from day 1 to 4 after seeding. P450 catalytic function was analyzed using the P450-Glo CYP1A2
Induction/Inhibition Assay (Promega, Madison, WI, USA), P450-Glo CYP2C9 Assay (Promega), and the P450-Glo CYP3A4 Assay with luciferin isopropyl acetal (luciferin-IPA; Promega). After 72 h of cultivation with P450 inducers/inhibitors, 2D- or 3D-cultured HepaRG cells were re-seeded onto 24-well plates at a density of 6 × 10⁵cells/ well. HepaRG cells or human hepatocytes were then incu-bated with 300 μL of medium (without DMSO) supple-mented with luciferin-1A2 (for CYP1A2), luciferin-H (for CYP2C9) and luciferin-IPA (for CYP3A4). After incubation, supernatants were collected and analyzed according to the manufacturer’s protocols. Luminescence was measured using the IVIS Spectrum CT and Living Image software (Perkin Elmer, Waltham, MA, USA).
Transplantation into TK-NOG mice
All mouse studies were conducted in strict accordance with the Guide for the Care and Use of Laboratory Animals of the Central Institute for Experimental Animals, and the experimental protocols were approved by the Animal Care Committee of CIEA (permit no. 11029A). All surgeries were performed under isoflurane anesthesia, and all efforts were made to minimize suffering. Adult 8–10-week-old male TK-NOG mice were injected i.p. with ganciclovir (GCV) sodium (10 mg/kg, Denosine-IV; Mitsubishi
Table 1 Primer sequences
Gene Forward primer Reverse primer
AFP GGGAGCGGCTGACATTATTA CTGAGCTTGGCACAGATCCT
ALB GAGCTTTTTGAGCAGCTTGG GGTTCAGGACCACGGATAGA
CK7 TCGCTGAGGTCAAGGCACAG CACTCCTCAGCCTCGGCAAT
CK19 GAGCAGGTCCGAGGTTACTG GCTCACTATCAGCTCGCACA
CYP1A2 GGACAGCACTTCCCTGAGAG GCTCCTGGACTGTTTTCTGC
CYP2C9 GCAGGAAAACGGATTTGTGT GGCCATCTGCTCTTCTTCAG
CYP2C19 GTGAAGGAAGCCCTGATTGA TCCTCTTGAACACGGTCCTC
CYP2E1 ACCCGAGACACCATTTTCAG TCCAGCACACACTCGTTTTC
CYP3A4 GAGCTGAGATTGCACCACTG GGATGGAATGCAAGAGGTGT
GAPDH GTGGACCTGACCTGCCGTCT GGAGGAGTGGGTGTCGCTGT
HNF1B GCCTTAGTGGAGGAATGCAA GAGGGTTCAGGCTGTGAGTC
HNF4A AACCTGTTGCAGGAGATGCT TTGCCTTGTTCCCATTTTTC
HNF6 TGGGAAGGATAGAGGCAACA GCCACTTGTCCAGACTCCTC
HES1 CTAAACTCCCCAACCCACCT AGGCGCAATCCAATATGAAC
IRF2 ACACTGGCGGAAGAGGAATA GAAGAAAGGGGGAGGTCTTG
ITGB4 CCCCCTTCTCCTTCAAGAAC GCTGACTCGGTGGAGAAGAC
NOTCH1 GGAGGCATCCTACCCTTTTC TGTGTTGCTGGAGCATCTTC
NOTCH2 GCCTGGCAGTGTTACCTCAT GTCCCTGAGCAACCATCTGT
p53 GCGCACAGAGGAAGAGAATC CAAGGCCTCATTCAGCTCTC
SOX9 GCCTTTTTGTCCATCCCTTT GCTTGCATTGTTTTTGTGTCA
AFP,α-fetoprotein; ALB, albumin; CK, cytokeratin; CYP, cytochrome P450; GAPDH, glyceraldehyde 3-phosphate dehydrogenase; HNF, hepatic nuclear factor; HES1, hairy and enhancer of split 1; IRF2, interferon regulatory factor 2; ITGB4, integrin beta 4; SOX9, SRY (sex determining region Y)-box 9.
Tanabe Pharma, Osaka, Japan) to ablate the mouse liver cells expressing the HSV-TK transgene. One week after GCV treatment, the degree of liver damage was examined by determining plasma alanine aminotransferase (ALT) levels using an automated clinical chemistry analyzer (FUJI DRI-CHEM 7000; Fuji Photo Film, Tokyo, Japan). Liver-injured TK-NOG mice (>600 IU/L ALT) underwent HepaRG cell transplantation. Using 0.05% trypsin-EDTA (Life Technologies), 2D-cultured HepaRG cells were dissociated. In the case of 2D-cultured HepaRG cells or cryopreserved hepatocytes (HEP187266; 5 years old, male; Biopredic International), a total of 1 × 10⁶cells in 50μL of Williams’ medium E (Life Technologies) were intrasplenically injected using a 1/2-mL Insulin Syringe with Permanently Attached Needle (29-G × 1/2-in; Terumo, Tokyo, Japan). In the case of HepaRG spheroids, a portion of the spheroid suspension was dissociated using 0.05% trypsin-EDTA to count the cell numbers. We then suspended HepaRG spheroids (equivalent to 1 × 10⁶cells) in 100μL of Williams’ medium E (Life Technologies) with-out dissociation. HepaRG spheroids were directly injected into the portal vein using a 1/2-mL Insulin Syringe with Permanently Attached Needle. The bleeding from the portal vein was stanched using Spongel (Astellas Pharma, Tokyo, Japan).14,15
Histology and immunohistochemistry
HepaRG spheroids and HepaRG-transplanted TK-NOG livers werefixed with 10 nM Mildform formaldehyde solu-tion (Wako Pure Chemical Industries, Osaka, Japan). Formalin-fixed tissues were embedded in paraffin and then sliced and analyzed by either hematoxylin–eosin (H&E) staining or immunohistochemistry. Immunohisto-chemistry was performed with the Leica Bond-Max automated IHC platform (Leica Biosystems, Mount Waverley, Vic., Australia). Paraffin sections were dewaxed in a Bond Dewax solution and rehydrated in alcohol and Bond Wash solution (Leica Biosystems). Antigen re-trieval was performed using a 10-mM citrate buffer, pH 6 (ER1) retrieval solution, followed by endogenous peroxidase blocking on the machine. Detection was performed using the Bond Polymer Refine Detection system. Sections were then counterstained with hema-toxylin on the machine. Immunohistochemical analysis consisted of polyclonal goat anti-human ALB (Bethyl Laboratories), monoclonal mouse anti-cytokeratin 19 (CK19) (clone b170; Leica Biosystems, Newcastle, UK), monoclonal rabbit CYP3A4 (clone EPR6202; Abcam, Cambridge, MA, USA), monoclonal mouse anti-human (clone 3B8c1; Abcam), monoclonal mouse anti-human multidrug resistance-associated protein 2 (MRP2) (clone
Figure 1 3D culture of HepaRG cells in medium containing FP001. (a) Phase contrast images of 2D-cultured HepaRG cells (2D) and 3D-cultured HepaRG spheroids (3D). HepaRG cells were cultured for 28 days (bar = 200 μm). (b) Size distribution of HepaRG spheroids. Twenty-eight days after seeding, the diameters of 336 HepaRG spheroids were measured using the Image Processing and Analysis in Java software. (c) HepaRG spheroids were cultured in medium without ( ) or with (+) FP001 for 28 days. Serial sections were stained for H&E and ALB (brown) and CK19 (blue) double staining. The inside of FP001 ( ) demonstrates low cell density because of necrosis (bar = 100μm).
M2 III-6; Merck Millipore, Billerica, MA, USA) and polyclonal rabbit antihuman solute carrier family 10 member 1 (SLC10A1; Abcam). A periodic acid-Schiff (PAS) staining kit (Muto Pure Chemicals, Tokyo, Japan) was used for visualizing glycogen. The images were captured under an upright microscope (Axio Imager. M1; Carl Zeiss, Thornwood, NY, USA) equipped with AxioCam MRc5 CCD cameras (Carl Zeiss). The HepaRG cell colonies containing more than 20 ALB or CK19 pos-itive cells on the cross-sections of 3–5 lobes of the TK-NOG mouse liver were counted. The areas of the immunohistochemical sections were measured using the Image Processing and Analysis in Java software (ImageJ version 1.44, http://ImageJ.nih.gov/ij/). The colony formation was evaluated as the number of colonies per area of observation (colonies/cm2).
RESULTS
3D culture of the HepaRG cells with FP001
T
O PERFORM THE 3D culture of HepaRG cells, we only added FP001 into the culture medium.12We started the 2D or 3D cultures of HepaRG cells from the same number of cells (2 × 10⁵cells/well) in order to compare these culture conditions. In the case of 3D cultures, FP001 inhibited the aggregation of HepaRG cells, and HepaRG cells formed uni-form spheroids (115.5 ± 1.7μm in diameter) consisting of approximately 100 cells within 1 week (Fig. 1a,b). When HepaRG cells were cultured in medium without FP001, cells formed huge aggregates of more than 500μm in diam-eter (Fig. 1c). Consistent with the results of a previous study, the inner sides of the huge aggregates caused necrosis.16In the case of 2D cultures, the number of cells increased by 10-fold at 28 days after seeding. On the other hand, HepaRG spheroids maintained their cell numbers from the time of seeding (Table 2). Theflow cytometry analysis of PI negative cells revealed that there was no difference in the viability between 2D- and 3D-cultured cells (Table 2). We then confirmed the maturity of HepaRG spheroids by immunohistochemistry, which demonstrated that theyexpressed a major drug-metabolizing enzyme, CYP3A4, and a major organic anion transporter in bile excretion in the liver, MRP2 (Fig. 2a). In addition, PAS-staining revealed that HepaRG spheroids stored glycogen (Fig. 2a). The re-sults of previous studies demonstrated that the 3D culturing of HepaRG cells enhanced their metabolic functions.7–9 Corresponding to those studies, HepaRG spheroids in the present study demonstrated a higher level of CYP3A4 func-tion when compared with 2D-cultured HepaRG cells (Fig. 2b). These results indicated that HepaRG spheroids grown in the medium containing FP001 differentiated into functional hepatocytes.
3D culture accelerated the differentiation of
HepaRG cells into hepatocytes rather than
cholangiocytes
To reveal the reason for HepaRG spheroids exhibiting high CYP3A4 function, we compared the hepatic lineage marker expression of HepaRG spheroids with that of 2D-cultured HepaRG cells. The gene expression analysis revealed that 3D-cultured HepaRG spheroids had higher expression of hepatic differentiation markers and meta-bolic enzymes at the early time points (Fig. 3a,b). Consis-tent with the mRNA expression, the level of ALB secretion from the HepaRG spheroids was higher than that of 2D-cultured HepaRG cells (Fig. 4a). In addition, the flow cytometry analysis revealed that the ratio of ALB-expressing cells was significantly increased in 3D-cultured HepaRG cells (Fig. 4b, Table 2). The expression levels of bile duct markers were decreased in HepaRG spheroids (Fig. 3c). These results indicated that 3D culturing of HepaRG cells accelerated the differentiation of bipotent HepaRG cells into hepatocytes rather than cholangiocytes. Proliferation is an important factor for the differentiation of HepaRG cells, and it is restricted under the 3D culture conditions (Table 2). The gene expression analysis revealed that HepaRG spheroids displayed higher expres-sion levels of p53-related genes 7 days after seeding (Fig. 3d). In addition, it was demonstrated that Notch sig-naling regulated the differentiation of hepatocytes and
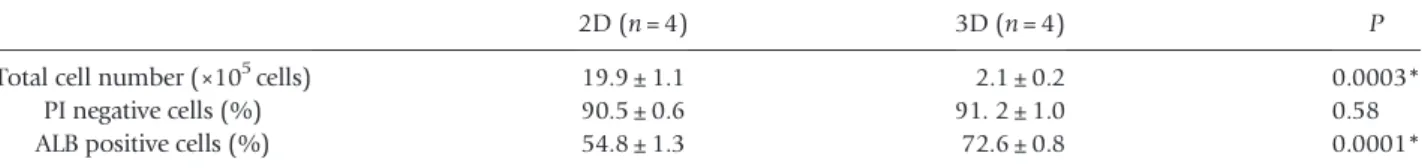
Table 2 Comparison of the proliferation, viability and differentiation of HepaRG cells
2D (n = 4) 3D (n = 4) P
Total cell number (×105cells) 19.9 ± 1.1 2.1 ± 0.2 0.0003*
PI negative cells (%) 90.5 ± 0.6 91. 2 ± 1.0 0.58
ALB positive cells (%) 54.8 ± 1.3 72.6 ± 0.8 0.0001*
(*P< 0.05)
We compared total cell number, viability (PI negative cells) and ALB positive cells from 2D-cultured HepaRG cells (2D) and 3D-cultured HepaRG spheroids (3D). In both conditions, 2 × 10⁵HepaRG cells were inoculated in the six-well plate for 28 days. Values represent mean ± standard error of four wells. Significant differences were observed in the total cell numbers and the ALB positive cells.
cholangiocytes from hepatoblasts in the developmental stage.17–19 Consistent with the results of those studies, the expression level of HES1, which is the downstream target of Notch signaling, was decreased in HepaRG spheroids (Fig. 3e). These results suggest that the limited proliferation accelerated the maturation of hepatocytes, and insufficient activation of Notch signaling induced the selective differentiation of HepaRG cells toward the hepa-tocyte phenotype.
3D-cultured HepaRG spheroids reproduced the
metabolic responses of human hepatocytes
To examine the effects of P450 inducers, we treated the 2D-or 3D-cultured HepaRG cells with rifampicin 2D-or omepra-zole. For the positive control, we isolated the human hepatocytes from TK-NOG mouse with humanized liver.20 The extent of reconstitution with human hepatocytes was estimated as a function of the human ALB concentration, which was revealed to correlate with the extent of human liver replacement.20TK-NOG mouse with humanized liver had a human ALB concentration of 5.77 mg/mL in the plasma, suggesting that 86.9% of the mouse liver was replaced with human hepatocytes. Consistent with the replacement index, almost all of the isolated hepatocytes were HLA positive human hepatocytes (Fig. 5a,b). After cultivation with inducers, we measured the expression levels and catalytic activities of drug-metabolizing
enzymes. Omeprazole treatment induced the expression of CYP1A2 and CYP3A4, and rifampicin treatment induced the expression of CYP2C9 and CYP3A4 (Fig. 5c). Corresponding to the CYP1A2 mRNA expression levels, the oxidation of luciferin-1A2 in the omeprazole-treated cells was increased in all samples (Fig. 5d, CYP1A2). The oxidation of luciferin-H and luciferin-IPA was also induced in the rifampicin-treated samples (Fig. 5, CYP2C9, CYP3A4). On the contrary, the oxidation of luciferin-IPA in the omeprazole-treated samples was increased in the 2D-cultured HepaRG cells, but significantly decreased in the 3D-cultured HepaRG cells and human hepatocytes (Fig. 5d, CYP3A4). When the effects of erythromycin were examined, the CYP3A4-dependent oxidation of luciferin-IPA in all samples was decreased (Fig. 5e). Because omep-razole and its metabolite 5′-O-desmethyl omepomep-razole as well as erythromycin have been reported to be substrates and time-dependent inhibitors of CYP3A4,21–23 the apparent suppression of CYP3A4-mediated drug oxidation in 3D-cultured HepaRG spheroids was visualized by reproduced CYP3A4 function.
Transplanted HepaRG spheroids formed
hepatocyte-like colonies rather than
cholangio-like colonies in vivo
We transplanted HepaRG spheroids into the livers of TK-NOG mice to reveal their in vivo differentiation ability.20
Figure 2 HepaRG spheroids demonstrate mature characteristics of the liver. (a) Expression of mature liver markers in the HepaRG spheroids. HepaRG spheroids were cultured with FP001 for 28 days. Serial sections were stained for H&E, CYP3A4, MRP2 and PAS (bar = 100μm). (b) Twenty-eight days after seeding, CYP3A4 metabolic function in the 2D- or 3D-cultured HepaRG cells was quanti-fied. The graph represents relative luminescence unit/cell (RLU/cell) that the level of 2D is defined as 1. Values represent mean ± standard
To avoid embolization in the spleen, HepaRG spheroids were directly injected into the portal vein. Subsequently, HepaRG spheroids embolized and invaded the liver parenchyma. Immunohistochemical analysis revealed that HepaRG spheroids de-differentiated into ALB positive/CK19 positive cells at a day after transplantation (Fig. 6). ALB positive/CK19 positive cells were observed for 2 weeks, and these cells were re-differentiated into ALB positive/CK19 negative hepatocytes or ALB negative/CK19 positive cholangiocytes between 4 and 10 weeks after transplantation (Fig. 6). Consistent with the results of another study conducted by our group, the HepaRG spheroids formed colonies of hepatocyte-like or cholangio-like epithelial cells
12 weeks after transplantation (Fig. 7).5In the hepatocyte-like cells, we observed the expression of drug-metabolizing enzymes (Fig. 7b). Next, we compared the HepaRG-transplanted livers between the 2D and 3D methods. How-ever, there was no significant difference in the serum human ALB levels of transplanted animals and the size of hepatocyte-like colonies (Fig. 8a,b). Because the 3D-cultured HepaRG cells differentiated into hepatocytes rather than cholangiocytes in vitro, we quantified the incidence of hepatocyte-like colonies or cholangio-like colonies in the transplanted livers. When 2D-cultured HepaRG cells were transplanted into the livers of the mice, the HepaRG cells formed hepatocyte-like colonies and cholangio-like colonies
Figure 3 3D culture of HepaRG cells accelerates the differentiation of functional hepatocytes. We compared the gene expression patterns of 2D- (white column) and 3D-cultured HepaRG cells (black column) by qRT-PCR. At 7 (D7), 14 (D14), 21 (D21) and 28 (D28) days after seeding, the expression levels of (a) hepatic differentiation markers (AFP, ALB, HNF4A, HNF1B and HNF6), (b) metabolic enzymes (CYP1A2, CYP2C9, CYP2C19, CYP2E1 and CYP3A4), (c) bile duct markers (CK19, SOX9, CK7 and ITGB4), (d) p53-related genes (IRF2, p53) and (e) Notch-related genes (HES1, NOTCH1 and NOTCH2) were quantified. The expression level was normalized to that of GAPDH. The graph presents the gene expression relative to that of 2D D7 (a–d) or 2D D14 (e), which is defined as 1. Values are presented as the mean ± standard error (n = 3). Significant increase (*P < 0.05) or decrease (†P < 0.05) between 2D and 3D was observed.
in a 1:1 ratio (Fig. 8c). Conversely, the incidence of cholangio-like colonies was significantly decreased in the HepaRG spheroid-transplanted animals (Fig. 8d). These re-sults indicated that the selective hepatocyte differentiation of HepaRG spheroids was reproduced in the livers of TK-NOG mice.
DISCUSSION
I
N THE PRESENT study, we used FP001 for the 3D cul-ture of HepaRG spheroids. Compared with other 3D culture methods, the use of FP001 allows for easier large-scale 3D culturing of HepaRG cells.12In concordance with the results of previous studies, the HepaRG spheroids that were grown in the FP001-containing medium exhibited mature hepatic characteristics and functional metabolic responses. After comparing 3D and 2D culture, we observed that 3D-cultured HepaRG spheroids displayed decreased bile duct marker expression and an increased ratio of ALB-expressing hepatocytes. In addition, a low level of activation of Notch signaling was observed in the 3D-cultured HepaRG spheroids. These results indicated that 3D culture induces the differentiation of HepaRG cells into hepatocytes rather than cholangiocytes. Notch signal-ing is transduced from adjacent cells via the interaction of membrane ligands and receptors, and cell–cell interaction is limited in the small HepaRG spheroids (Fig. 1c, Fig. 2a). Consistent with this hypothesis, ALB negative/CK19 posi-tive cholangiocytes were frequently observed in the huge aggregates of HepaRG cells (Fig. 1c). From these results, we speculated that insufficient activation of Notchsignaling inhibited the differentiation of cholangiocytes in the HepaRG spheroids. Furthermore, the precocious dif-ferentiation of hepatocytes was observed in the HepaRG spheroids. Compared with that in the 2D-cultured cells, the proliferation of HepaRG cells was restricted in the HepaRG spheroids (Table 2). A previous study demon-strated that the commitment of HepaRG cells to differenti-ation is strongly dependent on cell density24. Because we performed the 2D culture of HepaRG cells at a low cell density, enhanced proliferation delayed the differentiation of hepatocytes. On the contrary, 3D-cultured HepaRG spheroids replicated the conditions of confluency similarly as high-cell-density culture. In addition, 3D-cultured HepaRG spheroids displayed high expression levels of tumor suppressor genes at 7 days after seeding (Fig. 3d). These results indicate that the inactivation of cell division accelerated the maturation of hepatocytes and led to the earlier expression of hepatic differentiation markers and metabolic enzymes in HepaRG spheroids from early time points (Fig. 3a,b). Based on these results, we concluded that the enhancement of metabolic functions observed in 3D culture was caused by both selective hepatocyte differ-entiation and accelerated hepatocyte maturation.
Although 2D- and 3D-cultured HepaRG cells demon-strated the similar expression level of ALB, the expression of metabolic enzymes was significantly increased by 3D culture. It suggests the 3D-cultured HepaRG spheroids have matured into functional hepatocytes. In particular, CYP1A2 expression was increased in the 3D-cultured HepaRG spheroids, and omeprazole treatment further enhanced the expression and function of CYP1A2
Figure 4 ALB expression in the 2D- and 3D-cultured HepaRG cells. (a) At 7 (D7), 14 (D14), 21 (D21) and 28 (D28) days after seeding, human ALB secreted from 2D- (white column) and 3D-cultured HepaRG cells (black column) was quantified by enzyme-linked immu-noassay. The human ALB concentration was normalized to the cell number (2 × 10⁵cells/sample). Values are presented as the mean ± standard error (n = 3). Significant increase (*P < 0.05) between 2D and 3D was observed. (b) On D28, ALB-expressing hepatocytes were quantified using a flow cytometer.
Figure 5 HepaRG spheroids react with P450 inducers and P450 inhibitor. (a) Isolated hepatocytes from NOG (black) or TK-NOG mouse carrying human hepatocytes (red) were analyzed byflow cytometer. HLA positivity denotes human cells. (b) Phase contrast im-ages of human hepatocytes that cultured for 24 h (bar = 200μm). (c) 2D-cultured HepaRG cells (2D), 3D-cultured HepaRG cells (3D) or isolated human hepatocytes (HEP) were treated with 10μM rifampicin or 100 μM omeprazole for 72 h. CYP1A2, CYP2C9 and CYP3A4 expression levels were quantified by qRT-PCR. The graph presents the relative gene expression compared to that of the 2D vehicle, which is defined as 1. Values represent mean ± standard error (SE) (n = 4). Significant increases in gene expression were observed in rifampicin-or omeprazole-treated samples (*P< 0.05) from those levels in the vehicle-treated samples. (d) Metabolic function was quantified in HepaRG cells and human hepatocytes treated with rifampicin or omeprazole for 72 h. The graph presents the relative luminescence unit/cell (RLU/cell) compared with that of 2D vehicle is defined as 1. Values are presented as the mean ± SE (n = 4). Significant increases (*P< 0.05) or decreases (†P < 0.05) in metabolic functions were observed in rifampicin- or omeprazole-treated samples from those levels in the vehicle-treated samples. (e) Metabolic function in HepaRG cells and human hepatocytes treated with 100 mM erythromycin for 72 h was quantified. The graph presents the values as RLU/cell relative to that of 3D vehicle, which is defined as 1. Values are pre-sented as the mean ± SE (n = 4). Significant increases (*P < 0.05) or decreases (†P < 0.05) in metabolic functions were observed in eryth-romycin-treated samples from those levels in the vehicle-treated samples.
(Fig. 3b, Fig. 5c,d). Although P450 inducers enhanced the expression of metabolic enzymes in both the 2D- and 3D-cultured HepaRG cells, CYP3A4 inactivation by omeprazole and its metabolite was only observed in the 3D-cultured HepaRG spheroids (Fig. 5d). Further-more, erythromycin-dependent CYP1A2 inactivation was not observed in the 2D-cultured HepaRG cells (Fig. 5e). In general, liver cells are arranged in perfused 3D structures in vivo, and this is important for their intra-cellular function and the maintenance of their specific polarity. The results of previous studies demonstrated that human liver cells exhibit in vivo-like metabolic func-tions and liver tissue-like structures when cultured in a perfused 3D bioreactor.25,26In addition, there have been many attempts to culture human hepatocytes in 3D cul-ture systems using various platforms.27The results of the
present study indicated that the use of 3D-cultured HepaRG spheroids held advantages pertaining to both pharmacology and toxicology as compared with 2D-cultured cells.
Humanized-liver mice, wherein the liver has been repopulated with human hepatocytes, have been used to study the aspects of human liver physiology such as drug metabolism, toxicology and hepatitis infection.20,28–31 The procurement of human hepatocytes is a major challenge in producing humanized-liver mice because of the finite nature of the patient-derived resource. We reported that HepaRG cells were a possible cell source for generating humanized-liver mice. In the present study, we transplanted HepaRG spheroids into the livers of TK-NOG mice.5Consistent with the selective differentiation observed in vitro, the HepaRG spheroids transplanted into
Figure 6 Time-lapse analysis of the HepaRG spheroids-transplanted livers. HepaRG spheroids-transplanted animals were killed at a day (D1), 2 weeks (2w), 4 weeks (4w), and 10 weeks (10w) after transplantation. Recovered livers were analyzed by immunohistochemistry. Serial sections were stained for H&E, ALB and CK19 (bar = 100μm).
the livers of TK-NOG mice re-differentiated into the hepatocyte-like epithelial cells rather than cholangiocytes (Fig. 6). Because HepaRG-derived hepatocytes express SLC10A1, TK-NOG mice carrying these HepaRG cells may become an in vivo infection model for the hepatitis B virus (Fig. 7b). However, the replacement index of HepaRG cells in TK-NOG mice was significantly lower than that observed in human hepatocytes. In a previous study conducted by our group, we described an unstable engraftment of HepaRG cells.5To establish the in vivo ani-mal model, it was necessary to improve the in vivo stability of the HepaRG cells.
In conclusion, HepaRG spheroids that formed in medium containing FP001 acquired functional hepatic characteristics and reproduced the metabolic responses of human hepatocytes. A comparison of the culture methods revealed that 3D culture accelerated the differ-entiation of HepaRG cells into hepatocytes rather than cholangiocytes. It may be speculated that the limited
proliferation of HepaRG cells accelerates the matura-tion of hepatocytes, and the selective hepatocyte differ-entiation is attributable to the insufficient activation of Notch signaling. Because 3D culturing led to the enhancement of metabolic functions, HepaRG spher-oids that form in FP001-containing medium may become an excellent in vitro model for pharmacological screening.
ACKNOWLEDGMENTS
W
E WOULD LIKE to thank M. Kuronuma, Y. Ando, T. Ogura and R. Takahashi for outstanding technical as-sistance with the animal experiments, and Dr M. Horikawa and Dr H. Nishino for their helpful discussions. A portion of this work was supported by the Japan Chemical Industry Association’s (JCIA) Long-Range Research Initiative (LRI) program (12_S01-02-2) to H. Y., and a Grant-in-Aid for Science Research (256400055) to H. S.Figure 7 HepaRG spheroid derivatives in the TK-NOG mice. Twelve weeks after transplantation, HepaRG spheroids-transplanted livers were analyzed by immunohistochemistry. (a) HepaRG spheroid-derived cholangio-like cells in the transplanted liver. Serial sections were stained for H&E, ALB and cytokeratin (CK)19 (bar = 100 μm). (b) HepaRG spheroid-derived hepatocyte-like cells in the transplanted liver. Serial sections were stained for H&E, ALB, CK19, CYP1A2, CYP3A4 and SLC10A1 (bar = 100μm).
REFERENCES
1 Guillouzo A, Corlu A, Aninat C, Glaise D, Morel F, Guguen-Guillouzo C. The human hepatoma HepaRG cells: a highly differentiated model for studies of liver metabolism and toxicity of xenobiotics. Chem Biol Interact 2007 May 20; 168: 66–73.
2 Kanebratt KP, Andersson TB. Evaluation of HepaRG cells as an in vitro model for human drug metabolism studies. Drug Metab Dispos 2008 Jul; 36: 1444–52.
3 Gripon P, Rumin S, Urban S et al. Infection of a human hepatoma cell line by hepatitis B virus. Proc Natl Acad Sci U S A 2002 Nov 26; 99: 15 655–60.
4 Cerec V, Glaise D, Garnier D et al. Transdifferentiation of hepatocyte-like cells from the human hepatoma HepaRG cell line through bipotent progenitor. Hepatology 2007 Apr; 45: 957–67.
5 Higuchi Y, Kawai K, Yamazaki H et al. The human hepatic cell line HepaRG as a possible cell source for the generation of hu-manized liver TK-NOG mice. Xenobiotica 2014 Jan; 44: 146–53. 6 Darnell M, Schreiter T, Zeilinger K et al. Cytochrome P450-dependent metabolism in HepaRG cells cultured in a dy-namic three-dimensional bioreactor. Drug Metab Dispos 2011 Jul; 39: 1131–8.
7 Leite SB, Wilk-Zasadna I, Zaldivar JM et al. Three-dimensional HepaRG model as an attractive tool for toxicity testing. Toxicol Sci 2012 Nov; 130: 106–16.
8 Gunness P, Mueller D, Shevchenko V, Heinzle E, Ingelman-Sundberg M, Noor F. 3D organotypic cultures of human HepaRG cells: a tool for in vitro toxicity studies. Toxicol Sci 2013 May; 133: 67–78.
9 Mueller D, Kramer L, Hoffmann E, Klein S, Noor F. 3D organotypic HepaRG cultures as in vitro model for acute and repeated dose toxicity studies. Toxicol In Vitro 2014 Feb; 28: 104–12.
10 Malinen MM, Kanninen LK, Corlu A et al. Differentiation of liver progenitor cell line to functional organotypic cultures in 3D nanofibrillar cellulose and hyaluronan-gelatin hydrogels. Biomaterials 2014 Jun; 35: 5110–21.
11 Murayama N, Usui T, Slawny N, Chesne C, Yamazaki H. Human HepaRG Cells can be Cultured in Hanging-Drop Plates for Cytochrome P450 Induction and Function Assays. Drug Metab Lett 2015 Jan; 9: 3–7.
12 Otsuji TG, Bin J, Yoshimura A et al. A 3D sphere culture sys-tem containing functional polymers for large-scale human pluripotent stem cell production. Stem Cell Reports 2014 May 6; 2: 734–45.
13 Seglen PO. Preparation of isolated rat liver cells. Methods Cell Biol 1976; 13: 29–83.
14 Jenkins HP, Janda R, Clarke J. Clinical and experimental observations on the use of gelatin sponge or foam. Surgery 1946 Jul; 20: 124–32.
15 Miyayama S, Yamakado K, Anai H et al. Guidelines on the use of gelatin sponge particles in embolotherapy. Jpn J Radiol 2014 Apr; 32: 242–50.
16 Lin RZ, Chang HY. Recent advances in three-dimensional multicellular spheroid culture for biomedical research. Biotechnol J 2008 Oct; 3: 1172–84.
17 McCright B, Lozier J, Gridley T. A mouse model of Alagille syn-drome: Notch2 as a genetic modifier of Jag1 haploinsufficiency. Development 2002 Feb; 129: 1075–82.
18 Lorent K, Yeo SY, Oda T et al. Inhibition of Jagged-mediated Notch signaling disrupts zebrafish biliary development and generates multi-organ defects compatible with an Alagille syndrome phenocopy. Development 2004 Nov; 131: 5753–66. Figure 8 Comparison of HepaRG-transplanted animals between
2D and 3D culture. We transplanted 2D-cultured HepaRG cells (2D) or HepaRG spheroids (3D) into four TK-NOG mice each. (a) Recipient animals were sacrificed at 12 weeks after trans-plantation. In each animal, we quantified the human ALB levels by enzyme-linked immunoassay. Serial sections of recov-ered livers were stained for ALB and CK19. (b) We quantified the area of ALB+ hepatocyte-like colonies. Further, we quanti-fied the incidence of (c) ALB+
hepatocyte-like colonies and (d) CK19+ cholangio-like colonies. Values are presented as the mean ± standard error of four animals. The number of hepatocyte-like colonies or cholangio-like colonies was normal-ized by the area of the liver section in each animal. Significant differences between 2D and 3D cultures were observed in the incidence of cholangio-like colonies (†P < 0.05).
19 Wang T, You N, Tao K et al. Notch is the key factor in the process of fetal liver stem/progenitor cells differentiation into hepatocytes. Dev Growth Differ 2012 Jun; 54: 605–17. 20 Hasegawa M, Kawai K, Mitsui T et al. The reconstituted
‘humanized liver‘ in TK-NOG mice is mature and functional. Biochem Biophys Res Commun 2011 Feb 18; 405: 405–10. 21 Larrey D, Funck-Brentano C, Breil P et al. Effects of
erythromy-cin on hepatic drug-metabolizing enzymes in humans. Biochem Pharmacol 1983 Mar 15; 32: 1063–8.
22 Andersson T, Miners JO, Veronese ME, Birkett DJ. Identi fica-tion of human liver cytochrome P450 isoforms mediating secondary omeprazole metabolism. Br J Clin Pharmacol 1994 Jun; 37: 597–604.
23 Shirasaka Y, Sager JE, Lutz JD, Davis C, Isoherranen N. Inhibi-tion of CYP2C19 and CYP3A4 by omeprazole metabolites and their contribution to drug–drug interactions. Drug Metab Dispos 2013 Jul; 41: 1414–24.
24 Pernelle K, Le Guevel R, Glaise D et al. Automated detection of hepatotoxic compounds in human hepatocytes using HepaRG cells and image-based analysis of mitochondrial dys-function with JC-1 dye. Toxicol Appl Pharmacol 2011 Aug 1; 254: 256–66.
25 Zeilinger K, Holland G, Sauer IM et al. Time course of primary liver cell reorganization in three-dimensional high-density
bioreactors for extracorporeal liver support: an immunohisto-chemical and ultrastructural study. Tissue Eng 2004 Jul-Aug; 10: 1113–24.
26 Schmelzer E, Mutig K, Schrade P, Bachmann S, Gerlach JC, Zeilinger K. Effect of human patient plasma ex vivo treatment on gene expression and progenitor cell activation of primary human liver cells in multi-compartment 3D perfusion biore-actors for extra-corporeal liver support. Biotechnol Bioeng 2009 Jul 1; 103: 817–27.
27 Nakamura K, Mizutani R, Sanbe A et al. Evaluation of drug toxicity with hepatocytes cultured in a micro-space cell culture system. J Biosci Bioeng 2011 Jul; 111: 78–84.
28 Suemizu H, Hasegawa M, Kawai K et al. Establishment of a humanized model of liver using NOD/Shi-scid IL2Rgnull mice. Biochem Biophys Res Commun 2008 Dec 5; 377: 248–52. 29 Dandri M, Burda MR, Torok E et al. Repopulation of mouse liver with human hepatocytes and in vivo infection with hep-atitis B virus. Hepatology 2001 Apr; 33: 981–8.
30 Mercer DF, Schiller DE, Elliott JF et al. Hepatitis C virus repli-cation in mice with chimeric human livers. Nat Med 2001 Aug; 7: 927–33.
31 Azuma H, Paulk N, Ranade A et al. Robust expansion of human hepatocytes in Fah / /Rag2 / /Il2rg / mice. Nat Biotechnol 2007 Aug; 25: 903–10.