HAL Id: inserm-00806190
https://www.hal.inserm.fr/inserm-00806190
Submitted on 29 Mar 2013HAL is a multi-disciplinary open access archive for the deposit and dissemination of sci-entific research documents, whether they are pub-lished or not. The documents may come from teaching and research institutions in France or abroad, or from public or private research centers.
L’archive ouverte pluridisciplinaire HAL, est destinée au dépôt et à la diffusion de documents scientifiques de niveau recherche, publiés ou non, émanant des établissements d’enseignement et de recherche français ou étrangers, des laboratoires publics ou privés.
inactivity: an individual-participant meta-analysis of up
to 170,000 men and women: the IPD-Work Consortium.
Eleonor Fransson, Katriina Heikkilä, Solja Nyberg, Marie Zins, Hugo
Westerlund, Peter Westerholm, Ari Väänänen, Marianna Virtanen, Jussi
Vahtera, Töres Theorell, et al.
To cite this version:
Eleonor Fransson, Katriina Heikkilä, Solja Nyberg, Marie Zins, Hugo Westerlund, et al.. Job strain as a risk factor for leisure-time physical inactivity: an individual-participant meta-analysis of up to 170,000 men and women: the IPD-Work Consortium.. American Journal of Epidemiology, Oxford University Press (OUP), 2012, 176 (12), pp.1078-89. �10.1093/aje/kws336�. �inserm-00806190�
Systematic Reviews and Meta- and Pooled Analyses
Job Strain as a Risk Factor for Leisure-Time Physical Inactivity: An
Individual-Participant Meta-Analysis of Up to 170,000 Men and Women
The IPD-Work Consortium
Eleonor I. Fransson*, Katriina Heikkilä, Solja T. Nyberg, Marie Zins, Hugo Westerlund,
Peter Westerholm, Ari Väänänen, Marianna Virtanen, Jussi Vahtera, Töres Theorell,
Sakari Suominen, Archana Singh-Manoux, Johannes Siegrist, Séverine Sabia, Reiner Rugulies, Jaana Pentti, Tuula Oksanen, Maria Nordin, Martin L. Nielsen, Michael G. Marmot,
Linda L. Magnusson Hanson, Ida E. H. Madsen, Thorsten Lunau, Constanze Leineweber, Meena Kumari, Anne Kouvonen, Aki Koskinen, Markku Koskenvuo, Anders Knutsson, France Kittel, Karl-Heinz Jöckel, Matti Joensuu, Irene L. Houtman, Wendela E. Hooftman, Marcel Goldberg, Goedele A. Geuskens, Jane E. Ferrie, Raimund Erbel, Nico Dragano, Dirk De Bacquer, Els Clays, Annalisa Casini, Hermann Burr, Marianne Borritz,
Sébastien Bonenfant, Jakob B. Bjorner, Lars Alfredsson, Mark Hamer, G. David Batty, and Mika Kivimäki
* Correspondence to Dr. Eleonor Fransson, Institute of Environmental Medicine, Karolinska Institutet, Box 210, SE-171 77 Stockholm, Sweden (e-mail: eleonor.fransson@ki.se).
Initially submitted January 3, 2012; accepted for publication April 17, 2012.
Unfavorable work characteristics, such as low job control and too high or too low job demands, have been suggested to increase the likelihood of physical inactivity during leisure time, but this has not been verified in large-scale studies. The authors combined individual-level data from 14 European cohort studies (baseline years from 1985–1988 to 2006–2008) to examine the association between unfavorable work characteristics and leisure-time physical inactivity in a total of 170,162 employees (50% women; mean age, 43.5 years). Of these employees, 56,735 were reexamined after 2–9 years. In cross-sectional analyses, the odds for physical inactivity were 26% higher (odds ratio = 1.26, 95% confidence interval: 1.15, 1.38) for employees with high-strain jobs (low control/high demands) and 21% higher (odds ratio = 1.21, 95% confidence interval: 1.11, 1.31) for those with passive jobs (low control/low demands) compared with employees in low-strain jobs (high control/low demands). In prospective analyses restricted to physically active participants, the odds of becoming physically inactive during follow-up were 21% and 20% higher for those with high-strain (odds ratio = 1.21, 95% confidence interval: 1.11, 1.32) and passive (odds ratio = 1.20, 95% confidence interval: 1.11, 1.30) jobs at baseline. These data suggest that unfavorable work characteristics may have a spillover effect on leisure-time physical activity. cohort studies; exercise; physical activity; psychosocial factors; working population
Abbreviations: Belstress, the Belgian Job Stress Study I; CI, confidence interval; DWECS, Danish Work Environment Cohort Study; FPS, Finnish Public Sector Study; Gazel, the Gaz et Electricité Cohort Study; HeSSup, Health and Social Support Study; HNR, Heinz Nixdorf Recall Study; IPAW, Intervention Project on Absence and Well-being; IPD-Work, Individual-Participant-Data Meta-Analysis in Working Populations; OR, odds ratio; POLS, Permanent Onderzoek LeefSituatie; PUMA, Burnout, Motivation, and Job Satisfaction Study; SES, socioeconomic status; SLOSH, Swedish Longitudinal Occupational Survey of Health; WOLF N, Work, Lipids, and Fibrinogen Study Norrland; WOLF S, Work, Lipids, and Fibrinogen Study Stockholm.
the original work is properly cited. November 9, 2012
by guest on March 29, 2013
http://aje.oxfordjournals.org/
Editor’s note: An invited commentary on this article appears on page 1090.
Physical inactivity is associated with increased risk of premature death and morbidity due to chronic disease, in-cluding cardiovascular disease, type 2 diabetes, and some cancers (1–8). According to the World Health Organiza-tion, almost 2 million deaths per year worldwide are attrib-utable to physical inactivity (9). Despite numerous public health campaigns to increase regular physical activity in populations, reductions in sedentary lifestyle have been rel-atively modest. In the United States, for example, the pro-portion of the population that reported no leisure-time physical activity has decreased only 3 percentage points during the last 10 years, from 28% in 1998 to 25% in 2008 (10). For this reason, there is a need for increased under-standing of factors that influence participation in leisure-time physical activities.
It has been hypothesized that stressful jobs characterized by high psychological demands and low control (also known as high-strain jobs) result in fatigue and greater need for recovery, increasing the likelihood of leisure-time passivity and sedentary behavior (11,12). Another hypoth-esis proposes that passive, unchallenging jobs with few demands and little control over work can lead to reduced self-efficacy, which in turn may result in more passive life-styles (11, 12). To date, however, empirical evidence for both hypotheses remains limited. Studies from Finland, Japan, the United States, Canada, the United Kingdom, and Sweden have provided support for a link between job strain and physical inactivity (13–21), although in some studies the association was attenuated after adjustment for covari-ates (14,16,18). In the Whitehall II Study of British civil servants, participants working in passive jobs were particu-larly likely to be physically inactive during their leisure time (22). However, other studies have failed to observe an association between high strain or passive jobs and
leisure-time physical activity (12, 23). Heterogeneity in the
association has also been observed by sex, education, and ethnicity (14,17–19,21).
To better characterize the associations between high-strain or passive jobs and leisure-time physical inactivity, we pooled data from 14 independent European cohort studies including over 170,000 men and women. Our aim was to examine whether leisure-time physical inactivity is more common among employees working in high-strain or passive jobs compared with those in low-strain jobs. As a subset of the participating studies had repeat data on both physical activity and work characteristics, we were also able to examine the temporal order of the association, that is, whether work characteristics predict leisure-time physi-cal activity at follow-up, or, alternatively, if physiphysi-cal activi-ty predicts moving into a high strain or passive job over the follow-up period.
MATERIALS AND METHODS
This study is part of the Individual-Participant-Data Meta-Analysis in Working Populations (IPD-Work) Con-sortium of European cohort studies. Originally established
during the annual Four Centers Meeting in London, No-vember 8, 2008, the collaboration has been joined by new cohort studies since. The overall aim of the IPD-Work Con-sortium is to establish reliable estimates of the effects of psychosocial risk factors at work on chronic disease, mental health, disability, and mortality, based on acquisi-tion and synthesis of extensive individual-level data from multiple published and unpublished studies.
Studies and participants
We pooled data from 14 prospective cohort studies based in 8 European countries: Belgium (the Belgian Job Stress Study I (Belstress)) (24,25); Denmark (Danish Work
Envi-ronment Cohort Study (DWECS) (26), Intervention Project
on Absence and Well-being (IPAW) (27), Burnout,
Motiva-tion, and Job Satisfaction Study (PUMA) (28)); Finland
(Finnish Public Sector Study (FPS) (29), Health and Social Support Study (HeSSup) (30), Still Working (31)); France
(the Gaz et Electricité Cohort Study (Gazel) (32));
Germany (Heinz Nixdorf Recall Study (HNR) (33)); the
Netherlands (Permanent Onderzoek LeefSituatie (POLS)
(34)); Sweden (Swedish Longitudinal Occupational Survey
of Health (SLOSH) (35,36), Work, Lipids, and Fibrinogen
Study Norrland (WOLF N) (37, 38) and Stockholm
(WOLF S) (37,39)); and the United Kingdom (Whitehall
II Study) (40,41). The years for the baseline data collection in the respective studies varied from 1985–1988 (Whitehall II) to 2006–2008 (SLOSH). Details of the design, recruit-ment, and ethical approval for the participating studies are
presented in Web Appendix I available at http://aje.
oxfordjournals.org/. Participants with complete data on leisure-time physical activity, the demand-control measures, sex, and age were included in the cross-sectional analyses in this study, which yielded an analytical sample of 85,132 employed men and 85,030 employed women. The prospec-tive analyses were based on data from 56,735 participants.
Work characteristics
Work characteristics were defined by using the
Demand-Control Model, first proposed by Karasek (42)
and further developed and tested by Karasek and Theorell
(11). A description of the self-administered multiitem
measures of job demands and job control in each partici-pating study has been provided elsewhere (43). Briefly, all questions in the job demands and job control scales had Likert-type response formats. Mean response scores for the job demands items and for the job control items were computed for each participant. We then used the
study-specific median scores as cutpoints for high and low
demands (“high demands” being defined as scores strictly
above the study-specific median score) and high and low
job control (“low control” being defined as scores strictly below the study-specific median score). Four categories of
jobs were defined: 1) low-strain jobs (low demands, high
control); 2) passive jobs (low demands, low control); 3) active jobs (high demands, high control); and 4)
high-strain jobs (high demands, low control). We also
by guest on March 29, 2013
http://aje.oxfordjournals.org/
evaluated the separate associations between job demands or job control and leisure-time physical inactivity using
the study-specific quintiles for job demands and job
control, respectively. Participants with missing data on more than half of the items for job demands or job control were excluded from the analysis (n = 1,793, 1% of the total population).
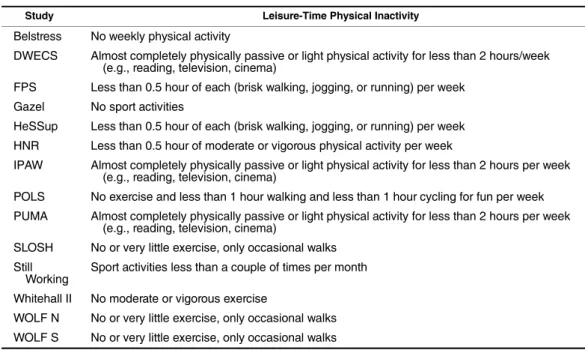
Leisure-time physical inactivity
Physical activity was measured by self-report in all studies. The questions used to assess leisure-time physical activity differed between studies. Some studies had only questions on sports activities and exercise, while for other studies information was also available for other types of leisure-time physical activities, such as walking and cycling. As our main aim was to evaluate the association between work characteristics and leisure-time physical inac-tivity, we constructed a measure of physical inactivity defined as no or very little moderate or vigorous leisure-time physical activity or exercise based on the best avail-able information in each study. Examples of definitions of physical inactivity are“no weekly leisure-time physical ac-tivity,” “no or very little exercise, only occasional walks,”
and “sport activities a few times per year or less.” The
definitions of leisure-time physical inactivity in all the studies included in the analyses are presented in Table1.
Covariates
Sex and age were obtained from 1) either registers or self-reports during a medical examination (DWECS, FPS, Gazel, HNR, IPAW, PUMA, SLOSH, Still Working, WOLF N, and WOLF S) or 2) a questionnaire (Belstress, HeSSup, POLS, and Whitehall II). Age was treated as a continuous variable in the analyses. In addition, we includ-ed socioeconomic status (SES) as a covariate because SES may be related to both physical activity and psychosocial working conditions. SES was based on information on oc-cupation obtained from register data (DWECS, FPS, Gazel, PUMA, and Still Working) or self-reports (Belstress, HNR, IPAW, POLS, SLOSH, WOLF N, WOLF S, Whitehall II). In HeSSup, SES was based on self-reported education. SES was classified as low, intermediate, or high. Self-employed participants and participants with missing data on SES
were categorized as “others.” We included smoking status
as an additional covariate because smoking is considered to be the leading preventable cause of illness, disability, and
premature death, and previous findings suggest that job
strain is associated with current smoking (44). Smoking
Table 1. Definitions of Leisure-Time Physical Inactivity Among the IPD-Work Consortium of European Cohort
Studies (Baseline Years From 1985–1988 to 2006–2008)
Study Leisure-Time Physical Inactivity
Belstress No weekly physical activity
DWECS Almost completely physically passive or light physical activity for less than 2 hours/week
(e.g., reading, television, cinema)
FPS Less than 0.5 hour of each (brisk walking, jogging, or running) per week
Gazel No sport activities
HeSSup Less than 0.5 hour of each (brisk walking, jogging, or running) per week
HNR Less than 0.5 hour of moderate or vigorous physical activity per week
IPAW Almost completely physically passive or light physical activity for less than 2 hours per week
(e.g., reading, television, cinema)
POLS No exercise and less than 1 hour walking and less than 1 hour cycling for fun per week
PUMA Almost completely physically passive or light physical activity for less than 2 hours per week
(e.g., reading, television, cinema)
SLOSH No or very little exercise, only occasional walks
Still Working
Sport activities less than a couple of times per month
Whitehall II No moderate or vigorous exercise
WOLF N No or very little exercise, only occasional walks
WOLF S No or very little exercise, only occasional walks
Abbreviations: Belstress, the Belgian Job Stress Study I; DWECS, Danish Work Environment Cohort Study; FPS, Finnish Public Sector Study; Gazel, the Gaz et Electricité Cohort Study; HeSSup, Health and Social Support Study; HNR, Heinz Nixdorf Recall Study; IPAW, Intervention Project on Absence and Well-being; IPD-Work, individual-participant-data meta-analysis in working populations; POLS, Permanent Onderzoek LeefSituatie; PUMA, Burnout, Motivation, and Job Satisfaction Study; SLOSH, Swedish Longitudinal Occupational Survey of Health; WOLF N, Work, Lipids, and Fibrinogen Study Norrland; WOLF S, Work, Lipids, and Fibrinogen Study Stockholm.
by guest on March 29, 2013
http://aje.oxfordjournals.org/
status was self-reported in all studies and categorized as “never smoker,” “former smoker,” and “current smoker.”
Statistical methods
Individual-level data were available for the following 10 studies: Belstress, FPS, Gazel, HeSSup, HNR, SLOSH, Still Working, Whitehall II, WOLF N, and WOLF S. Syntax and instructions for statistical analysis were pro-vided for the investigators in the other studies (DWECS, IPAW, POLS, and PUMA), and they themselves calculated the study-specific results.
One- and two-stage meta-analyses of
individual-participant data approaches were used (45–47). In the main cross-sectional analysis, we used 2-stage meta-analysis as we wanted to include all available cohort studies but had only aggregate data from 4 cohort studies (DWECS, IPAW,
POLS, and PUMA). Stratified analyses were conducted by
using 1-stage meta-analysis, excluding the 4 studies with only aggregate data.
In the 2-stage meta-analysis of the cross-sectional associ-ations between work characteristics and physical inactivity, effect estimates and their standard errors were estimated by using logistic regression, separately for each study. The
study-specific results were then pooled by random-effects
meta-analysis (48). We calculated summary odds ratios and
their 95% confidence intervals for individuals who were
categorized as having passive, active, or high-strain jobs, comparing them with individuals with low-strain jobs. We adjusted the odds ratios for sex and age and for sex, age,
SES, and smoking. Heterogeneity among study-specific
es-timates was assessed by using the I2statistic (49).
It has been argued that the prevalence ratio is more ap-propriate than the odds ratio when evaluating the cross-sectional association between 2 variables, as the odds ratio
tends to inflate the association if the prevalence of the
outcome is high (50, 51). Therefore, we ran additional
2-stage individual-level meta-analyses using log binomial regression to estimate the pooled prevalence ratios of leisure-time physical inactivity in relation to work charac-teristics in the 10 studies where we had direct access to individual data.
In the 1-stage meta-analysis, we pooled all available in-dividual-level data into 1 data set. To examine the robust-ness of the cross-sectional associations between the work characteristics and physical inactivity, we conducted sub-group analyses separately for men and women; participants aged less than 50 years and those aged 50 years or older; participants from high, intermediate, low, and“other” SES groups; and never smokers, former smokers, and current smokers. We also evaluated the separate effect of job demands and job control on leisure-time physical inactivity,
using study-specific quintiles to categorize job demands
and job control in 1-stage meta-analyses.
In addition, we used 1-stage individual-level meta-analy-sis to examine prospective associations between work char-acteristics and leisure-time physical inactivity in the 6 cohort studies (Belstress, FPS, HeSSup, SLOSH, Whitehall II, and WOLF N; total n = 56,735) in which the work char-acteristics and physical activity measures had been repeated
2–9 years later and we had direct access to the data. In all
studies, the same definition of work characteristics and
physical activity was used at baseline and follow-up. These analyses were based on data from 56,735 participants. In the prospective analyses, we examined whether work char-acteristics at baseline predicted physical inactivity at follow-up in participants who were physically active at baseline, and if work characteristics at baseline predicted physical activity at follow-up in those who were inactive at baseline. To study potential reverse causality, we examined the association between physical inactivity at baseline and the likelihood of having a high-strain job versus having a low-strain, passive, or active job at follow-up among those in non-high-strain jobs at baseline. Corresponding analyses were undertaken to examine the odds of having a passive, active, or low-strain job at follow-up. In these analyses, we fitted a mixed-effects logistic regression model with study as the random effect and age, sex, SES, and smoking as covariates.
To study the effect of sample size on our findings, we
ran sensitivity analysis taking 1% and 10% random samples from the pooled data set of 10 studies where we had access to individual data (n = 132,704).
Study-specific logistic regression models were fitted with PROC GENMOD in SAS, version 9, software (SAS Insti-tute, Inc., Cary, North Carolina) (Belstress, DWECS, FPS, Gazel, HeSSuP, HNR, IPAW, PUMA, SLOSH, Still Working, Whitehall II, WOLF N and WOLF S) or SPSS, version 17, statistical software (SPSS, Inc., Chicago, Illi-nois) (POLS). Meta-analysis was conducted by using R, version 2.11, library Meta (R Foundation for Statistical
Computing, Vienna, Austria). Study-specific log binomial
regression models were also fitted with PROC GENMOD
in SAS, version 9. One-stage meta-analyses were fitted
with SAS, version 9, PROC GLIMMIX.
RESULTS
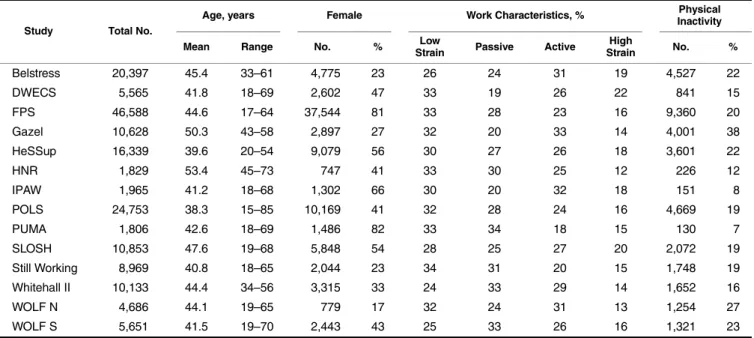
The characteristics of the study population are presented
in Table 2. The mean age of the participants was 43.5
years, and 50% were women. The prevalence of leisure-time physical inactivity was 21% in the total sample, ranging from 7% in PUMA to 38% in Gazel. The propor-tion of participants with a high-strain job varied from 13% in the WOLF N study to 20% in SLOSH, while the preva-lence of passive jobs ranged from 19% in DWECS to 34% in PUMA.
Cross-sectional analyses
The overall prevalence of physical inactivity was 18.6%, 23.5%, 18.9%, and 23.9% among those with low-strain, passive, active, and high-strain jobs, respectively. There was strong evidence in the pooled analyses that participants with high-strain (odds ratio (OR) adjusted for age and
sex = 1.36, 95% confidence interval (CI): 1.25, 1.48) and
passive (OR = 1.34, 95% CI: 1.23, 1.47) jobs were more likely to be physically inactive during leisure time,
com-pared with those working in low-strain jobs (Figure 1).
Further adjustment for SES and smoking attenuated these
by guest on March 29, 2013
http://aje.oxfordjournals.org/
associations, but the odds ratios remained statistically
sig-nificant (OR = 1.26, 95% CI: 1.15, 1.38 and OR = 1.21,
95% CI: 1.11, 1.31, respectively). There was some hetero-geneity between the studies in the meta-analyses of high-strain and passive jobs, I2= 77.5% and 76.7%, respectively
(the study-specific odds ratios are shown in Web Appendix
II, Web Figure 1), supporting the use of a random-effects rather than afixed-effect model. When the analysis was re-stricted to the 10 studies where we had direct access to the data, the sex-, age-, SES-, and smoking-adjusted odds ratios for leisure-time physical inactivity remained virtually the same as in the analysis including all 14 cohorts, with odds ratios of 1.26 (95% CI: 1.13, 1.40), 1.08 (95% CI: 1.01, 1.16), and 1.21 (95% CI: 1.10, 1.34), for the high-strain, active, and passive groups, respectively.
We repeated the 2-stage meta-analysis, estimating
study-specific prevalence ratios using log binomial regression
models and pooling them to give summary prevalence ratios across the 10 studies. These models yielded an age-and sex-adjusted summary prevalence ratio for leisure-time physical inactivity of 1.27 (95% CI: 1.18, 1.37) for high-strain jobs, 1.01 (95% CI: 0.95, 1.07) for active jobs, and 1.27 (95% CI: 1.17, 1.38) for passive jobs, compared with low-strain jobs. Additional adjustment for SES and smoking resulted in prevalence ratios of 1.18 (95% CI: 1.09, 1.28), 1.06 (95% CI: 1.00, 1.12), and 1.15 (95% CI: 1.07, 1.24), respectively.
Table 2. Study Population Characteristics Among the IPD-Work Consortium of European Cohort Studies (Baseline Years From 1985–1988 to
2006–2008)a
Study Total No.
Age, years Female Work Characteristics, % Physical Inactivity Mean Range No. % StrainLow Passive Active StrainHigh No. %
Belstress 20,397 45.4 33–61 4,775 23 26 24 31 19 4,527 22 DWECS 5,565 41.8 18–69 2,602 47 33 19 26 22 841 15 FPS 46,588 44.6 17–64 37,544 81 33 28 23 16 9,360 20 Gazel 10,628 50.3 43–58 2,897 27 32 20 33 14 4,001 38 HeSSup 16,339 39.6 20–54 9,079 56 30 27 26 18 3,601 22 HNR 1,829 53.4 45–73 747 41 33 30 25 12 226 12 IPAW 1,965 41.2 18–68 1,302 66 30 20 32 18 151 8 POLS 24,753 38.3 15–85 10,169 41 32 28 24 16 4,669 19 PUMA 1,806 42.6 18–69 1,486 82 33 34 18 15 130 7 SLOSH 10,853 47.6 19–68 5,848 54 28 25 27 20 2,072 19 Still Working 8,969 40.8 18–65 2,044 23 34 31 20 15 1,748 19 Whitehall II 10,133 44.4 34–56 3,315 33 24 33 29 14 1,652 16 WOLF N 4,686 44.1 19–65 779 17 32 24 31 13 1,254 27 WOLF S 5,651 41.5 19–70 2,443 43 25 33 26 16 1,321 23
Abbreviations: Belstress, the Belgian Job Stress Study I; DWECS, Danish Work Environment Cohort Study; FPS, Finnish Public Sector Study; Gazel, the Gaz et Electricité Cohort Study; HeSSup, Health and Social Support Study; HNR, Heinz Nixdorf Recall Study; IPAW, Intervention Project on Absence and Well-being; IPD-Work, individual-participant-data meta-analysis in working populations; POLS, Permanent Onderzoek LeefSituatie; PUMA, Burnout, Motivation, and Job Satisfaction Study; SLOSH, Swedish Longitudinal Occupational Survey of Health; WOLF N, Work, Lipids, and Fibrinogen Study Norrland; WOLF S, Work, Lipids, and Fibrinogen Study Stockholm.
aParticipants with valid measures on work characteristics as defined by the Job Demand-Control Model, leisure-time physical activity, age,
and sex.
Figure 1. Pooled results from cross-sectional 2-stage
meta-analysis from the IPD-Work Consortium of European cohort studies
(baseline years from 1985–1988 to 2006–2008). Odds ratios for
leisure-time physical inactivity by job category are defined according to the Demand-Control Model as low strain (low demands, high control), passive (low demands, low control), active (high demands, high control), and high strain (high demands, low control). A, adjusted for sex and age (n = 170,162); B, adjusted for sex, age, socioeconomic status, and smoking (n = 163,242). CI, confidence
interval; IPD-Work, individual-participant-data meta-analysis in
working populations; OR, odds ratio.
by guest on March 29, 2013
http://aje.oxfordjournals.org/
To study the robustness of the associations further, we
conducted 1-stage meta-analyses stratified by sex, age,
SES, and smoking. The pattern of higher odds ratios for physical inactivity among those with high-strain or passive jobs was observed across all the subgroups examined (Table3).
When levels of job demands and job control were ana-lyzed separately, a clear association between job control and physical inactivity was observed, with odds for physi-cal inactivity increasing at lower levels of job control. The association between job demands and physical inactivity was weaker, and there was evidence of an association only
in the highest quintile (Web Appendix II, Web Table 1; available at http://aje.oxfordjournals.org/).
Prospective analysis
In the prospective analysis based on data from 6 studies, we observed increased odds of becoming physically inac-tive at follow-up among those who at baseline had high-strain (OR = 1.21, 95% CI: 1.11, 1.32) or passive (OR = 1.20, 95% CI: 1.11, 1.30) jobs compared with those
who had low-strain jobs (Table 4). This analysis was
re-stricted to those who were physically active (i.e., it
Table 3. Cross-sectional Associations Between Work Characteristicsaand Leisure-Time Physical Inactivity in
Different Subgroups Among the IPD-Work Consortium of European Cohort Studies (Baseline Years From 1985–
1988 to 2006–2008)
No. Leisure-Time
Physical Inactivity, % Odds Ratio
b 95% CI
All (n = 132,704)
Low strain 39,903 19 1 Referent
Passive 35,870 25 1.29 1.24, 1.33
Active 35,105 20 1.06 1.02, 1.10
High strain 21,826 25 1.32 1.27, 1.38
Stratified by sex Men (n = 65,043)
Low strain 21,025 21 1 Referent
Passive 15,637 26 1.27 1.21, 1.34
Active 19,623 20 1.05 1.00, 1.11
High strain 8,758 27 1.36 1.28, 1.44
Women (n = 67,661)
Low strain 18,878 18 1 Referent
Passive 20,233 24 1.27 1.21, 1.34
Active 15,482 19 1.08 1.02, 1.14
High strain 13,068 24 1.28 1.21, 1.35
Stratified by age
Age <50 years (n = 86,650)
Low strain 25,830 17 1 Referent
Passive 23,537 23 1.28 1.22, 1.34
Active 23,068 18 1.06 1.01, 1.11
High strain 14,215 23 1.30 1.23, 1.37
Age≥50 years (n = 46,054)
Low strain 14,073 22 1 Referent
Passive 12,333 28 1.28 1.20, 1.35
Active 12,037 23 1.05 0.99, 1.12
High strain 7,611 28 1.34 1.25, 1.43
Stratified by SES Low SES (n = 36,346)
Low strain 8,483 24 1 Referent
Passive 15,267 28 1.23 1.15, 1.31 Active 4,675 24 1.05 0.96, 1.14 High strain 7,921 29 1.31 1.22, 1.41 Table continues by guest on March 29, 2013 http://aje.oxfordjournals.org/ Downloaded from
excluded the physically inactive) at baseline. In a further analysis—this time restricted to those who were physically inactive at baseline—we did not observe any clear associa-tion between work characteristics at baseline and becoming physically active at follow-up.
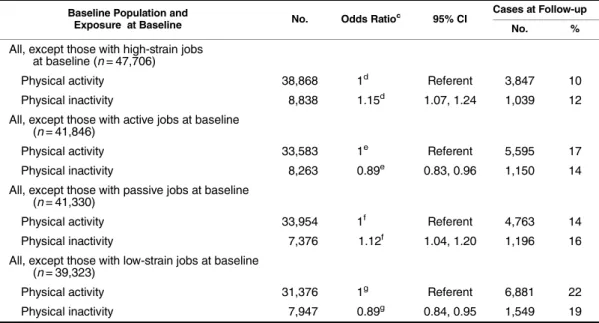
Our test of reverse causality showed physical inactivity at baseline to be associated with slightly increased odds of having a high-strain or passive job and with decreased odds of having an active or low-strain job at follow-up (Table5).
Sensitivity analysis and effect of sample size
Many studies of job strain have been based on sample
sizes of 1,000–3,000; very few include more than 10,000
participants. Figure 2 shows that it is not possible to
observe the association between job strain and physical in-activity in a 1% random sample (n = 1,327) of the pooled data. However, this association becomes significant in the 10% random sample comprising over 10,000 participants
Table 3. Continued
No. Leisure-Time
Physical Inactivity, % Odds Ratio
b 95% CI
Medium SES (n = 63,530)
Low strain 18,777 19 1 Referent
Passive 17,403 22 1.29 1.23, 1.36
Active 15,862 20 1.05 1.00, 1.11
High strain 11,488 23 1.33 1.26, 1.41
High SES (n = 30,026)
Low strain 11,706 17 1 Referent
Passive 2,483 20 1.25 1.11, 1.40
Active 13,801 18 1.12 1.05, 1.20
High strain 2,036 20 1.31 1.16, 1.47
Other SES (n = 2,802)
Low strain 937 19 1 Referent
Passive 717 26 1.36 1.07, 1.73
Active 767 23 1.20 0.95, 1.52
High strain 381 30 1.69 1.28, 2.23
Stratified by smoking Never smokers (n = 57,849)
Low strain 17,285 17 1 Referent
Passive 15,124 22 1.34 1.27, 1.43
Active 15,970 18 1.11 1.05, 1.18
High strain 9,470 23 1.41 1.32, 1.50
Former smokers (n = 45,076)
Low strain 14,359 18 1 Referent
Passive 11,910 22 1.22 1.15, 1.30
Active 11,996 18 1.02 0.95, 1.08
High strain 6,811 22 1.25 1.17, 1.35
Current smokers (n = 29,779)
Low strain 8,259 26 1 Referent
Passive 8,836 32 1.29 1.20, 1.38
Active 7,139 26 1.04 0.97, 1.12
High strain 5,545 32 1.29 1.20, 1.40
Abbreviations: CI, confidence interval; IPD-Work, individual-participant-data meta-analysis in working populations; SES, socioeconomic status.
aWork characteristics defined according to the Demand-Control Model as low strain (low demands, high control),
passive (low demands, low control), active (high demands, high control), and high strain (high demands, low control).
bAdjusted for age, sex, SES, and smoking. Study treated as random effect in the logistic model.
by guest on March 29, 2013
http://aje.oxfordjournals.org/
(n = 13,270). When repeating the random sampling proce-dure 5 times, it was observed that the estimated odds ratios vary substantially over the 5 different 1% samples. When using 10% samples, the estimates start to stabilize, but
several estimates are still nonsignificant, as compared
with the full sample size (Web Appendix II, Web Figures 2 and 3).
DISCUSSION
We found robust cross-sectional and prospective associa-tions between unfavorable work characteristics and
leisure-time physical inactivity, with 21%–26% higher odds for
inactivity among participants working in high-strain and passive jobs compared with those with low-strain jobs. Pro-spective analyses showed that high-strain and passive jobs also predicted change from a physically active to an inac-tive lifestyle. We found some support for a bidirectional as-sociation, as leisure-time physical inactivity at baseline to some extent predicted change in work characteristics; for example, physically inactive employees were more likely to
move into a high-strain or passive job compared with their physically active counterparts.
Individual-level meta-analysis of published and unpub-lished data, such as that used in the present study, is recog-nized as a strong study design as it reduces the possibility of publication bias that can limit the generalizability of evi-dence from single studies and literature-based meta-analy-ses (52). Our cross-sectional results are based on the largest data set to date on work characteristics (n > 170,000) and are in agreement with those of several previous studies. For example, an increased likelihood of low leisure-time physi-cal activity among those with high strain and passive jobs compared with those in low-strain jobs was observed in
3,900 Swedish men (21) and 3,500 male white-collar
workers in Canada (19), although no statistically significant associations were observed among women in these studies.
Bennett et al. (17) found that people who reported job
strain spent approximately 1 hour less in physical activities per week, compared with those who did not report job strain in a sample of 1,700 white individuals in Massachu-setts. Furthermore, in a small study (n = 241) by Payne et al. (20), it was observed that employees reporting high strain did less exercise than employees in low-strain jobs (20). Choi et al. found that low-strain and active jobs were associated with a more physically active leisure-time com-pared with passive and high-strain jobs in 2,000 middle-aged American workers (18); Lallukka et al. (14) observed that a physically active leisure-time was more common in those with low strain and active jobs among 1,200 Finnish men and in those with low-strain jobs among the 5,000 Finnish women. However, in the latter 2 studies, the associ-ations did not reach statistical significance at conventional levels in multivariable-adjusted models.
We observed similar odds ratios for physical inactivity in the high-strain and passive job groups. High-strain and passive jobs are both characterized by low control and, indeed, a subsidiary analysis revealed that the association between job control and leisure-time physical activity is much stronger than the association between job demands and physical activity. This is in agreement with some previ-ous studies linking low control to a low level of physical activity (18, 53, 54), and it indicates that the association between work characteristics and leisure-time physical inac-tivity may be driven by the control dimension rather than
by job demands. Our findings suggest that it makes little
difference whether low control is combined with either high job demands (representing job strain) or low job demands (representing passive work).
Some earlier studies have failed to find an association
between work characteristics and physical activity (12,23).
This inconsistency may be due to different definitions of
physical activity but also to differences in the categoriza-tion of the psychosocial work characteristics. Furthermore, the smaller sample sizes in previous studies are likely to have introduced random error into the estimates, resulting in insufficient statistical power to detect relatively weak as-sociations, such as those observed in the present meta-anal-ysis (Figure2; Web Appendix II).
Longitudinal data from 6 of the participating studies pro-vided us with the opportunity to analyze temporal aspects
Table 4. Prospective Associations Between Work Characteristicsa
at Baseline and Leisure-Time Physical Activity or Inactivity at Follow-up Among the IPD-Work Consortium of European Cohort
Studies (Baseline Years From 1985–1988 to 2006–2008)b
Baseline Population and Exposure at Baseline No. Odds Ratioc 95% CI Cases at Follow-up No. % Physical activity at baseline (n = 45,927)
Low strain 14,551 1d Referent 1,685 12
Passive 11,973 1.20d 1.11, 1.30 1,806 15 Active 12,334 1.07d 0.99, 1.15 1,483 12 High strain 7,059 1.21d 1.11, 1.32 1,049 15 Physical inactivity at baseline (n = 10,808)
Low strain 2,861 1e Referent 1,416 49
Passive 3,432 1.00e 0.90, 1.11 1,634 48
Active 2,545 1.10e 0.98, 1.22 1,315 52
High strain 1,970 0.98e 0.87, 1.10 946 48
Abbreviations: Belstress, the Belgian Job Stress Study I; CI, confidence interval; IPD-Work, individual-participant-data meta-analysis in working populations.
aWork characteristics defined according to the Demand-Control
Model as low strain (low demands, high control), passive (low demands, low control), active (high demands, high control), and high strain (high demands, low control).
bStudies and follow-up times: Belstress (4
–8 years), Finnish
Public Sector Study (2–4 years), Health and Social Support Study
(5 years), Swedish Longitudinal Occupational Survey of Health (2
years), Whitehall II Study (3–9 years), and Work, Lipids, and
Fibrinogen Study Norrland (3–7 years).
cAdjusted for age, sex, socioeconomic status, and smoking.
dOutcome at follow-up: physical inactivity.
eOutcome at follow-up: physical activity.
by guest on March 29, 2013
http://aje.oxfordjournals.org/
of the link between work characteristics and leisure-time physical activity. This is in contrast to the vast majority of previous studies that have been based on cross-sectional data. Our main results support the idea that unfavorable work characteristics affect leisure-time physical activity. However, the association might be bidirectional because
leisure-time physical inactivity also predicted, albeit
weakly, adverse changes in work characteristics during
follow-up. Certain personality traits may influence both
participation in physical activity and the probability of having a job with more favorable characteristics. In a Finnish study, for example, it was observed that sustained involvement in physical activity in adolescence and young adult age was associated with reduced likelihood of report-ing high strain jobs in early workreport-ing life (15,55), an asso-ciation that was partly explained by personality traits (55).
This meta-analysis also has some limitations. First, data were based on multiexposure-multioutcome cohort studies
that were not specifically designed to measure the impact
of work characteristics on physical activity. Second, al-though we used a validated measure of work characteristics harmonized across all the studies (43), the number of items
and the wording of measures varied somewhat between the studies included. This may be one source of the heteroge-neity observed between studies and one which may lead to some over- or underestimation of the magnitude of the as-sociations. Furthermore, leisure-time physical activity was self-reported in all the studies, and this may have given rise to a degree of misclassification. However, we believe it is
reasonable to assume that these misclassifications were
largely independent of the work characteristics and, thus, if they had any effect, would rather attenuate than inflate the associations investigated in our study. Third, we observed no differences in the association between work characteris-tics and leisure-time physical activity by sex, age, SES, smoking status, or time of the study, but further research is needed to examine whether issues not assessed in this meta-analysis, such as social relations, physically demand-ing work, or sedentary work, economic circumstances, cultural contexts, and length of exposure to work character-istics, might modify this association. Fourth, our data were obtained from studies conducted in Scandinavia, Continen-tal Europe, and the United Kingdom; it is unclear whether
these findings are generalizable to other countries and
Table 5. Prospective Associations Between Leisure-Time Physical Activity or Inactivity at Baseline and Work
Characteristicsaat Follow-up Among the IPD-Work Consortium of European Cohort Studies (Baseline Years From
1985–1988 to 2006–2008)b
Baseline Population and
Exposure at Baseline No. Odds Ratio
c 95% CI Cases at Follow-up
No. %
All, except those with high-strain jobs at baseline (n = 47,706)
Physical activity 38,868 1d Referent 3,847 10
Physical inactivity 8,838 1.15d 1.07, 1.24 1,039 12
All, except those with active jobs at baseline (n = 41,846)
Physical activity 33,583 1e Referent 5,595 17
Physical inactivity 8,263 0.89e 0.83, 0.96 1,150 14
All, except those with passive jobs at baseline (n = 41,330)
Physical activity 33,954 1f Referent 4,763 14
Physical inactivity 7,376 1.12f 1.04, 1.20 1,196 16
All, except those with low-strain jobs at baseline (n = 39,323)
Physical activity 31,376 1g Referent 6,881 22
Physical inactivity 7,947 0.89g 0.84, 0.95 1,549 19
Abbreviations: Belstress, the Belgian Job Stress Study I; CI, confidence interval; IPD-Work, individual-participant-data meta-analysis in working populations.
a Work characteristics defined according to the Demand-Control Model as low strain (low demands, high
control), passive (low demands, low control), active (high demands, high control), and high strain (high demands, low control).
bStudies and follow-up times: Belstress (4
–8 years), Finnish Public Sector Study (2–4 years), Health and Social
Support Study (5 years), Swedish Longitudinal Occupational Survey of Health (2 years), Whitehall II Study (3–9
years), and Work, Lipids, and Fibrinogen Study Norrland (3–7 years).
cAdjusted for age, sex, socioeconomic status, and smoking.
dOutcome at follow-up: high-strain job.
eOutcome at follow-up: active job.
f Outcome at follow-up: passive job.
gOutcome at follow-up: low-strain job.
by guest on March 29, 2013
http://aje.oxfordjournals.org/
regions, such as Southern Europe, the United States, and Asia.
In conclusion, results from pooled data from over 170,000 participants in 14 European cohort studies provid-ed consistent support for the hypothesis that unfavorable work characteristics have a spill-over effect on leisure-time physical activity. These results suggest that interventions to
increase physical activity in the population may benefit
from taking workplace factors into account.
ACKNOWLEDGMENTS
Author affiliations: Institute of Environmental Medicine,
Karolinska Institutet, Stockholm, Sweden (Eleonor
I. Fransson, Lars Alfredsson); School of Health Sciences,
Jönköping University, Jönköping, Sweden (Eleonor
I. Fransson); Stress Research Institute, Stockholm University, Stockholm, Sweden (Eleonor I. Fransson, Hugo Wester-lund, Töres Theorell, Linda L. Magnusson Hanson, Con-stanze Leineweber); Finnish Institute of Occupational Health, Helsinki and Turku, Finland (Katriina Heikkilä, Solja T. Nyberg, Ari Väänänen, Marianna Virtanen, Jussi Vahtera, Jaana Pentti, Tuula Oksanen, Aki Koskinen, Matti Joensuu, Mika Kivimäki); Versailles-Saint Quentin Univer-sity, Versailles, France (Marie Zins, Marcel Goldberg, Sébastien Bonenfant); Centre for Research in Epidemiology
and Population Health, Institut National de la Santé et de la Recherche Médicale U1018, Villejuif, France (Marie Zins,
Archana Singh-Manoux, Marcel Goldberg, Sébastien
Bonenfant); Department of Epidemiology and Public Health, University College London, London, United Kingdom (Hugo Westerlund, Archana Singh-Manoux, Séverine Sabia, Michael G. Marmot, Meena Kumari, Jane E. Ferrie, Mark Hamer, G. David Batty, Mika Kivimäki); Department of Occupational and Environmental Medicine, Uppsala University, Uppsala, Sweden (Peter Westerholm); Department of Public Health, University of Turku, Turku, Finland (Jussi Vahtera, Sakari Suominen); Turku Universi-ty Hospital, Turku, Finland (Jussi Vahtera); Folkhälsan Research Center, Helsinki, Finland (Sakari Suominen); Department of Medical Sociology, University of Düssel-dorf, DüsselDüssel-dorf, Germany (Johannes Siegrist); National Research Center for the Working Environment, Copenha-gen, Denmark (Reiner Rugulies, Ida E. H. Madsen, Jakob B. Bjorner); Department of Public Health and Department of Psychology, University of Copenhagen, Copenhagen, Denmark (Reiner Rugulies); Department of Public Health and Clinical Medicine, Occupational and Environmental
Medicine, Umeå University, Umeå, Sweden (Maria
Nordin); Department of Occupational and Environmental Medicine, Bispebjerg University Hospital, Copenhagen, Denmark (Martin L. Nielsen, Marianne Borritz); Institute for Medical Informatics, Biometry, and Epidemiology, Uni-versity Duisburg-Essen, Essen, Germany (Thorsten Lunau,
Figure 2. Estimated odds ratios and 95% confidence intervals for leisure-time physical inactivity in low-strain (L), passive (P), active (A), and
high-strain (H) jobs based on different sample sizes from the IPD-Work Consortium of European cohort studies (baseline years from 1985–1988
to 2006–2008). Low-strain jobs are set as the referent category. The odds ratios are adjusted for sex, age, socioeconomic status, and smoking.
A, 1% random sample (n = 1,327); B, 10% random sample (n = 13,270); C, total sample (n = 132,704). IPD-Work, individual-participant-data meta-analysis in working populations.
by guest on March 29, 2013
http://aje.oxfordjournals.org/
Karl-Heinz Jöckel, Nico Dragano); School of Sociology, Social Policy, & Social Work, Queen’s University Belfast, Belfast, United Kingdom (Anne Kouvonen); Warsaw School of Social Sciences and Humanities, Wroclaw, Poland (Anne Kouvonen); Department of Public Health, University of Helsinki, Helsinki, Finland (Markku Kosken-vuo); Department of Health Sciences, Mid Sweden Univer-sity, Sundsvall, Sweden (Anders Knutsson); School of Public Health, Université libre de Bruxells, Brussels, Belgium (France Kittel, Annalisa Casini); Netherlands
Or-ganisation for Applied Scientific Research TNO,
Hoofd-dorp, the Netherlands (Irene L. Houtman, Wendela E. Hooftman, Goedele A. Geuskens); School of Social and Community Medicine, University of Bristol, Bristol, United Kingdom (Jane E. Ferrie); Department of Cardiolo-gy, West-German Heart Center Essen, University Duis-burg-Essen, Essen, Germany (Raimund Erbel); Department of Public Health, Ghent University, Ghent, Belgium (Dirk De Bacquer, Els Clays); and Federal Institute for Occupa-tional Safety and Health, Berlin, Germany (Hermann Burr). Authors’ contribution: All authors participated in design-ing the study, generatdesign-ing hypotheses, interpretdesign-ing the data, and writing and critically reviewing the paper. Eleonor I. Fransson and Mika Kivimäki analyzed the data and wrote thefirst draft of the paper.
The IPD-Work Consortium is supported by the European Union-based New and Emerging Risks in Occupational Safety and Health, anticipating and dealing with change in the workplace through coordination of the occupational safety and health risk research (NEW OSH ERA) research program (funded by the Finnish Work Environment Fund, the Swedish Research Council for Working Life and Social Research, the German Social Accident Insurance, the Danish National Research Centre for the Working Environment); the Academy of Finland (grant 132944); the BUPA Foundation (grant 22094477); and the Ministry of Social Affairs and Employment, the Netherlands. The Heinz Nixdorf Recall Study is funded by the Heinz Nixdorf Foundation, Germany, the German Ministry of Education and Science (BMBF), and the German Research Foundation (DFG). German National Accident Insurance (DGUV) supports analyses in the frame of the NEW OSH ERA project. The Dutch contribution (Per-manent Onderzoek LeefSituatie) was funded by the Ministry of Social Affairs and Employment, the Netherlands. Eleonor I. Fransson was supported by the Swedish Council for Working Life and Social Research (grants 2009-2126, 2010-1823). David G. Batty is a Wellcome Trust Fellow.
Consortium funders had no role in the study design, data collection and analysis, or writing of the manuscript.
Preliminaryfindings from this study were presented at the PARG Symposium: Research on Physical Activity and Health in London: from Laboratory to Environmental and Population Studies, London, United Kingdom, November 28, 2011.
Conflict of interest: none declared.
REFERENCES
1. Hu G, Tuomilehto J, Silventoinen K, et al. The effects of physical activity and body mass index on cardiovascular,
cancer and all-cause mortality among 47 212 middle-aged Finnish men and women. Int J Obes (Lond). 2005;29(8): 894–902.
2. Trolle-Lagerros Y, Mucci LA, Kumle M, et al. Physical activity as a determinant of mortality in women. Epidemiology. 2005;16(6):780–785.
3. Sofi F, Capalbo A, Cesari F, et al. Physical activity during leisure time and primary prevention of coronary heart disease: an updated meta-analysis of cohort studies. Eur J Cardiovasc Prev Rehabil. 2008;15(3):247–257.
4. Nocon M, Hiemann T, Muller-Riemenschneider F, et al. Association of physical activity with all-cause and cardiovascular mortality: a systematic review and meta-analysis. Eur J Cardiovasc Prev Rehabil. 2008;15(3): 239–246.
5. Gill JM, Cooper AR. Physical activity and prevention of type 2 diabetes mellitus. Sports Med. 2008;38(10): 807–824.
6. Monninkhof EM, Elias SG, Vlems FA, et al. Physical activity and breast cancer: a systematic review. Epidemiology. 2007;18(1):137–157.
7. Voskuil DW, Monninkhof EM, Elias SG, et al. Physical activity and endometrial cancer risk, a systematic review of current evidence. Cancer Epidemiol Biomarkers Prev. 2007;16(4):639–648.
8. Harriss DJ, Atkinson G, Batterham A, et al. Lifestyle factors and colorectal cancer risk (2): a systematic review and meta-analysis of associations with leisure-time physical activity. Colorectal Dis. 2009;11(7):689–701.
9. World Health Organization. The World Health Report: 2002: Reducing the Risks, Promoting Healthy Life. Geneva, Switzerland: World Health Organization; 2002.
10. Centers for Disease Control and Prevention. Physical activity statistics: 1988–2008 no leisure-time physical activity trend chart. Atlanta, GA: Centers for Disease Control and Prevention; 2010. (http://www.cdc.gov/nccdphp/dnpa/ physical/stats/leisure_time.htm). (Accessed September 13, 2011).
11. Karasek R, Theorell T. Healthy Work: Stress, Productivity and the Reconstruction of Working Life. New York, NY: Basic Books, Inc; 1990.
12. Landsbergis PA, Schnall PL, Deitz DK, et al. Job strain and health behaviors: results of a prospective study. Am J Health Promot. 1998;12(4):237–245.
13. Kouvonen A, Kivimaki M, Elovainio M, et al. Job strain and leisure-time physical activity in female and male public sector employees. Prev Med. 2005;41(2):532–539.
14. Lallukka T, Sarlio-Lahteenkorva S, Roos E, et al. Working conditions and health behaviours among employed women and men: the Helsinki Health Study. Prev Med. 2004; 38(1):48–56.
15. Yang X, Telama R, Hirvensalo M, et al. The benefits of sustained leisure-time physical activity on job strain. Occup Med (Lond). 2010;60(5):369–375.
16. Tsutsumi A, Kayaba K, Yoshimura M, et al. Association between job characteristics and health behaviors in Japanese rural workers. Int J Behav Med. 2003;10(2):125–142. 17. Bennett GG, Wolin KY, Avrunin JS, et al. Does race/ethnicity
moderate the association between job strain and leisure time physical activity? Ann Behav Med. 2006;32(1):60–67. 18. Choi B, Schnall PL, Yang H, et al. Psychosocial working
conditions and active leisure-time physical activity in middle-aged US workers. Int J Occup Med Environ Health. 2010; 23(3):239–253.
19. Brisson C, Larocque B, Moisan J, et al. Psychosocial factors at work, smoking, sedentary behavior, and body mass index:
by guest on March 29, 2013
http://aje.oxfordjournals.org/
a prevalence study among 6995 white collar workers. J Occup Environ Med. 2000;42(1):40–46.
20. Payne N, Jones F, Harris PR. The impact of job strain on the predictive validity of the theory of planned behaviour: an investigation of exercise and healthy eating. Br J Health Psychol. 2005;10( pt 1):115–131.
21. Wemme KM, Rosvall M. Work related and non-work related stress in relation to low leisure time physical activity in a Swedish population. J Epidemiol Community Health. 2005; 59(5):377–379.
22. Gimeno D, Elovainio M, Jokela M, et al. Association between passive jobs and low levels of leisure-time physical activity: the Whitehall II cohort study. Occup Environ Med. 2009;66(11):772–776.
23. van Loon AJ, Tijhuis M, Surtees PG, et al. Lifestyle risk factors for cancer: the relationship with psychosocial work environment. Int J Epidemiol. 2000;29(5):785–792. 24. Coetsier P, De Backer G, De Corte W, et al. Etude belge du
stress au travail: aperçu du modèle de recherche et des outils d’investigation. (In French). Rev Psychol Psychom. 1996; 17(4):17–35.
25. Clays E, De Bacquer D, Leynen F, et al. Long-term changes in the perception of job characteristics: results from the Belstress II—study. J Occup Health. 2006;48(5):339–346. 26. Burr H, Bjorner JB, Kristensen TS, et al. Trends in the
Danish work environment in 1990–2000 and their
associations with labor-force changes. Scand J Work Environ Health. 2003;29(4):270–279.
27. Nielsen ML, Kristensen TS, Smith-Hansen L. The Intervention Project on Absence and Well-being (IPAW): design and results from the baseline of a 5-year study. Work & Stress. 2002;16(3):191–206.
28. Borritz M, Rugulies R, Christensen KB, et al. Burnout as a predictor of self-reported sickness absence among human service workers: prospectivefindings from three year follow up of the PUMA study. Occup Environ Med. 2006;63(2): 98–106.
29. Kivimaki M, Lawlor DA, Davey Smith G, et al.
Socioeconomic position, co-occurrence of behavior-related risk factors, and coronary heart disease: the Finnish Public Sector Study. Am J Public Health. 2007;97(5):874–879. 30. Korkeila K, Suominen S, Ahvenainen J, et al. Non-response
and related factors in a nation-wide health survey. Eur J Epidemiol. 2001;17(11):991–999.
31. Vaananen A, Murray M, Koskinen A, et al. Engagement in cultural activities and cause-specific mortality: prospective cohort study. Prev Med. 2009;49(2-3):142–147.
32. Goldberg M, Leclerc A, Bonenfant S, et al. Cohort profile: the GAZEL Cohort Study. Int J Epidemiol. 2007;36(1):32–39. 33. Stang A, Moebus S, Dragano N, et al. Baseline recruitment and
analyses of nonresponse of the Heinz Nixdorf Recall Study: identifiability of phone numbers as the major determinant of response. Eur J Epidemiol. 2005;20(6):489–496.
34. de Groot W, Dekker R. The Dutch System of Official Social Surveys. EuReporting Working Paper No. 30. Mannheim, Germany: Mannheim Centre for European Social Research; 2001.
35. Hasson D, Theorell T, Westerlund H, et al. Prevalence and characteristics of hearing problems in a working and non-working Swedish population. J Epidemiol Community Health. 2010;64(5):453–460.
36. Magnusson Hanson LL, Theorell T, Oxenstierna G, et al. Demand, control and social climate as predictors of emotional exhaustion symptoms in working Swedish men and women. Scand J Public Health. 2008;36(7):737–743.
37. Alfredsson L, Hammar N, Fransson E, et al. Job strain and major risk factors for coronary heart disease among employed males and females in a Swedish study on work, lipids and fibrinogen. Scand J Work Environ Health. 2002;28(4):238–248. 38. Åkerstedt T, Nordin M, Alfredsson L, et al. Predicting changes in sleep complaints from baseline values and changes in work demands, work control, and work preoccupation—The WOLF-Project. Sleep Med. 2012;13(1):73–80.
39. Peter R, Alfredsson L, Hammar N, et al. High effort, low reward, and cardiovascular risk factors in employed Swedish men and women: baseline results from the WOLF Study. J Epidemiol Community Health. 1998;52(9):540–547. 40. Marmot MG, Smith GD, Stansfeld S, et al. Health
inequalities among British civil servants: the Whitehall II Study. Lancet. 1991;337(8754):1387–1393.
41. Marmot M, Brunner E. Cohort profile: the Whitehall II Study. Int J Epidemiol. 2005;34(2):251–256.
42. Karasek R. Job demands, job decision latitude, and mental strain: implications for job redesign. Adm Sci Q. 1979; 24(2):285–308.
43. Fransson EI, Nyberg ST, Heikkila K, et al. Comparison of alternative versions of the job demand-control scales in 17 European cohort studies: the IPD-Work Consortium. BMC Public Health. 2012;12(1):62. (doi:10.1186/1471-2458-12-62). 44. Heikkilä K, Nyberg ST, Fransson EI, et al. Job strain and
tobacco smoking: an individual-participant data meta-analysis of 166 130 adults in 15 European studies. PLoS One. 2012; 7(7):e35463. (doi:10.1371/journal.pone.0035463).
45. Riley RD, Lambert PC, Abo-Zaid G. Meta-analysis of individual participant data: rationale, conduct, and reporting. BMJ. 2010;340:c221. (doi:10.1136/bmj.c221).
46. Simmonds MC, Higgins JP, Stewart LA, et al. Meta-analysis of individual patient data from randomized trials: a review of methods used in practice. Clin Trials. 2005;2(3):209–217. 47. Stewart L, Tierney J, Clarke M. Chapter 18: reviews of
individual patient data. In: Higgins J, Green S, eds. Cochrane Handbook for Systematic Reviews of Interventions, version 5.0.1 (updated September 2008). Chichester, United Kingdom: The Cochrane Collaboration; 2008:18.1–18.7. 48. Altman DG, Egger M, Davey Smith G. Systematic Reviews in
Health Care Meta-Analysis in Context. London, United Kingdom: BMJ Books; 2001.
49. Higgins JP, Thompson SG, Deeks JJ, et al. Measuring inconsistency in meta-analyses. BMJ. 2003;327(7414): 557–560.
50. Spiegelman D, Hertzmark E. Easy SAS calculations for risk or prevalence ratios and differences. Am J Epidemiol. 2005;162(3):199–200.
51. Thompson ML, Myers JE, Kriebel D. Prevalence odds ratio or prevalence ratio in the analysis of cross sectional data: what is to be done? Occup Environ Med. 1998;55(4):272–277. 52. Stewart LA, Parmar MK. Meta-analysis of the literature or of
individual patient data: is there a difference? Lancet. 1993;341(8842):418–422.
53. Hellerstedt WL, Jeffery RW. The association of job strain and health behaviours in men and women. Int J Epidemiol. 1997;26(3):575–583.
54. Smith PM, Frank JW, Mustard CA, et al. Examining the relationships between job control and health status: a path analysis approach. J Epidemiol Community Health. 2008; 62(1):54–61.
55. Yang X, Telama R, Hirvensalo M, et al. Sustained involvement in youth sports activities predicts reduced chronic job strain in early midlife. J Occup Environ Med. 2010;52(12):1154–1159.
by guest on March 29, 2013
http://aje.oxfordjournals.org/