HAL Id: hal-02533255
https://hal.sorbonne-universite.fr/hal-02533255
Submitted on 6 Apr 2020
HAL is a multi-disciplinary open access
archive for the deposit and dissemination of
sci-entific research documents, whether they are
pub-lished or not. The documents may come from
teaching and research institutions in France or
abroad, or from public or private research centers.
L’archive ouverte pluridisciplinaire HAL, est
destinée au dépôt et à la diffusion de documents
scientifiques de niveau recherche, publiés ou non,
émanant des établissements d’enseignement et de
recherche français ou étrangers, des laboratoires
publics ou privés.
Functional brain connectome in posterior cortical
atrophy
Raffaella Migliaccio, Federica Agosta, Silvia Basaia, Camilla Cividini,
Marie-Odile Habert, Aurélie Kas, Maxime Montembeault, Massimo Filippi
To cite this version:
Raffaella Migliaccio, Federica Agosta, Silvia Basaia, Camilla Cividini, Marie-Odile Habert, et al..
Functional brain connectome in posterior cortical atrophy. Neuroimage-Clinical, Elsevier, 2020, 25,
pp.102100. �10.1016/j.nicl.2019.102100�. �hal-02533255�
Contents lists available atScienceDirect
NeuroImage: Clinical
journal homepage:www.elsevier.com/locate/ynicl
Functional brain connectome in posterior cortical atrophy
Ra
ffaella Migliaccio
a,b,⁎, Federica Agosta
c, Silvia Basaia
c, Camilla Cividini
c,
Marie-Odile Habert
d,e, Aurélie Kas
d,e, Maxime Montembeault
f, Massimo Filippi
c,gaFrontLab, INSERM U 1127, CNRS UMR 7225, Sorbonne Universités, and Université Pierre et Marie Curie-Paris 6, UMR S1127, Institut du Cerveau et de la Moelle
épinière (ICM), Pitié-Salpêtrière hospital, Paris, France
bInstitut de la mémoire et de la maladie d’Alzheimer, IM2A, Reference Centre for Rare dementias and Early Onset Alzheimer’s disease, Neurology Departement,
Pitié-Salpêtrière hospital, Paris, France
cNeuroimaging Research Unit, Institute of Experimental Neurology, Division of Neuroscience, San Raffaele Scientific Institute, Vita-Salute San Raffaele University, Milan,
Italy
dDepartment of Nuclear Medicine, Pitié-Salpêtrière hospital, Paris, France eLIB, Inserm U1146, Université Pierre et Marie Curie, Paris 6, Paris, France
fMemory & Aging Center, Deparment of Neurology, University of California in San Francisco, San Francisco, United-States gDepartment of Neurology, San Raffaele Scientific Institute, Vita-Salute San Raffaele University, Milan, Italy
A R T I C L E I N F O
Keywords:
Posterior cortical atrophy (PCA) Human connectome
Functional connectivity Graph analysis
A B S T R A C T
This study investigated the functional brain connectome architecture in patients with Posterior Cortical Atrophy (PCA). Eighteen PCA patients and 29 age- and sex- matched healthy controls were consecutively recruited in a specialized referral center. Participants underwent neurologic examination, cerebrospinal fluid (CSF) ex-amination for Alzheimer's disease (AD) biomarkers, cognitive assessment, and brain MRI. For a smaller subset of participants, FDG-PET examination was available. We assessed topological brain network properties and re-gional functional connectivity as well as intra- and inter-hemispheric connectivity, using graph analysis and connectomics. Supplementary analyses were performed to explore the association between the CSF AD profile and the connectome status, and taking into account hypometabolic, atrophic, and spared regions (nodes). PCA patients showed diffuse functional connectome alterations at both global and regional level, as well as a con-nectivity breakdown between the posterior brain nodes. They had a widespread loss of both intra- and inter-hemispheric connections, exceeding the structural damage, and including the frontal connections. In PCA, connectome alterations were identified in all the brain nodes irrespectively of their structural and metabolic classification and were associated with a connectivity breakdown between damaged and spared areas. Taken together, thesefindings suggest the potentially high sensitivity of graph-analysis and connectomic in capturing the progression and maybe early signs of neurodegeneration in PCA patients.
1. Introduction
Posterior Cortical Atrophy (PCA) is a rare neurodegenerative con-dition, very often associated with Alzheimer's disease (AD) pathology (Montembeault et al., 2018a;2018b;Tang-Wai et al., 2004). Previous studies have explored the patterns of gray matter (GM) atrophy, the distribution of hypoperfusion and hypometabolism, as well as the presence of white matter (WM) damage and functional connectivity alterations in PCA (Agosta et al., 2018;Caso et al., 2015;Kas et al., 2011; Lehmann et al., 2015; Migliaccio et al., 2012a, 2009, 2012b;
Migliaccio et al., 2012c,2016;Ossenkoppele et al., 2016). Altogether, these studies have shown that in PCA patients brain damage is focal and posterior (Kas et al., 2011;Migliaccio et al., 2009;Ossenkoppele et al.,
2016) and WM pathways involvement highly contributes to the clinical profile (Caso et al., 2015;Migliaccio et al., 2012a,2012b,2012c). They have also highlighted functional connectivity alterations, in particular in the visual and default mode networks (Agosta et al., 2018;
Lehmann et al., 2015;Migliaccio et al., 2016). In some cases, functional magnetic resonance imaging (fMRI) studies suggested the existence of possible functional compensatory mechanisms supported, in particular, by the relatively intact anterior brain regions (Agosta et al., 2018;
Migliaccio et al., 2016).
In the last years, the brain connectivityfield has largely turned to graph (or network) theory, an analytic language for describing complex networks (Bullmore and Sporns, 2009). Graph analysis is a new way to unravel the complexity of structural and functional bases of clinical and
https://doi.org/10.1016/j.nicl.2019.102100
Received 21 June 2019; Received in revised form 17 October 2019; Accepted 18 November 2019
⁎Corresponding author at: ICM, 47 bd de l'hopital, 75013 Paris, France.
E-mail address:[email protected](R. Migliaccio).
Available online 20 November 2019
2213-1582/ © 2019 The Authors. Published by Elsevier Inc. This is an open access article under the CC BY-NC-ND license (http://creativecommons.org/licenses/BY-NC-ND/4.0/).
cognitive decline in neurodegeneration and it provides a more detailed analysis than the classic resting state fMRI approaches. Nevertheless, very few studies have explored structural and functional connectome properties in early onset AD (Filippi et al., 2017;Lehmann et al., 2015), and no studies are available for focal AD patients (e.g., PCA).
In the present study, the main objective is to identify functional connectome abnormalities in patients affected by PCA. We predict a highly diffuse pattern of network alterations at both global and regional level, more centered on posterior brain regions, and characterized by a focal disconnectivity mainly involving intrahemispheric posterior-anterior connections. We also expected that posterior-anterior brain regions would be spared and potentially able to compensate posterior func-tional brain alterations.
In addition to this, two ancillary analyses available as supplemen-tary material will be performed. In order to understand better under-lying pathophysiological mechanisms, a first analysis explored the connectomic features according to the cerebrospinal fluid (CSF) AD profile of PCA patients. In a previous study, Montembeault et al. showed that PCA patients have different anatomo-functional presenta-tions in relation to different CSF AD profiles (Montembeault et al., 2018a). Second, given that brain hypometabolism is usually wider than atrophy (Bloudek et al., 2011;Montembeault et al., 2018a) and thus to avoid losing information related to brain damage, we will combine MRI and fluorodeoxyglucose (FDG)-positron emission tomography (PET) explorations in a small subset of patients to corroborate the main hy-pothesis and assess functional connectivity of hypometabolic, atrophic and spared brain areas.
2. Methods
2.1. Participants and study design
Eighteen PCA patients and 29 age-matched healthy subjects without history of neurological or psychiatric diseases (22/7 women/men; mean age = 63.3 ± 5.3 years; mean education = 12.8 ± 2.3 years; mean Mini-Mental State Examination [MMSE] = 28.5 ± 1.7) parti-cipated in this study. Clinical and cognitive data were acquired at the centre National de Référence“Démences Rares”, located at the “Institut de la mémoire et de la maladie d'Alzheimer” (IM2A), in the Pitié-Salpêtrière Hospital, Paris. Medical records of patients clinically diag-nosed with PCA were reviewed by a neurologist (R.M.) and a neu-ropsychologist (M.M.) to confirm they met PCA diagnostic criteria. Diagnosis of PCA was mainly based on recently proposed clinical classification (Crutch et al., 2017); specifically on: 1) presentation with
progressive visual or visuospatial impairment in the absence of oph-thalmologic impairment; 2) evidence of complex visual disorder on examination (elements of Balint's and Gerstmann's syndrome, visual agnosia, alexia, apraxia, or environmental disorientation); 3) pro-portionately less memory loss (i.e., patients were required to present with early complaints of visual and visuospatial impairment in the absence of major memory complaints). Exclusion criteria for this study were left-handedness, history of other neurological or psychiatric dis-eases, ophthalmologic disease, early and predominant extrapyramidal symptoms or signs, hallucinations, cognitive fluctuations, rapidly evolving dementia syndromes, or signs of substantial leukoencephalo-pathy on MRI, in particular in the occipito-parietal regions, at pre-sentation. The study was approved by the local committee on human research. All subjects provided written informed consent before parti-cipating.
All patients underwent a neuropsychological battery including a global cognitive assessment with MMSE (Folstein et al., 1975) as well as an assessment of“frontal” brain functions with the frontal assessment battery (FAB) (Dubois et al., 2000), backwards digit span (Wechsler, 1981), and word generation tasks for category and letter fluency (Kremin et al., 1999). Patients’ scores on these tests were compared between groups with Kruskall-Wallis tests (p ≤ 0.05). A
more detailed exploration of “posterior” brain functions, through a battery specifically conceived for PCA patients and previously de-scribed (Migliaccio et al., 2016) and applied (Kas et al., 2011;
Migliaccio et al., 2012b,2012c,2016;Montembeault et al., 2018a), was also administered. This battery was designed to investigate“dorsal” deficits such as elements of Balint's and Gerstmann's syndromes, motor apraxia, ideomotor apraxia and visual neglect, as well as “ventral” deficits such as alexia and visual agnosia. Patients were classified as impaired or not impaired on these symptoms. Percentage of impaired subjects were compared between groups with Fisher's exact test of in-dependence (p≤ 0.05) and, given the sample size. Healthy controls underwent a neurological evaluation and the MMSE. For ancillary analyses, PCA patients were also classified according with their CSF AD profile as: 1) PCA with a typical CSF AD profile (PCA-tAD); 2) PCA with an atypical AD CSF profile (PCA-aAD); and 3) PCA not associated with AD (PCA-nonAD) (see supplementary material).
2.2. MRI study
2.2.1. MRI acquisition and pre-processing
2.2.1.1. MRI protocol. Brain MRI scans were acquired with a 3T system (Siemens, Erlangen, Germany) at the Center for Magnetic Resonance Research (CENIR), Brain and Spine Institute (ICM), Paris. A high-resolution structural volume was acquired using a T1-weighted 3D magnetization prepared rapid gradient echo (MP-RAGE) sequence (160 sagittal images; thickness 1 mm;field of view 256×256 mm2; matrix size 256×256). The functional images were acquired at rest by T2*-weighted fast echo planar imaging (flip angle = 90◦, echo time = 30 ms, repetition time = 2.26 s, 45 interleaved axial slices, gap = 0.3 mm, voxel size = 3 × 3 × 3 mm3, acquisition time=8 min=). During RS fMRI scanning, subjects were instructed to remain motionless, to keep their eyes closed, and to not think about anything in particular. Fat saturation was performed to avoid chemical shift artifacts. All slices were positioned to run parallel to a line that joins the most inferoanterior and inferoposterior parts of the corpus callosum.
2.2.1.2. Structural mri pre-processing. Structural images were preprocessed using voxel-based morphometry (VBM) implemented in SPM12 using MATLAB 7.14.0.739 (Mathworks, Natick, MA). The images were segmented into GM and white matter. Affine registered tissue segments were used to create a custom template using the DARTEL (diffeomorphic anatomical registration using exponentiated lie algebra) approach (Ashburner, 2007). For each participant, theflow fields were calculated during a template creation, which described the transformation from each native GM image to the template. These were then applied to each participant's GM image. The VBM analysis was based on modulated GM images, where the GM value for each voxel was multiplied by the Jacobian determinant derived from spatial normalization to preserve the total amount of GM from the original images (Ashburner and Friston, 2000). The resulting modulated and normalized images were then smoothed with a Gaussian kernel of 8 mm FWHM. Statistical analysis was performed on smoothed GM images. First, GM maps were compared between all PCA patients and controls using an ANOVA model adjusting for subject's age, sex, and total intracranial volume (p<0.05, FWE-corrected). The linear contrasts all PCA (n = 18) vs healthy subjects (n = 29) was set in order to identify differences in GM volume and was replicated on a smaller subset of six PCA with both structural MRI and FDG-PET (Fig. 1A). A significance
threshold of p≤ 0.05 corrected for multiple comparisons (family-wise error) was accepted when comparing the larger group of patients vs. controls and of p≤ 0.001 uncorrected when comparing the smaller group of six patients vs. controls.
2.2.1.3. Brain parcellation. Brain was parcellated into 220 similarly-sized regions, as previously described (Filippi et al., 2017). The
R. Migliaccio, et al. NeuroImage: Clinical 25 (2020) 102100
registrations between subject's T1-weighted image and MNI152 standard space (linear and non-linear using FLIRT and FNIRT, respectively, as implemented in FSL [FSLv5.0.9; http://www.fmrib. ox.ac.uk/fsl]) and between subject's RS fMRI and T1-weighted images
(linear registration as implemented in FLIRT) were calculated and concatenated in order to move the 220 GM ROIs into the subject's RS fMRI space.
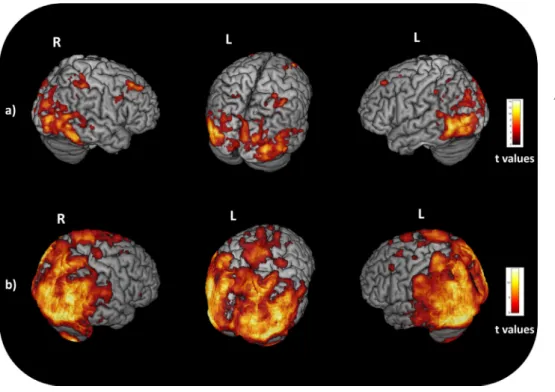
Fig. 1. Voxel-based morphometry and voxel-based metabolism results showing patterns of atrophy (A) and hypometabo-lism (B) in six PCA patients relative to 15 healthy controls. Results are shown in neu-rological convention (right is right) at p<0.001, uncorrected. Color bars (red to yellow) denote t values. Abbreviations: L= left; R= right (For interpretation of the refer-ences to color in thisfigure legend, the reader is referred to the web version of this article.).
Table 1
Demographic, biological, clinical and cognitive characteristics of PCA patients according with their cerebrospinal Alzheimer status at the time of imaging acquisition.
All PCA patients PCA-tAD (n = 9) PCA-aAD (n = 6) PCA-nonAD (n = 3) Difference between PCA subgroups Demographics
Age (mean ± SD) 63.3 (5.3) 61.7 (5.9) 63.5 (1.8) 67.5 (7.5) n.s. Age range 53–75 53–69 61–66 61–75
Education 14.4 (2.7) 15.5 (1.7) 13.3 (2.9) 13.7 (4.2) n.s.
Sex (M/F) 8/10 2/7 4/2 2/1 n.s.
Disease duration (years; mean ± SD) 4.1 (2.2) 3.1 (2.2) 5.9 (1.7) 3.6 (1.1) n.s. MMSE (mean ± SD) 19.6 (5.0) 17.3 (4.6) 20.7 (3.4) 24.3 (6.0) n.s. Aβ1-42(pg/ml) 381.5 (262.9) 288.7 (72.3) 291.0 (106.2) 810.7 (417.3) p = 0.028*
P-Tau (pg/ml) 70.9 (29.9) 89.3 (29.8) 49.4 (9.7) 51.3 (12.5) p = 0.002* T-Tau (pg/ml) 495.2 (268.9) 649.8 (287.7) 310.6 (86.9) 339.0 (56.7) p = 0.006* Neuropsychological assessment
Frontal assessment battery (FAB) 11.1 (2.8) 10.2 (3.4) 12.3 (0.8) 11.3 (3.2) n.s. Verbal span backwards 2.9 (1.0) 2.9 (1.3) 2.7 (0.8) 3.3 (0.6) n.s. Spatial span backwards 1.5 (1.5) 1.3 (1.1) 1.7 (1.4) 1.7 (2.9) n.s. Phonemicfluency 14.2 (7.7) 10.7 (7.4) 17.6 (6.7) 19.0 (7.0) n.s. Categoryfluency 13.4 (7.2) 9.4 (5.9) 17.3 (3.9) 17.7 (11.0) n.s. Symptoms (% of impaired patients) n.s.
Balint syndrome n.s. Ocular apraxia 35% 25% 50% 33% n.s. Optic ataxia 56% 44% 67% 67% n.s. Simultagnosia 94% 89% 100% 100% n.s. Gerstmann syndrome n.s. Acalculia 72% 78% 83% 33% n.s. Agraphia 72% 78% 67% 67% n.s. Finger agnosia 56% 67% 33% 67% n.s. Right-left disorientation 44% 44% 50% 33% n.s. Motor apraxia 61% 67% 50% 67% n.s. Ideomotor apraxia 83% 78% 100% 67% n.s. Visual neglect 94% 89% 100% 100% n.s. Alexia 83% 67% 100% 100% n.s. Visual agnosia 88% 89% 80% 100% n.s. n.s.= non-significant.
p values refer to Kruskall-Wallis test (p≤ 0.05).
Abbreviations: MMSE= mini mental state examination; PCA= posterior cortical atrophy; aAD= with atypical profile; nonAD= with normal profile; PCA-tAD= posterior cortical atrophy with typical cerebrospinalfluid Alzheimer's disease biomarkers profile.
2.2.1.4. RS fMRI data pre-processing. RS fMRI were pre-processed using the Statistical Parametric Mapping software package (SPM12;http:// www.fil.ion.ucl.ac.uk/spm/) running on Matlab 7.6 and FSL. None of the study participants were excluded from analysis because of motion. The first part of the pre-processing was performed using FSL and included: (i) removal of the first four volumes to allow for signal equilibration; (ii) minor head movement correction by volume-realignment to the middle volume using MCFLIRT; (iii) removal of nonbrain tissue. Linear detrending and band-passfiltering between 0.01 and 0.08 Hz were performed using the REST software ( http://resting-fmri.sourceforge.net/) to partially remove low-frequency drifts and physiological high-frequency noise. Using REST, non-neuronal sources of synchrony between RS fMRI time series and motion-related artifacts were minimized by regressing out the six motion parameters estimated by MCFLIRT, and the average signals of the ventricular cerebrospinal fluid and white matter.
2.2.1.5. Functional brain network construction. Functional connectivity matrices were obtained on the basis of correlation analysis. Mean time series were extracted from each ROI by averaging the signal from all voxels within each region. RS fMRI data were masked with subject's GM map in order to consider only voxels corresponding to GM and avoid the effect of atrophy. Cortical GM was segmented using SPM12, while basal ganglia (i.e., bilateral caudate, globus pallidus, putamen, and thalamus), hippocampus and amygdala maps were obtained using FIRST in FSL. The Pearson's correlation coefficient between the mean time-series of each ROI pair, indicating the level of functional connectivity between regions i and j, was enter into cell c(i,j) of the matrix. Pearson's correlation coefficients were then converted to
z-scores using Fisher's r-to-z transformation. Negative correlation coefficients were set to ‘not a number’ to mark these brain regions as unconnected (Verstraete et al., 2014). An undirected, weighted graph describing the brain's network functional layout was obtained by computing correlations between the 220 GM ROIs. Functional connections were required to be present in a structural connectivity matrix of an independent healthy control sample (N = 90, mean age 62.3 ± 8.07 years, 51 women/39 men), i.e., we measured functional interactions only where an anatomical connection between two areas occurs in the independent healthy control sample, as previously reported (Filippi et al., 2017).
2.2.2. fMRI analyses
2.2.2.1. Global and lobar functional brain network analysis. Global and mean lobar network characteristics were explored using the Brain Connectivity Matlab toolbox (http://www.brain-connectivity-toolbox. net) as previously described (Filippi et al., 2017). Network metrics, including clustering coefficient, characteristic path length, mean network strength, and local efficiency were assessed to characterize the global topological organization of global brain and lobar networks (Sporns et al., 2004;Watts and Strogatz, 1998). In order to investigate the network characteristics in different areas of the brain, 220 regions of interest (ROIs) from both hemispheres were grouped into six anatomical macro-areas (hereafter referred to as lobes): fronto-insular, occipital, temporal, parietal, basal ganglia, and sensorimotor areas. Global and local metrics were compared between groups using age-adjusted ANOVA models, followed by post-hoc pairwise comparisons, Bonferroni-corrected for multiple comparisons (p<0.05, SPSS Statistics 21.0).
Fig. 2. Graph analysis properties of brain lobar networks in healthy controls and PCA patients. Mean values of nodal strength, path length, local efficiency, and clustering coefficient of each brain lobe for healthy controls and PCA patients. Error bars are shown. *p<0.05 in PCA versus healthy controls (see Supplementary Table 1 for further details). The direct comparison between PCA patients and healthy controls was adjusted for age. Abbreviations: HC= healthy controls; PCA= posterior cortical atrophy.
R. Migliaccio, et al. NeuroImage: Clinical 25 (2020) 102100
2.2.2.2. Regional functional connectivity analysis. Network Based Statistics (NBS) (Filippi et al., 2017; Galantucci et al., 2017;
Zalesky et al., 2010) were performed to compare regional functional connectivity network data (in terms of Pearson's correlation coefficients) between groups at the level of significance p<0.05. The largest (or principal) connected component and the smaller clusters of altered connections, which were not included in the principal connected component (Filippi et al., 2017; Galantucci et al., 2017;
Zalesky et al., 2010) were studied. A corrected p value was calculated for each component using an age-adjusted permutation analysis (10,000 permutations), as suggested by Zalesky and colleagues (Zalesky et al., 2010).
2.2.3. Network analysis within atrophic, hypometabolic and spared nodes The contrasts used for the VBM analyses were replicated with the same parameters for the PET analyses. Details for the FDG-PET study are available in the supplementary materials. The linear contrasts PCA vs. healthy subjects was set in order to identify differences in the me-tabolism (Fig. 1B). Voxel based atrophy and hypometabolism maps were extracted from the comparison between the six PCA patients and 15 healthy subjects with both imaging scans. Based on atrophy and
hypometabolism maps at p<0.001 uncorrected (Fig. 1), we defined
each of the 220 ROIs (i.e., nodes) as atrophic only, hypometabolic only, atrophic and hypometabolic, and spared (nor atrophic neither hypo-metabolic). Each node was assigned to a category when at least the 50% of its total volume is included in a specific map (atrophic, hypometa-bolic, or both). Non-classifiable nodes were included in the “spared” group. Mean graph analysis metrics were investigated in each category of nodes. In addition, in order to assess connectivity among node ca-tegories, both inter- and intra-hemispherically, we measured the con-nectivity weight (CW) for each pair of node classes (NC) of the two hemispheres (NCx,NCy): CW(NCx,NCy)=∑_(iϵNCx,jϵNCy) wij, where wij is the connectivity weight between regions i and j. NCCW values were compared between groups by means of t-test setting the level of significance at p<0.05 using NBS (Filippi et al., 2017;Galantucci et al., 2017;Zalesky et al., 2010). A corrected p value was calculated for each pair of node classes using an age-adjusted permutation analysis (10,000 permutations).
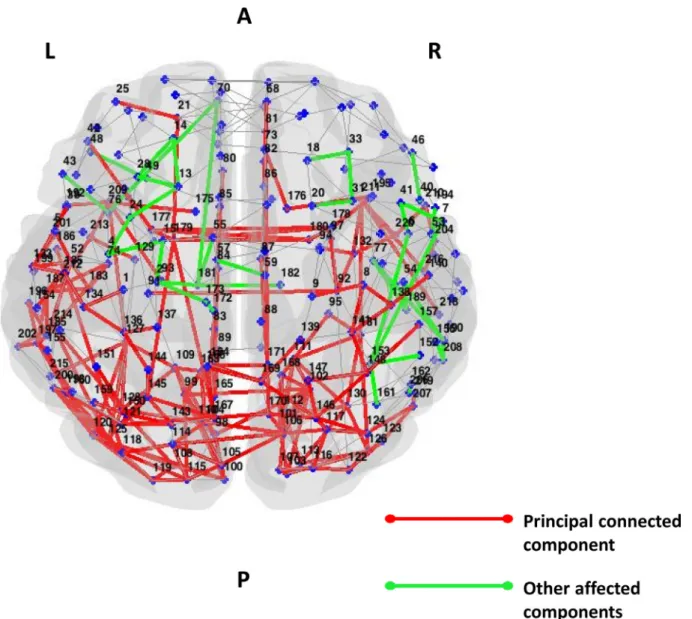
Fig. 3. Affected functional connections in PCA patients relative to healthy controls (Network Based Statistic). Subnetworks showing reduced functional connectivity in PCA patients relative to healthy controls are shown. The direct comparison between PCA patients and healthy controls was adjusted for age. The principal connected component is represented in red, the other affected connections not included in the principal connected component are shown in green. Supplementary Table 4 reports the names of each brain node with the corresponding number. Abbreviations: L= left; R= right.
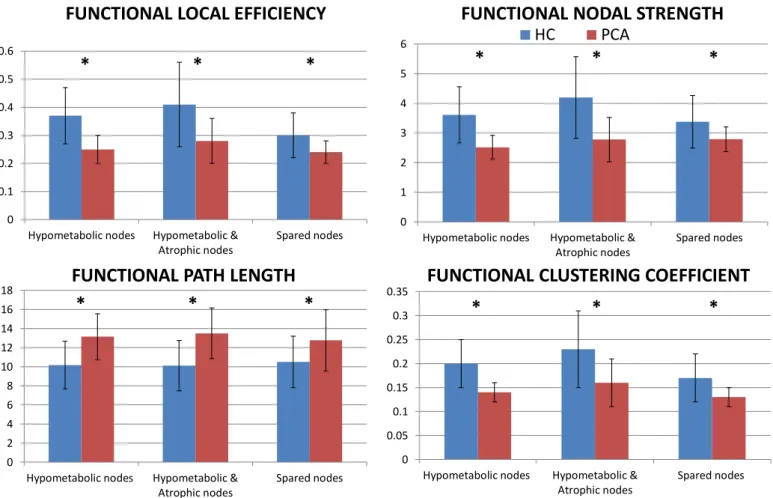
Fig. 4. Graph analysis properties of atrophic, hypometabolic and spared nodes in healthy controls and PCA patients. Mean values of nodal strength, path length, local efficiency, and clustering coefficient of each node categories for healthy controls and PCA patients. Error bars are shown. *p<0.05 in PCA versus healthy controls (see Supplementary Table 5 for further details). The direct comparison between PCA patients and healthy controls was adjusted for age. Abbreviations: HC = healthy controls; PCA= posterior cortical atrophy.
Fig. 5. Intra- and inter-node categories connectivity weights (CW) in healthy con-trols and PCA patients. Thefigure shows the hypometabolic, atrophic and hypometabolic, and spared nodes in different colors arranged as a ring (hypometabolic=violet, atrophic and hypometabolic=red and spared nodes=pink). The size of each sector of the ring is propor-tional to the number of brain nodes included in each category (see Supplementary Table 4 for further details). White lines indicate decreased CW in PCA relative to controls. A more de-tailed spatial distribution of the brain nodes is shown using sagittal and axial brain sections. Within this, each node is coloured according to the category it belongs to. The direct compar-ison between PCA patients and healthy con-trols was adjusted for age. Abbreviations: HC= healthy controls; L= left; PCA= posterior cortical atrophy; R= right (For interpretation of the references to color in thisfigure legend, the reader is referred to the web version of this article.).
R. Migliaccio, et al. NeuroImage: Clinical 25 (2020) 102100
3. Results
3.1. Clinical, cognitive and biological results
Patients and controls were similar in terms of age (p = 0.82), sex distribution (p = 0.14), and education (p = 0.26). Overall, PCA pa-tients presented mild-to-moderate global cognitive impairment with pathological scores at MMSE, FAB, letter and categoryfluencies, verbal and spatial spans, as well as typical visual symptoms that are char-acteristic of PCA (Table 1).
Detailed demographics, cognitive and CSF characteristics of each PCA patient are also shown inTable 1. No significant difference was observed between groups of patients except for the disease duration, which tended to be slightly longer in PCA-aAD cases.
3.2. Imaging results
3.2.1. Structural study
All PCA patients presented with the classic pattern of cortical atrophy centered on posterior brain regions including the occipital, parietal and posterior temporal regions. Scattered additional areas of atrophy were also present in more anterior and lateral frontal regions (Fig. 1A).
3.2.2. Main study: connectome alterations in all PCA patients
Relative to controls, PCA patients showed severe global functional network alterations (lower mean nodal strength, local efficiency, and clustering coefficient, and longer mean path length) (supplementary Table 2). The analysis of lobar network properties in PCA compared with controls showed a prominent involvement of the parietal, tem-poral, occipital and sensorimotor areas (alterations of all graph analysis metrics) (Fig. 2; Supplementary Table 1). Furthermore, relative to controls, PCA patients showed a longer mean path length in the fronto-insular lobe and basal ganglia, and reduced clustering coefficient in the basal ganglia (Fig. 2; Supplementary Table 1). At the regional con-nectivity level (NBS), compared to controls, PCA patients showed widespread functional connectivity reductions in intrahemispheric oc-cipito-temporal pathways, but also in the frontal, parieto-frontal, temporo-parieto-frontal, basal ganglia-frontal connections bilaterally (p<0.0024;Fig. 3). PCA patients also showed functional connectivity reductions in interhemispheric pathways linking medial parietal nodes and basal ganglia (p<0.0024;Fig. 3).
3.2.3. Supplementary studies: connectome alterations in PCA according to their CSF AD profile
Globally, PCA-tAD patients showed a reduced clustering coefficient relative to controls (Table 1). PCA-aAD and PCA-nonAD patients did not demonstrate difference compared to healthy controls (Table 1). Global graph analysis properties did not differ between patient groups (Table 1). For more details see supplementary material.
3.2.4. Supplementary studies: connectome alterations in PCA within atrophic, hypometabolic and spared nodes
Based on atrophic and hypometabolic maps, we identified hypo-metabolic only, hypohypo-metabolic and atrophic, and spared nodes (Supplementary Table 4). No nodes were classified into the atrophic only category. Irrespectively of the categorization, all node classes showed lower mean nodal strength, local efficiency, and clustering coefficient, and longer mean path length relative to healthy controls (Fig. 4; Supplementary Table 5). Moreover, we observed a widespread loss of both intra- and inter-hemispheric functional connections be-tween hypometabolic only, hypometabolic and atrophic, and spared nodes. No alterations were observed in the connections among spared areas (Fig. 5).
4. Discussion
Using graph analysis and a connectomic approach, we revealed a diffuse pattern of functional network alterations at both global and regional cerebral level in patients with PCA. As expected, the pattern was more centered on posterior brain regions. However, and against our prediction, it also involved less impaired anterior regions such as frontal and sensorimotor areas bilaterally. In particular, the intra-hemispheric functional connections were diffusely impaired, including those in frontal lobes. The inter-hemispheric connections were also severely impaired but particularly between posterior brain areas.
Parietal, occipital, temporal and sensorimotor nodes were pre-ferentially affected (Fig. 1), and this pattern is in agreement with pre-vious classic fMRI studies exploring visual and non-visual networks in PCA (Agosta et al., 2018;Lehmann et al., 2015;Migliaccio et al., 2016). However, more anterior regions already show important signs of al-teration, and when we studied the functional connections among nodes (Fig. 2), we found that also the more anterior (frontal) pathways were already impaired in PCA. In particular, the intra-hemispheric parieto-frontal and fronto-parieto-frontal connections were found to be altered. Pre-vious classic fMRI studies in atypical and focal AD (Lehmann et al., 2015;Migliaccio et al., 2016) have showed hyperconnectivity in more anterior, apparently spared, brain regions possibly suggesting an at-tempt of network compensation. However, other fMRI studies on ty-pical AD (Damoiseaux et al., 2012) and mild cognitive impairment (Bai et al., 2011) rather suggest that states of functional hy-perconnectivity, which can later progress to hypoconnectivity, may indicate an early phase or the progression of brain dysfunction. Present graph-analysis and connectomics results strongly support this last in-terpretation. In particular, since the disease duration was of 4 years in average, we can conclude that the functional alterations indicate a progression of the disease.
Clinically, these results can explain some of the manifestations such as visuospatial attention deficits, visual agnosia and alexia, which are due to an anatomo-functional disconnection between distant - involved and spared- brain regions. In particular, the right parieto-frontal net-work is implicated in the visuospatial attention (Migliaccio et al., 2012c), while the ventral occipito-temporal network in the left hemi-sphere are implicated in object naming and reading (Migliaccio et al., 2012b). Moreover, ideomotor apraxia can arise, at least in part, from an inter-hemispheric disconnection from the left parietal lobe and con-tralateral homologous areas (Goldenberg, 2003). Finally, our PCA pa-tients showed pathological scores in tests as such FAB, verbalfluencies and the working memory spans, which are related to the frontal func-tioning. These cognitive deficits in PCA patients are very often ne-glected and/or considered as the result of major visual problems. This is partially true for visual spans and some FAB subtest in which the visual component is preponderant, but it is not valid for example for verbal fluencies or verbal span. These deficits, even if less important than the posterior symptoms, are most likely related to an early and genuine frontal dysfunction that we havefinally confirmed with our approach. The involvement of sensorimotor cortices and basal ganglia identi-fied in our PCA patients can be interpreted in different ways: as the result of an early functional deficit in a region that is typically affected later in the disease, and/or as due to the presence of other neurode-generative process in the sample of patients with a nonAD CSF bio-markers profile. For instance, the damage of sensorimotor cortices and basal ganglia has been well described in corticobasal degeneration patients (Borroni et al., 2008). In some cases, patients with a cortico-basal degeneration may clinically present as a PCA (Montembeault et al., 2018a;Tang-Wai et al., 2004).
Taken together, thesefindings suggest the potentially high sensi-tivity of graph-analysis and connectomics in capturing signs of neuro-degeneration progression in these patients and highlight the sig-nificance of applying network analysis to uncover how the brain connectivity interacts for example with the disease progression.
In order to better understand pathophysiological mechanisms as-sociated with our results, we preliminarily explored the functional data according to CSF AD profiles. PCA group with both abnormal amyloid and T-tau/P-tau biomarkers showed more extensive functional con-nectivity alterations, while PCA group characterized by an isolated abnormal amyloid showed a focal connectivity impairment of the par-ietal lobes. Although the small number of patients in each CSF subgroup did not allow to reach salient conclusions, they highlight the im-portance to combine biological and imaging explorations to stratify patients with dementia.
Moreover, one might speculate that atrophy does not correspond to the real extent of damage and that hypometabolism provides more re-liable information. For this reason, we combined MRI and FDG-PET evaluations to corroborate the main findings of our study. Most im-portantly, all the nodes, including those that were neither atrophic nor hypometabolic (spared), showed altered graph analysis properties (Fig. 4). Moreover, the study of the connections among the different
nodes showed both intra-hemispheric and inter-hemispheric break-down between pathological nodes, and between pathological and spared nodes (Fig. 5). Those results may suggest that the functional neuronal deficit precedes both structural and metabolic damage.
The study has some limitations. In terms of the clinical/cognitive assessment, some cognitive functions were only computed as binary variables (impaired/unimpaired) and some more ventral functions were not systematically explored, such as the facial identification (Pressman et al., 2019). Furthermore, not all patients underwent the FDG-PET scan, which lead to a small sample size for that specific analysis. However, this analysis was performed to confirm the main results and to suggest new research prospective of multimodal imaging in PCA and more generally in dementia patients. Finally, none of our subjects had postmortem pathological diagnosis confirmation, which could be particularly interesting in disentangling the differences be-tween PCA-tAD and PCA-aAD.
Declaration of Competing Interest
The authors declare that they have no known competingfinancial interests or personal relationships that could have appeared to in flu-ence the work reported in this paper.
Acknowledgments
The study was supported by the Philippe Chatrier and France Alzheimer Foundations.
R. Migliaccio has received research supports from Philippe Chatrier and France Alzheimer Foundations. F. Agosta is Section Editor of NeuroImage: Clinical; has received speaker honoraria from Biogen Idec, Novartis and Philips; and receives or has received research supports from the Italian Ministry of Health, AriSLA (Fondazione Italiana di Ricerca per la SLA), and the European Research Council. S. Basaia, and C. Cividini report no disclosures. M. Montembeault has received search supports from Quebec Bio Imaging Network and Fonds de re-cherche du Québec en Santé. M.O. Habert has received speaker hon-oraria from Lilly, GE Healthcare and Piramal. A. Kas has received speaker honoraria from GE Healthcare and Piramal. M. Filippi is Editor-in-Chief of the Journal of Neurology; serves on a scientific advisory board for Teva Pharmaceutical Industries; has received compensation for consulting services and/or speaking activities from Biogen Idec, ExceMED, Novartis, and Teva Pharmaceutical Industries; and receives research support from Biogen Idec, Teva Pharmaceutical Industries, Novartis, Italian Ministry of Health, Fondazione Italiana Sclerosi Multipla, Cure PSP, Alzheimer's Drug Discovery Foundation (ADDF), the Jacques and Gloria Gossweiler Foundation (Switzerland), and ARiSLA (Fondazione Italiana di Ricerca per la SLA).
Supplementary materials
Supplementary material associated with this article can be found, in the online version, atdoi:10.1016/j.nicl.2019.102100.
References
Agosta, F., Mandic-Stojmenovic, G., Canu, E., Stojkovic, T., Imperiale, F., Caso, F., Stefanova, E., Copetti, M., Kostic, V.S., Filippi, M., 2018. Functional and structural brain networks in posterior cortical atrophy: a two-centre multiparametric MRI study. Neuroimage Clin. 19, 901–910.
Ashburner, J., 2007. A fast diffeomorphic image registration algorithm. Neuroimage 38, 95–113.
Ashburner, J., Friston, K.J., 2000. Voxel-based morphometry–the methods. Neuroimage 11, 805–821.
Bai, F., Watson, D.R., Shi, Y., Wang, Y., Yue, C., YuhuanTeng, Wu, D., Yuan, Y., Zhang, Z., 2011. Specifically progressive deficits of brain functional marker in amnestic type mild cognitive impairment. PLoS ONE 6, e24271.
Bloudek, L.M., Spackman, D.E., Blankenburg, M., Sullivan, S.D., 2011. Review and meta-analysis of biomarkers and diagnostic imaging in Alzheimer’s disease. J. Alzheimer Dis. 26, 627–645.
Borroni, B., Garibotto, V., Agosti, C., Brambati, S.M., Bellelli, G., Gasparotti, R., Padovani, A., Perani, D., 2008. White matter changes in corticobasal degeneration syndrome and correlation with limb apraxia. Arch. Neurol. 65, 796–801.
Bullmore, E., Sporns, O., 2009. Complex brain networks: graph theoretical analysis of structural and functional systems. Nat. Rev. Neurosci. 10, 186–198.
Caso, F., Agosta, F., Mattavelli, D., Migliaccio, R., Canu, E., Magnani, G., Marcone, A., Copetti, M., Falautano, M., Comi, G., Falini, A., Filippi, M., 2015. White matter de-generation in atypical Alzheimer disease. Radiology 277, 162–172.
Crutch, S.J., Schott, J.M., Rabinovici, G.D., Murray, M., Snowden, J.S., van der Flier, W.M., Dickerson, B.C., Vandenberghe, R., Ahmed, S., Bak, T.H., Boeve, B.F., Butler, C., Cappa, S.F., Ceccaldi, M., de Souza, L.C., Dubois, B., Felician, O., Galasko, D., Graff-Radford, J., Graff-Radford, N.R., Hof, P.R., Krolak-Salmon, P., Lehmann, M., Magnin, E., Mendez, M.F., Nestor, P.J., Onyike, C.U., Pelak, V.S., Pijnenburg, Y., Primativo, S., Rossor, M.N., Ryan, N.S., Scheltens, P., Shakespeare, T.J., Suarez Gonzalez, A., Tang-Wai, D.F., Yong, K.X.X., Carrillo, M., Fox, N.C., 2017. Consensus classification of posterior cortical atrophy. Alzheimers Dement 13, 870–884.
Damoiseaux, J.S., Prater, K.E., Miller, B.L., Greicius, M.D., 2012. Functional connectivity tracks clinical deterioration in Alzheimer’s disease. Neurobiol. Aging 33, 828.e819–828.e830.
Dubois, B., Slachevsky, A., Litvan, I., Pillon, B., 2000. The FAB: a frontal assessment battery at bedside. Neurology 55, 1621–1626.
Filippi, M., Basaia, S., Canu, E., Imperiale, F., Meani, A., Caso, F., Magnani, G., Falautano, M., Comi, G., Falini, A., Agosta, F., 2017. Brain network connectivity differs in early-onset neurodegenerative dementia. Neurology 89, 1764–1772.
Folstein, M.F., Folstein, S.E., McHugh, P.R., 1975.“Mini-mental state”. a practical method for grading the cognitive state of patients for the clinician. J Psychiatr Res 12, 189–198.
Galantucci, S., Agosta, F., Stefanova, E., Basaia, S., van den Heuvel, M.P., Stojkovic, T., Canu, E., Stankovic, I., Spica, V., Copetti, M., Gagliardi, D., Kostic, V.S., Filippi, M., 2017. Structural brain connectome and cognitive impairment in Parkinson disease. Radiology 283, 515–525.
Goldenberg, G., 2003. Apraxia and beyond: life and work of Hugo Liepmann. Cortex 39, 509–524.
Kas, A., de Souza, L.C., Samri, D., Bartolomeo, P., Lacomblez, L., Kalafat, M., Migliaccio, R., Thiebaut de Schotten, M., Cohen, L., Dubois, B., Habert, M.O., Sarazin, M., 2011. Neural correlates of cognitive impairment in posterior cortical atrophy. Brain 134, 1464–1478.
Kremin, H., Perrier, D., de Wilde, M., 1999. DENO 100- Paradigme expérimental et test clinique de dénomination contrôlée : effet relatif de 7 variables expérimentales sur les performances de 16 sujets atteints de maladies dégénératives. Revue de
Neuropsychologie 9, 439–440.
Lehmann, M., Madison, C., Ghosh, P.M., Miller, Z.A., Greicius, M.D., Kramer, J.H., Coppola, G., Miller, B.L., Jagust, W.J., Gorno-Tempini, M.L., Seeley, W.W., Rabinovici, G.D., 2015. Loss of functional connectivity is greater outside the default mode network in nonfamilial early-onset Alzheimer’s disease variants. Neurobiol. Aging 36, 2678–2686.
Migliaccio, R., Agosta, F., Possin, K.L., Rabinovici, G.D., Miller, B.L., Gorno-Tempini, M.L., 2012a. White matter atrophy in Alzheimer's disease variants. Alzheimers Dement 8, S78–S87 e71-72.
Migliaccio, R., Agosta, F., Rascovsky, K., Karydas, A., Bonasera, S., Rabinovici, G.D., Miller, B.L., Gorno-Tempini, M.L., 2009. Clinical syndromes associated with posterior atrophy: early age at onset AD spectrum. Neurology 73, 1571–1578.
Migliaccio, R., Agosta, F., Scola, E., Magnani, G., Cappa, S.F., Pagani, E., Canu, E., Comi, G., Falini, A., Gorno-Tempini, M.L., Bartolomeo, P., Filippi, M., 2012b. Ventral and dorsal visual streams in posterior cortical atrophy: a DT MRI study. Neurobiol. Aging 33, 2572–2584.
Migliaccio, R., Agosta, F., Toba, M.N., Samri, D., Corlier, F., de Souza, L.C., Chupin, M., Sharman, M., Gorno-Tempini, M.L., Dubois, B., Filippi, M., Bartolomeo, P., 2012c. Brain networks in posterior cortical atrophy: a single case tractography study and literature review. Cortex 48, 1298–1309.
Migliaccio, R., Gallea, C., Kas, A., Perlbarg, V., Samri, D., Trotta, L., Michon, A., Lacomblez, L., Dubois, B., Lehericy, S., Bartolomeo, P., 2016. Functional connectivity of ventral and dorsal visual streams in posterior cortical atrophy. J. Alzheimer Dis.
R. Migliaccio, et al. NeuroImage: Clinical 25 (2020) 102100
51, 1119–1130.
Montembeault, M., Brambati, S.M., Lamari, F., Michon, A., Samri, D., Epelbaum, S., Lacomblez, L., Lehericy, S., Habert, M.O., Dubois, B., Kas, A., Migliaccio, R., 2018a. Atrophy, metabolism and cognition in the posterior cortical atrophy spectrum based on Alzheimer’s disease cerebrospinal fluid biomarkers. Neuroimage Clin. 20, 1018–1025.
Montembeault, M., Lacomblez, L., Habert, M.O., Kas, A., Migliaccio, R., 2018b. Posterior cortical atrophy: from vision to emotion. Geriatr. Psychol. Neuropsychiatr. Vieil. 16, 57–66.
Ossenkoppele, R., Schonhaut, D.R., Scholl, M., Lockhart, S.N., Ayakta, N., Baker, S.L., O'Neil, J.P., Janabi, M., Lazaris, A., Cantwell, A., Vogel, J., Santos, M., Miller, Z.A., Bettcher, B.M., Vossel, K.A., Kramer, J.H., Gorno-Tempini, M.L., Miller, B.L., Jagust, W.J., Rabinovici, G.D., 2016. Tau PET patterns mirror clinical and neuroanatomical variability in Alzheimer's disease. Brain 139, 1551–1567.
Pressman, P.S., Gola, K., Shdo, S.M., Miller, B.L., Fredericks, C., Mielke, C., Pelak, V., Rankin, K.P., 2019. Relative preservation of facial expression recognition in posterior
cortical atrophy. Neurology.https://doi.org/10.1212/WNL.0000000000007075.
Sporns, O., Chialvo, D.R., Kaiser, M., Hilgetag, C.C., 2004. Organization, development and function of complex brain networks. Trends Cogn. Sci. (Regul. Ed.) 8, 418–425.
Tang-Wai, D.F., Graff-Radford, N.R., Boeve, B.F., Dickson, D.W., Parisi, J.E., Crook, R., Caselli, R.J., Knopman, D.S., Petersen, R.C., 2004. Clinical, genetic, and neuro-pathologic characteristics of posterior cortical atrophy. Neurology 63, 1168–1174.
Verstraete, E., Veldink, J.H., van den Berg, L.H., van den Heuvel, M.P., 2014. Structural brain network imaging shows expanding disconnection of the motor system in amyotrophic lateral sclerosis. Hum. Brain Mapp. 35, 1351–1361.
Watts, D.J., Strogatz, S.H., 1998. Collective dynamics of‘small-world’ networks. Nature 393, 440–442.
Wechsler, D., 1981. The Wechsler Adult Intelligence Scale–Revised. Psychological Corporation, San Antonio.
Zalesky, A., Fornito, A., Bullmore, E.T., 2010. Network-based statistic: identifying dif-ferences in brain networks. Neuroimage 53, 1197–1207.