HAL Id: tel-01126865
https://tel.archives-ouvertes.fr/tel-01126865
Study on the origin of 1/f in bulk acoustic wave
resonators
Santunu Ghosh
To cite this version:
Santunu Ghosh. Study on the origin of 1/f in bulk acoustic wave resonators. Acoustics [physics.class-ph]. Université de Franche-Comté, 2014. English. �NNT : 2014BESA2046�. �tel-01126865�
Contribution à l’étude des origines du bruit en 1/f dans les
résonateurs à onde acoustique de volume
Study on the origin of 1/f noise in bulk acoustic wave
resonators
SANTUNU GHOSH
THÈSE
de l’Université de Franche-Comté pour obtenir le grade de
DOCTEUR
Discipline : Sciences pour l’Ingénieur
Contribution à l’étude des origines du bruit en 1/f dans les résonateurs à
onde acoustique de volume
Study on the origin of 1/f noise in bulk acoustic wave resonators
par
Santunu G
HOSH
Institut FEMTO-ST
Soutenue le 17 octobre 2014 devant je jury composé de :
Rapporteurs : L. BELLON Chargé de Recherche, HDR, Labo. de Physique, ENS, Lyon O. LLOPIS Directeur de Recherche CNRS, LAAS, Toulouse
Examinateurs : G. CIBIEL Dr., Ingénieur CNES, Toulouse
M. DEVEL Professeur des Universités, FEMTO‐ST, ENSMM, Besançon J. IMBAUD Maître de Conférences, FEMTO‐ST, ENSMM, Besançon
During the journey of my 3 years PhD thesis research in an exciting and one of the most challenging topics in recent time, on the investigation of the origin of 1/f in BAW quartz crystal resonators, I have gained many things to learn and understand and predict. But at the edge of the journey of my PhD thesis I would like to mention a quoteμ
“Learn from yesterday, live for today, hope for tomorrow. The important thing is to not stop questioning.”
Acknowledgements:
I would like to say a special word of thanks to the members of the examination boardμ
Dr. Olivier LLOPIS, Directeur de Recherche in CNRS-LAAS, Toulouse, France, MOST group (Microondes et Opto-microondes pour Systèmes de Télécommunications) (Reviewer).
Dr. Ludovic Bellon, Chargé de Recherche CNRS, Habilitation à Diriger des Recherches, in the Laboratoire de Physique at ENS Lyon, France (Reviewer).
Dr. Gilles Cibiel, Centre National d'Etudes Spatiales, Microwave & Time Frequency Dept., Toulouse, France, (Examinator).
My PhD thesis not only represents a systematic research in physics and engineering but it also represents a wonderful working relationship and interactions with scientists, students, technician and professors with different academic and cultural background. During these three years, since October 1, 2011, I felt home at ENSMM (Ecole Nationale Supérieure de Mécaniques et des Microtechniques) and my experience in ENSMM is shortly amazing. This thesis is the result of many experiences I have encountered at FEMTO-ST Institute from lots of remarkable individuals whom I wish to acknowledge.
First and foremost I want to thank my PhD supervisor Prof. Fabrice Sthal. It has been an honor to be his PhD student to work at the Time and Frequency department in FEMTO-ST Institute. I appreciate all of his contributions of time, ideas, and funding to make my PhD experience. The joy and enthusiasm he has for his research was contagious and motivational for me, even during tough times in the PhD pursuit. He has always made himself available to clarify my doubts despite his busy schedules and I consider it as a great opportunity to do my doctoral program under his guidance and to learn from his research expertise. Thank you very much Fabrice for all of your help and support and I am grateful for the excellent example you have provided as a successful engineer and professor.
and knowledge and many insightful discussions and theoretical and experimental contribution in my PhD thesis.
I am extremely grateful to P. H. Handel for his fundamental theory and for his valuable discussion and for sharing his ideas with us on 1/f noise for quartz crystal resonators. He is one of the most experienced and wisest researchers in the world in the domain of 1/f noise. I want to thank Dr. Ludovic Bellon for his presentation and important scientific discussion with us. I want to thank technician Cedric Vuillemin and Ahmed Bakir for their contribution to measure 1/f noise in my PhD thesis. I want to thank Philippe Abbe for helping me for the low temperature experiments. I want to thank the previous director of the time and Frequency Department Prof. Bernard Dulmet for allowing me as a PhD student and I also want to thank our recent director Dr. Vincent Giordano and the managing staff for providing the different facilities.
A special thanks to my parents Debesh Ghosh, Shamali Ghosh and my brother Suman Ghosh, my grandmother and my other relative Nishir Ghosh for their love and encouragement and their contribution cannot be expressed by words. I would also like to thank all of my friends who supported me in different aspects, and incented me to strive towards my goal, especially to Ashim Roy, Avik Ram Mondal, Sanando Bandopadhyay, Raj Narayan Dhara, Nandish Calchand. I want to thank my special friend Roselei Bilas for her valuable help in my difficult situation during these years. Thanks to all of you once again.
Table
of contents:
Acknowledgementsμ ... iii
Table of contentsμ ... v
List of captionsμ ... ix
List of tablesμ ... xiii
Introductionμ ... 1
Chapter 1μ General Overview ... 3
1. Piezoelectricity ... 3
1.1. General constitutive equations of piezoelectricity ... 5
1.2. Voigt’s notations ... 7
1.3. Simplifications for the trigonal crystallographic class ... 8
1.4. Electromechanical coupling factor ... 8
2. Crystal characteristics ... λ 2.1. Quartz crystal ... λ 2.2. Crystals Homeotypic to Quartz (LGS, LGT and GaPO4)... 20
2.3. Materials constants comparison ... 23
3. Crystal resonators and oscillators ... 26
3.1. Crystal resonators ... 26
3.2. Crystal Oscillators ... 31
3.3. Noise and stabilities in the time and frequency domains ... 33
1.4. F. N. Hooge and P. A. Bobbert’s theory ... 45
2. 1/f noise from the fluctuations of time intervals between pulses ... 46
3. 1/f noise and self-organized criticality ... 47
4. 1/f noise in quartz crystal resonators by using statistical mechanicsμ Michel Planat’s Model 48 5. A possible explanation for the absence of observation of lower cut-off ... 50
6. Other interesting models of 1/f noise ... 52
7. Conclusions ... 52
8. References ... 53
Chapter 3μ Investigation of Quantum 1/f noise ... 55
1. On some of Handel’s theories concerning 1/f noise ... 55
1.1. Handel’s theory of quantum 1/f noise in electronic devices ... 55
1.2. Criticisms of Handel’s theory ... 60
1.3. Handel’s theory of quantum 1/f noise for piezoelectric quartz crystal resonators ... 62
2. Calculation of β' ... 68
2.1. Handel’s evaluation of the order of magnitude of β' ... 68
2.2. Points of concern in Handel’s model as concerns the evaluation of β' ... 68
2.3. Our calculation of β' ... 70
3. Volume dependence in Handel’s model of quartz crystal resonator noise ... 70
3.1. Acoustic volume estimation ... 72
3.2. Application of the models to experimental measurements ... 73
3.3. Size dependence... 76
4. Attempts to compute the average circular frequency present in Handel’s theory of quantum 1/f noise for BAW quartz resonators thanks to molecular dynamics ... 7λ 4.1. Simulation details ... 7λ 4.2. Estimation of the average angular frequency ... 82
5. Conclusions ... 86
6. References ... 88
Chapter 4μ Investigation of 1/f Noise With The help of Fluctuation-Dissipation Theorem ... λ5
1. Fluctuation-Dissipation Theorem (FDT) ... λ5
1.1. Callen-Welton form of the FDT ... λ6
1.2. Callen-Greene form of the FDT ... λ6
1.3. Kubo’s form of the FDT ... λ8
2. Investigation of 1/f Noise with the help of the FDT ... 100
2.1. Evaluation of the contribution of thickness fluctuations to frequency noise ... 100
2.2. Tentative physical explanation of the internal friction coefficient φ ... 104
3. Conclusions ... 108
4. References ... 10λ Chapter 5μ Experimental observations ... 111
1. Resonator Realization ... 111
1.1. Crystal block and blank cutting ... 111
1.2. Final 5 MHz SC-cut resonators ... 113
1.3. Resonator parameters... 113
2. Resonator noise measurements ... 116
2.1. Measurement set-up ... 116
2.2. Noise results ... 120
3. Low temperature measurements ... 122
3.1. Cryogenic set-up ... 122
3.2. Measurement results ... 124
Conclusion ... 137
Perspectives ... 13λ
List
of captions:
Fig.1.1: Schematic diagram of charge separation inside a piezoelectric crystal under the influence of external
mechanical stress [2]. ... 3
Fig.1.2: Direct and converse piezoelectric effect [3]. ... 4
Fig. 1.3: The forces on the faces of a cube located inside a stressed body [4]. ... 5
Fig.1.4: Phase diagram of Silica (SiO2) [2]. ... 9
Fig.1.5: The quartz lattice (from http://volga.eng.yale.edu/sohrab/grouppage/pics/SiO2bulksupercell.jpg). Si atoms/ions are in red, Oxygen atoms/ions in blue, iono-covalent bounds in black. ... 10
Fig. 1.6: Left-Handed and Right-handed quartz [2]. ... 12
Fig.1.7: Inclusion detection and seed localization with white light [10]. ... 13
Fig.1.8: X-ray topography of Y-cut plates. ... 14
Fig.1.9: Value of the IR transmission versus wavelength expressed in cm-1 (left) and parameters (at 3410, 3500 and 3580 cm-1) versus inverted wavelength of crystal bar (right) [10]. ... 16
Fig.1.10: Description of the axis of quartz and X, Y, and Z rotational cuts [12]. ... 16
Fig.1.11: Zero temperature–coefficient quartz cuts [2]. ... 17
Fig. 1.12: Schematic representation of various cuts in the quartz crystal [12]. ... 18
Fig.1.13: Schematic diagram of quartz AT cut [13]. ... 18
Fig.1.14: Schematic diagram of quartz SC cut. ... 19
Fig.1.15: Temperature dependent resonant frequency of langasite, gallium phosphate and quartz BAW resonators [14]. ... 20
Fig.1.16: Crystal structure of Langasite. (a) a1-a2 plane and (b) a1-c plane are viewed from [001] and [120], respectively. (c) four kinds of cation of cation polyhedra [15]. ... 21
Fig.1.17: Gallium orthophosphate (GaPO4) crystal. ... 23
Fig.1.18: Model of temperature-frequency curve of AT cut [27]. ... 27
Fig.1.19: Frequency-Temperature characteristics of AT-cut for different values of θ. [2]. ... 27
Fig.1.20: Typical frequency-temperature characteristics of SC-cut, third overtone, for different values of θ. varies from -1’ to 8’ from = 34°, [27]. ... 28
Fig.1.21: Equivalent electrical circuit [27]. ... 28
Fig.1.22: Resonance and phase curves [27]. ... 30
Fig.1.23: Load capacitance in series[27]. ... 31
Fig.3.1: Geometric definition of a plano-convex resonator. ... 72
Fig.3.2: Sy(1 Hz) as a function of the volume between the electrodes of the resonator for experimental points from various authors. ... 76
Fig.3.3: Q4Sy as a function of the volume between the electrodes of the resonator, experimental points from various authors + straight line for Handel’s prediction with = 1 cm3... 77
Fig.3.4: Q4Sy as a function of the acoustic volume of the resonator (given by (3.55) for plano-convex resonators and (3.65) for plano-plano resonators), experimental points from various authors + straight line for Handel’s prediction with = 1 cm3. ... 77
Fig.3.5: Phonon dispersion curves for -quartz, i.e. eigenfrequencies (in THz) as a function of one of the vibration wave vector reduced coordinate, following paths along several cristallographic directions, starting from the center of the Brillouin zone (), going in the direction ( K), then in the direction (KM),or in the direction (A) Left: Circles are experimental values and solid lines represent the results of our calculations for 6.5 million time steps in LAMMPS. Right: Circles are experimental values and solid lines represent the results of the quasi-harmonic calculations of Gonze et al. [50] ... 83
Fig.3.6: -quartz phonon density of states vs frequency (in THz), for 6.5M time steps in LAMMPS. ... 84
Fig.3.7: -quartz phonon density of states vs frequency (in THz), as digitized from Fig. 1 of Ref. [38], which is recalled in the insert. ... 84
Fig.3.8: Experimental X-VDOS of a-quartz (room temperature) compared to the calculated X-VDOS (with the CASTEP code) and the true VDOS (as measured by neutron inelastic scattering). The areas underneath the curves are normalized to the same surface. (Fig. 1 from [51]). ... 85
Fig.4.1: Resonator design. ... 100
Fig.4.2: Variations of Sy() in log-log scale. ... 102
Fig.4.3: Behavior of Sy(ω) for various values of φ for a thickness oscillation mode with / ∙ rad/s. The transition frequency between the 1/ω regime and the white noise regime is proportional to φ. At low frequencies Sy(ω) is also proportional to φ, whereas at resonance and above the influence of φ can be completely neglected with respect to the traditional viscoelastic damping term. ... 103
Fig.4.4: Motion of a pinned dislocation loop under the influence of externally applied stress (A. Granato and K. Lucke, “Theory of mechanical damping due to dislocations”, J. Appl. Phys. Vol. 27, No-583, 1956. (page.584)). ... 105
Fig.4.5: The stress-amplitude dependence of the decrement (A. Granato and K. Lucke, “Theory of mechanical damping due to dislocations”, J. Appl. Phys. Vol. 27, No-583, 1956. (page.584)). ... 106
Fig.5.1: Quartz C2 crystal block. ... 112
Fig.5.2: Quartz crystal bars and their positions in the crystal. ... 112
Fig.5.3: SC-cut plates obtained in the quartz crystal bar. ... 112
In bar 11 to 14, the position of all resonators is known along the bar. Resonators from bar 1 to 11 are not precisely localized along the bar. ... 112
Fig.5.4: Quartz resonator. ... 113
Fig.5.5: X-ray topography of the resonator in its (300) vibration mode [5]. ... 113
Fig.5.6: Motional resistances of measured resonators. ... 114
Fig.5.7: Resonant frequency of the measured resonators. ... 115
Fig.5.10: Resonator noise measurement set-up. ... 117
Fig.5.11: Typical phase noise measurement. ... 118
Fig.5.12: Transfer function: a) amplitude b) phase. ... 119
Fig.5.13: Noise measurements from resonator cut in bar 14 [2]. ... 120
Fig.5.14: Noise measurements from resonators [8]. ... 121
Fig.5.15: General construction of the cryogenic system [15]. ... 122
Fig.5.16: Schematic diagram of the pulse tube cryocooler [16]. ... 123
Fig.5.17: Resonator impedance measurements [15]. ... 124
Fig.5.18: Resonator noise as a function of Q-factor of the resonators for different modes of vibration (Temperature 4K). ... 125
Fig.5.19: Resonator noise as a function of Q-factor of the resonators for anharmonic modes of C300 (Temperature 4K). ... 126
Fig.5.20: Resonator noise as a function of Q-factor of the resonators for overtone modes of C300. ... 127
Fig.5.21: Time measurement setup [8]. ... 127
Fig.5.22: a) Synchronization signal, b) Attenuation of resonator a, c) Zoom on a maximum value of resonator a. ... 129
Fig.5.23: Attenuation signal of resonator h. ... 130
Fig.5.24: Residuals of the fit (in mV) as a function of the number of the residual for resonator a (top left), b(top right), f (bottom left), g (bottom right). The upper (or lower) enveloppe could be described by piecewise linear functions giving some hint at solid friction, as discussed in the conclusions. ... 132
Fig.5.25: Zoom of Fig.5.24. Zoom on the residuals of the fit as a function of the number of the residual used in the figure, for resonator f. ... 132
List
of tables:
Table 1.1: Most important crystallographic forms in quartz. ... 12
Table 1.2: Chemical impurities measured in the crystal block. ... 15
Table 1.3: Material properties of -Quartz, GaPO4, LGS, LGT. ... 24
Table 1.4: Values of the expansion coefficients of -Quartz, GaPO4, LGS, LGT (given at 25 °C). ... 24
Table 1.5: Values of the piezoelectric and dielectric constants of -Quartz, GaPO4, LGS, LGT (given at 25 °C). ... 25
Table 1.6: Values of the elastic constants of -Quartz, GaPO4, LGS, LGT (given at 25°C). ... 25
Table 1.7: Values of the temperature coefficient of elastic constants of -Quartz, GaPO4, LGS and LGT (given at 25 °C). ... 25
Table 1.8: Correspondence between noise types, power spectral densities and Allan variance (fh is the high cut-off frequency) [31]. ... 36
Table 3.1: Comparison of the short-term stability in terms of Allan standard deviation y_floor of a SC-cut, 5 MHz and 3rd OT resonator. ... 75
Table 3.2: Resonator parameters from [35] and [36] used to draw Fig.3.4. Q factor of resonators from [36] have been found more precisely in [37]. ... 78
Table 3.3: Parameter set for quartz BKS potential. ... 81
Table 3.4: Average frequency for different time steps. ... 86
Table 5.1: Theoretical values of resonant frequencies of the designed resonator for A, B and C modes (overtones and anharmonic modes of C300 modes (Temperature = 4 K)). ... 124
Table 5.2: Q-factor at cryogenic temperature of selected resonators (a to l in Fig.5.14). ... 125
Table 5.3: Resonators selected for time measurements. ... 128
Table 5.4: Loaded Q-factor measured from the logarithmic decrement of weakly damped oscillations, for several very good and not so good resonators. ... 131
Introduction:
From last few decades, frequency control technology has been the heart of modern day electronics due to its huge area of applications in communication systems, computers, navigation systems or military defense. Frequency control devices provide high frequency stabilities and spectral purities in the short-term stability domain. However, improvement of the performance of these devices, in terms of frequency stability on the long term, remains a big challenge for researchers.
Frequency control systems are often made with ultra-stable oscillators (USO) using quartz crystals or atomic clocks in which quartz crystals provide the short term stability while the atomic part provides the accuracy. Hence, piezoelectric quartz crystals are the backbone of most of the frequency control systems due to some important features such as, availability of zero temperature coefficient cut, stress compensated cut, low loss, high , abundance in nature and low cost. Indeed, following John R. Vig, we may question “What would happen if all the quartz crystal stop vibrating?” [1], since then, the entire communication systems would be disabled, and all the computers would stop working... Furthermore, the number of users of such systems has been growing so rapidly that engineers keep trying to reduce the channel spacing in a given frequency band. Hence, the frequency tolerance of the communication systems should be tighter for both transmitters and receivers. Reducing noise in order to increase the short term stability and avoid unwanted switching between channels is thus very desirable. It is commonly admitted that the fundamental limitation to this short-term stability is due to flicker frequency noise in the quartz resonators. For more than fifty years many researchers have tried to find the physical origin of this inherent flicker noise, but till now there is no effective model to predict the origin and amplitude of flicker noise so that it is still an important fundamental problem for the current generation.
This work is directed to investigate the physical origin of quantum / noise (or pink noise where the spectral density of frequency fluctuation is inversely proportional to the frequency). Numerous scientists have proposed models on the origin of / noise for different types of physical systems. But in their model, effective means to improve the frequency stability of the quartz crystal resonators cannot be found (except maybe in some of P. H. Handel’s papers). Hence, providing a physical model of good but not perfect piezoelectric resonators in order to get better fabrication yields, better frequency stability and higher spectral purity for space application, navigation and military defense systems is the main objective of this PhD thesis.
Recently, several other piezoelectric materials than quartz have been considered for applications at high temperatures (several hundred °C). In most cases, researchers and engineers are trying to reduce the flicker noise of ultra-stable oscillators or MEMS made with these new synthetic materials arbitrarily by using electric or electronic circuits instead of trying to find the fundamental physical origin of the flicker noise applicable for the whole class of material. However, this kind of task has been a formidable challenge for more than fifty years, because one needs to deal with many different aspects of physics (classical, quantum, statistical, …) and engineering. The goal of this PhD thesis was nonetheless to tackle this subject, with the help of a pluridisciplinary team of supervisors, in a pluridisciplinary institute of research. The progresses we have been able to do theoretically and experimentally are discussed in details in this document.
In this manuscript, the first chapter recalls the basic crystallography, quartz crystal cuts, impurities in quartz and definitions of time and frequency domain needed to explore ultra-stable resonators and oscillators. The second chapter is devoted to a summary of the different theories and models on flicker frequency noise based on the different physical and mathematical background. Then, the third chapter concerns our studies on Handel’s quantum / noise model, which although criticized by many, is still the only one that provides an estimation of the floor amplitude of / noise that is not invalidated by experimental data. In the fourth chapter, another approach, based on the fluctuation-dissipation theorem, is used in order to put numerical constraints on a model of / noise caused by an internal (or structural) dissipation proportional to the amplitude and not to the speed. The last chapter is devoted to experimental results. An ultra-stable resonator used during this study is described. Phase noise measurements on several batches of resonators are given. Measurements of resonator parameters have been done at low temperature in order to correlate them with noise results. Another approach with a procedure that use transient pseudo periodic oscillations and put to their limits the capacities of presently available digital oscilloscopes, is presented, in order to assess rapidly the quality of various resonators.
Chapter
1:
General Overview
1. Piezoelectricity
Piezoelectricity is the consequence of the linear interaction between the mechanical deformation and the electrical polarization of matter. Piezo is derived from the Greek word piezin and means “to press”. Piezoelectricity in piezoelectric crystals is due to the fact that an external mechanical stress which deforms the crystal lattice causes a separation of the centers of gravity of the positive and negative charges. This charge separation then generates a net dipole in each primitive unit cell of the crystal (Fig.1.1). As a result a dielectric polarization appears which changes the macroscopic electric field in the material (Fig. 1.2, upper part). This is known as the direct piezoelectric effect. In direct piezoelectric effect, the change of electric polarization is proportional to the strain.
Fig.1.1: Schematic diagram of charge separation inside a piezoelectric crystal under the influence of external mechanical stress [2].
In converse piezoelectric effect, a piezoelectric crystal becomes strained under the influence of an external electric field (Fig.1.2, bottom part). Under a force F, a polarization P will appear inside the crystal. Thus displacements x will occur.
Fig.1.2: Direct and converse piezoelectric effect [3].
Piezoelectric crystals can make good oscillators due to three main propertiesμ 1) Internal dissipation in most of the piezoelectric crystals is very low
2) The density and elastic constants are very uniform, so that crystal cuts with the same given orientation have the same characteristic frequencies.
3) Different kinds of crystal cuts are possible which have distinct advantageous physical properties.
1.1. General constitutive equations of piezoelectricity
To understand the elastic constants and piezoelectric equations as described by L. E. Halliburton et al. (1λ85) [4], let us consider a cube with side length l inside the solid with the origin of orthogonal coordinate system located at the center of the volume element (Fig. 1.3).
Fig. 1.3: The forces on the faces of a cube located inside a stressed body [4].
Here Cauchy’s stress tensor1 is represented by the symbol and strain is represented by the symbol . Under the application of a complex stress the point with initial coordinates , , is displaced to the position , , . The components of the strain tensor are given byμ
(1.1) Then Hooke’s law is given by23μ
(1.2)
or (1.3)
where is the elastic stiffness tensor and the elastic compliance tensor. Both of them are fourth rank tensors. Hooke’s law is a linear approximation, valid for small strains (with respect to 1) and in the absence of any other multiphysics effect.
1 The component of the stress vector is given by ∑ , with the component of the vector normal to
the surface on which the stress acts.
Indeed, in direct piezoelectric effect, applied stress produces an additional electric polarization given byμ
∆ (1.4)
Since and are connected by Hooke’s law, this can also be expressed asμ
∆ with (1.5)
The superscript E denotes whether the electric field has been held fixed during the measurement. Similarly, for the converse piezoelectric effect, crystal becomes (further) deformed under the application of an electric fieldμ
∆ (1.6)
or equivalently (in linear response theory)μ
∆ (1.7)
and represent the piezoelectric strain tensor and piezoelectric stress tensor respectively. So the total (small) strain experienced by the crystal, in these conditions, is the sum of two contributions, one due to the applied stress and the other due to the applied field via piezoelectric effectμ
(1.8) Similarly the total polarization is given byμ
(1.λ) where corresponds to the electric susceptibility, measured under constant stress , of the material under consideration.
Then, the dielectric displacement is obtained by adding to the left hand side of (1.λ) and to the right hand side of (1.λ) 4μ
(1.10) Alternatively, one can choose strain and electric field as independent thermodynamic variables. The characteristic equations then becomeμ
derivation), it can be shown that stress and strain tensors are symmetric, so that and , that and must also be symmetric with respect to the interchange of the first and second pair of indices, that and must be symmetric. Furthermore, it can be shown that5
and that6 .
1.2. Voigt’s notations
Due to all the symmetry relations, a lot of coefficients are equal, hence a more compact matrix notations is possible (Voigt’s notations). Hence a pair of symmetric indices running from 1 to 3 is replaced by a single index running from 1 to 6μ
11 22 33 23 or 32 13 or 31 12 or 21
1 2 3 4 5 6
Hence stress and strain tensors become 1×6 matrices, while piezoelectric tensors become 3×6 matrices, stiffness and compliance become 6×6 matrices and dielectric permittivity becomes a 3×3 matrix. However, due to the equivalence of indices 4, 5 and 6 to 2 different pairs of indices , one must be careful not losing factors of 2. It is therefore usually defined thatμ
, and (1.13)
with the number of Greek indices equal to either 4, 5 or 6 or equivalently to the number of pair(s) of roman indices that are not equal7.
This means thatμ
, , , , ,
, , , , ,
, , .
, , ,
Using these notations, we haveμ
or (1.14)
In this linear approximation, the first set of constitutive relations in the above equations can thus be written, for any anisotropic material in any coordinate system, asμ
(1.15)
1.3. Simplifications for the trigonal crystallographic class
In our case, we will be interested by materials in the 32 trigonal class. Taking into account this additional symmetries, the dielectric matrix is given byμ
(1.16) The piezoelectric stress matrix is given byμ
(1.17)
and the elastic stiffness by (with / )μ
(1.18)
It can then be proved that the compliance matrix is of the same form than the elastic stiffness matrix except that and that piezoelectric strain matrix ̿ ̿ ∙ is of the same form than the piezoelectric stress matrix, except that .
1.4. Electromechanical coupling factor
k is generally expressed using piezoelectric coefficients [5]μ
(1.20) with lithe wave vector directions.
2. Crystal characteristics
2.1. Quartz crystal
The chemical formula of Silica (SiO2) consists of two elements, oxygen and silicon. Silica crystalizes into a number of different structures among which quartz, trydimyte and cristobalite are the most common whereas the crystalline polymorphs coesite, stishovite and keatite are rare [6] (Fig.1.4). Only one allotrope of silica, low quartz commonly known as alpha quartz, has application in frequency control systems. Alpha quartz is a member of the 32 point group that exists in two chiral varietiesμ left- handed alpha quartz ( space group) and right-handed quartz (
space group).
Fig.1.4: Phase diagram of Silica (SiO2) [2].
2.1.1. Quartz Crystallography
2.1.1.1. DEFINITIONS OF THE CRYSTALLOGRAPHIC AND CARTESIANS AXES
Normally alpha quartz can be viewed as rigid SiO4 tetrahedra connected at their corners by flexible Si-O-Si articulations [6]. The four oxygen atoms surround a silicon atom8 where the Si-O long bond distance is 1.612 Å and Si-O short bond is 1.606 Å. The angle O-Si-O is 10λ°, while the angle Si-O-Si is 144.2° (Fig.1.5) [7].
Fig.1.5: The quartz lattice (from http://volga.eng.yale.edu/sohrab/grouppage/pics/SiO2bulksupercell.jpg). Si atoms/ions are in red, Oxygen atoms/ions in blue, iono-covalent bounds in black.
In fact, due to the 32 symmetry class, the basic structural unit of quartz is a group of three connected SiO4 tetrahedra. However, since oxygen atoms are shared among two silicon atoms and therefore each account for ½, the crystallographic primitive unit cell chemical formula is Si3O6. Hence, in crystallographic databases, one can find the coordinates of these λ entities in a Cartesian frame that can however differ from a database to anotherλ.
The coordination system of the alpha quartz can then be defined as a single axis of threefold symmetry known as trigonal axis (or optical axis10) and the three axes of twofold symmetry ( , , and ), known as diagonal axes (or electrical axes), perpendicular to the trigonal axis [8]. The
major axis of quartz growth is c axis and it is taken parallel to Z axis (called optical axis) having positive arbitrary direction, in an orthogonal XYZ coordinate system. A quartz crystal having 6
piezoelectricity ANSI/IEEE Std 176-1λ87, table 5). The Y axis (called mechanical axis11) is chosen to form right handed coordinate system for both left and right-hand alpha quartz. The Y axes are perpendicular to the prism faces ( family of crystallographic planes) and X axes bisect the angles of the adjacent prisms (and would be perpendicular to the family of crystallographic planes).12
2.1.1.2. LEFT AND RIGHT HANDED QUARTZ
When a linearly polarized light beam is transmitted along the optic axis then a rotation of the direction of polarization occurs and the amount of the rotation is in first approximation proportional to the path length in quartz13. The direction of rotation can be used to understand the difference between left and right-handed alpha quartz. For the dextrorotary alpha quartz, the rotation of the plane of polarization is clockwise if the rotation is observed towards the source of light and the rotation is anti-clockwise for the levorotary alpha quartz14. This comes from the fact that, in a quartz crystal, the Si and O ions can be viewed as forming parallel, corkscrew-like chains or helices.
In quartz crystal the orientation of the x and s faces15 with respect to the prism faces give a way of differentiation between left and right handed alpha quartz (Fig. 1.6). The different faces correspond to different crystal lattice planes. They can be related to different forms, and accordingly the whole crystal can be viewed as the intersection of these forms. Table 1.1 lists the most important crystallographic forms in quartz.
11 If a mechanical stress is applied to opposite faces perpendicular to the mechanical axis, along that
axis , equal and opposite net charges appear on opposite surfaces perpendicular to the electric axis , (direct piezoelectric effect). Conversely, if a time varying potential difference is applied to opposite faces perpendicular to the electric axes , then the crystal vibrates along the corresponding mechanical axis (inverse piezoelectric effect).
12 Even with the directions of the axes fixed, the origin of the frame still remains to be fixed…
13 According to httpμ//en.wikipedia.org/wiki/Optical_rotation, this effect was first observed in 1811 in quartz (!) by
French physicist François Arago, whereas John Herschel realized in 1822 that 2 crystals images from one another through a mirror symmetry, would rotate the polarization by the same amount but in opposite directions.
14 A dextrorotary substance (crystal or solution) makes the polarization direction turn clockwise around the propagation
direction as seen by an observer that receives light, while a levorotary substance makes it turn anticlockwise. This should normally not be mistaken with right or left handedness since these are normally two variants of a property of a non-linearly polarized propagating electromagnetic wave for which two conventions exist (e.g. clockwise rotation as seen from the source or from the detector). For a right-handed circularly polarized wave the polarization vector makes a complete turn clockwise after propagation on a distance equal to the wavelength, which is usually not the case for the propagation of a linearly polarized wave in a dextrorotary substance.
15 “The typical s-face is a rhomb, whereas an x-face is usually either a triangle or - when it is bordering an s-face - a
Table 1.1: Most important crystallographic forms in quartz. Form Symbol Positive Rhombohedron r Negative Rhombohedron z Hexagonal Prism m Trigonal Bipyramid s Positive Trapezohedron x
Right handed quartz is the usual characteristic of the synthetic quartz that can be found on the sale market.
Fig. 1.6: Left-Handed and Right-handed quartz [2].
2.1.1.3. TWINNING AND PHASE TRANSITIONS
Both optical and electrical twins occur in alpha quartz. The orientation of left and right handed quartz crystal depends on the orientation of the seed crystal. The synthetic quartz produced is generally right-handed quartz, whereas in natural quartz both left and right handed properties are equally distributed. The material in which left and right-handed forms are mixed is known as
When alpha quartz is heated above 573°C at 1 atmosphere pressure, then alpha quartz changes into the hexagonal beta quartz. If the material is cooled down below 573°C temperature then it will again be reverted into alpha quartz but the material will be electrically twinned. Similarly an application of large mechanical stress can induce twining in the material. So, at the time of the processing of resonators it is necessary to avoid mechanical and thermal shocks on the material.
2.1.1.4. STRUCTURAL DEFECTS
Exhaustive lists of quartz defects can be found in the literature [7], [8]. In this paragraph, we just give the characteristics measured for the very high quality quartz crystal that was used to build the quartz resonators measured during this PHD thesis (see chapter 5). It is representative of the very high quality of the recent synthetic quartz crystals. Inclusions, dislocations and surface defects are the dominant structural defects in quartz crystals [7].
The IEC-758 standard defines the inclusion density by cm3 [λ]. This standard takes into account several sizes of inclusions. In the best grade (Ia), the number of inclusions must be equal or lower than 3, 2, 1 and 1, respectively in the 10-30 m, 30-70 m, 70-100 m and above 100 m size classes. Fig.1.7 shows the quartz crystal block illuminated with a white light beam. The big inclusions are clearly visible (single light spots). Most of them are located near the seed of the crystal block (horizontal white bar in the middle of the crystal). They are not taken into account because this part of the crystal is not used. Finally, the number of inclusions above 10 m corresponds to the Grade Ia standard.
Fig.1.7: Inclusion detection and seed localization with white light [10].
Concerning dislocations, X-ray topography is usually used to observe the residual dislocations inside the crystal. This topography is done in thin plates (“blanks”) cut perpendicularly to the Y-axis (see § 2.1.2 in this chapter for the quartz cuts), which corresponds to the longest dimension of the crystal block (Fig.1.7). Fig.1.8 presents the results obtained in two such plates (the cutting of these plates is detailed in chapter 5). The length of exposure of the photos is about 5h30 with an X-ray vertical beam given by a generator of 45 kV with 25 mA.
X Y
Fig.1.8: X-ray topography of Y-cut plates.
The number of dislocations, observed inside the black square zone with seed excluded, is visible. It is about 1 to 3 per cm2 which corresponds to a very high quality quartz crystal.
Surface defects occur principally due to the polishing of the convex face of the resonator. This process step may be done differently by the manufacturers with which we have worked and is covered by confidentiality agreements. However, since we are concerned by noise in bulk acoustic wave oscillators, we will disregard surface defects in the following hence supposing that their effect is negligible compared to the effect of the bulk defects.
In quartz minerals, one can also find traces of other elements than Si and O, e.g. H, Li, Al, Na, Ti, Fe, … [7]. These elements cause distortions in the quartz structure so that the optical properties can change and quartz which should normally be transparent to visible light, can get colored. Hence the distribution of some kinds of impurities can be detected with a good resolution by cathodoluminescence16.
Chemical impurities of our crystal block have been measured by an inductively coupled plasma mass spectrometry technique (ICP-MS method). This method is a type of mass spectrometry which is capable of detecting metals and several non-metals at concentrations as low as one part in 1012 (part per trillion). This is achieved by ionizing the sample with inductively coupled plasma and
Seed
Seed
pure Z Dislocation
analysis. The preparation procedure was composed of three stepsμ cleaning, dissolution and analysis. Table 1.2 presents the results of two samples from the triangular crystal parts in the front and end of the block. The impurities rates are very low and seem homogeneous along the crystal block. The Li concentration is similar in both samples. The concentrations of Al, Na, Li and K, lower than 0.1 µg/g, correspond to a very high quality of the crystal even though the Ca concentration varies between 0.2 to 0.5 g/g. The Fe concentration (lower than 1 g/g) seems to be more important at the front of the block and requires more investigations to confirm this difference.
Table 1.2: Chemical impurities measured in the crystal block.
(in ppmw) Front block End block Li 0.0λ ± 0.03 0.1 ± 0.02 Na < 0.07 < 0.05 Mg < 0.0004 < 0.0003 Al < 0.03 < 0.02 K < 0.06 0.058 ± 0.001 Ca 0.22 ± 0.02 0.45 ± 0.03 Fe 0.λ8 ± 0.02 < 0.0001
Furthermore, fundamental resonant frequencies of vibration of quartz crystal are sensitive to infrared beam with low energy (typically between 10-21 and 10-1λ Joules equivalent to 10 meV to 1 eV). This kind of measurements is used to define the intrinsic quality factor of the crystal [8]. The infrared measurements have been achieved with a Fourier transform infrared (FTIR) spectrometer (Nicolet Magna 750). With IR transmission measurements at room temperature, the absorption parameter is defined according to the IEC758 standard [λ], by reference with the transmission at 3800 cm-1. The expression for is given by the following equation, where d is the thickness of the sample (generally chosen perpendicular to the Y-axis) expressed in cm and T is the transmission in percentμ
ln (1.21)
Measurement of the IR absorption rate along a quartz bar are usually performed to check the homogeneity of the areas Z along the Y axis of the bar by scanning the sample at a constant wavelength (3500 cm-1) from the seed to outwards. It requires the polishing of the Z surfaces. In our
along the 70 mm of the bar. The thickness of the bar is equal to 14 mm. The Z-faces of sample have been polished with 5 µm abrasive grains. As an example, Fig.1.λ presents the parameter of one of the quartz bars.
Fig.1.9: Value of the IR transmission versus wavelength expressed in cm-1 (left) and parameters (at 3410, 3500 and 3580 cm-1) versus inverted wavelength of crystal bar (right) [10].
The value of α3500 is close to 0.023. This value corresponds to a class which is the best one defined in IEC758 standard [λ]. The expected quality factor computed from an empirical relationship [11] gives a Q-value of about 2.8106 for a resonator working at 5 MHz. This value is in good agreement with those measured for the ultra-stable quartz resonators used in Chapter 5.
2.1.2. Quartz crystal cuts
A small piece of quartz material is obtained by cutting the crystal at specific angles to the various axes. In frequency control the different cuts are used to produce different kinds of performances according to the temperature sensibility (cf. §3.1.1), and different physical and electrical parameters of the resonators. Cuts are defined by the two rotation angles θ and φ around the X and Z crystallographic axis respectively. There are cuts along the crystallographic axis, such as X-cut and Y-cut crystal (Fig.1.10). In X-cut, the prism face should be normal to the X axis. The advantage of this cut is that it produces relatively large voltage under compression. However, there is a decrease in frequency when temperature increases. For the Y cut resonator, the prism face of the crystal should be normal to the Y axis and the advantage of this cut is that it exhibits positive temperature coefficient.
Formerly, searchers and engineers were usually interested by zero temperature-coefficient cuts in which temperature coefficient lies along the locus of the zero temperature (Fig.1.11). In this figure, blue and dash lines represent cut angles where first order temperature coefficient of the frequency is equal to zero. This kind of cuts has usually two-letter names, where “T” in the name represents the temperature-coefficient cut. AT cut was the first temperature compensated cut discovered.
Fig.1.11: Zero temperature–coefficient quartz cuts [2].
The FT, BT and CT are other different zero temperature compensated cuts, used in past for some special properties before discovering SC cut (Fig. 1.12).
Fig. 1.12: Schematic representation of various cuts in the quartz crystal [12].
2.1.2.1. AT CUTμ
AT cut is the most popular cut in industry because it has very good performance over a wide temperature range. For AT cut, the rotation θ of the Z-axis around the X axis is equal to 35°15΄ and it is known as temperature compensated cut (Fig.1.13). AT cut is used for electronic instruments where oscillators are required to run in the range 500 kHz to 500 MHz. AT cut are used for TCXO (Temperature Compensated Crystal Oscillator). For AT cut necessary tolerance is ±30΄΄. Inflection temperature of AT cut is 25°C.
double rotation, with X-axis rotation φ is approximately 21.λ3° and Z-axis rotation θ is equal to 34.11° (Fig.1.14)17 with a tolerance of ′′. The SC cut has 2 quasi-thickness shear modes, the C mode which has classic cubic thermal coefficient and the B mode which has a steep positive slope operating approximately +10% higher in frequency than the C mode. The SC cut oscillator has the capability to trap out the B mode if the operation of the C mode is only desired. SC cut resonators are generally operated within the frequency range 0.5 to 200 MHz.
Fig.1.14: Schematic diagram of quartz SC cut.
SC cut oscillators are usually used for OCXO (Oven Controlled Crystal Oscillator) applications since it has a low temperature turn over point (70~85)°C which corresponds to a null slope of the frequency-temperature curve (see §3.1.1). The inflection temperature of SC cut is around λ3°C. The advantages of SC cut areμ
Thermal transient compensated allows faster warm up OCXO.
Static and dynamic behaviors of frequency vs temperature allows higher stability OCXO and MCXO (Microcomputer-Compensated Crystal Oscillators).
Lower motional capacitance (cf. § 3.1.2). Higher factor.
Higher frequency times thickness constant18. Lower phase noise and better short term stability. Higher operating temperature.
Lower acceleration sensitivity. Improved thermal stability. Improved thermal stress.
But much higher cost due to the difficulty of the two cutting angles is the big disadvantage of SC-cut quartz.
2.2. Crystals Homeotypic to Quartz (LGS, LGT and GaPO4)
During the last two decades, a new group of materials isomorphous with quartz has been developed and studied for high temperature piezoelectric crystal devices [14]. Traditional piezoelectric materials such as quartz are widely used for high precision frequency control systems and sensor based applications. However, at normal pressure and 573°C, the trigonal -quartz will transform into hexagonal -quartz, thus limiting the temperature at which quartz crystal devices can be used. Crystals homeotypic to quartz such as Langasite (LGS), Langanite (LGN), Langatate (LGT), Berlinite (AlPO4), Gallium Orthophospate (GaPO4) are promising candidates for high temperature applications, since their phase transition temperature or melting point is far higher than 573°C (Fig.1.15). Furthermore, their piezoelectric and electromechanical coupling constants are higher than those of quartz, they also exhibit temperature compensated cuts for various modes of vibration and they have lower acoustic attenuations than quartz and higher quality factor for AT and SC-cut than quartz.
Fig.1.15: Temperature dependent resonant frequency of langasite, gallium phosphate and quartz BAW resonators [14].
[1λ], magnetic properties [21] have been studied and compared with quartz. The interesting characteristic of langasite is its high temperature performance because it has no phase transition up to the melting point at 1475°C. Furthermore, the piezoelectric factor d11 of langasite is 2.7 times
greater than that of quartz, so this allows to make piezo sensors with significantly higher sensitivity. The langasite family crystal structure has the same trigonal symmetry than quartz with spacegroup P321 and is isostructural to CaGa2Ge4O14 [22]. Langasite is a piezoelectric material according to its composition, that is, La, Ga and silicate minerals with structural group A3BC3D2O14, where A and B represents a decahedral site coordinated by eight oxygen ions, and an octahedral site coordinated by six oxygen ions, respectively; while C and D represent tetrahedral sites coordinated by four oxygen ions, with the size of D site being smaller than that of the C site. In case of Langasite, La3+ occupies the A sites, Ga3+ occupies sites B, C and half of the D sites and Si4+ occupies the half of the D sites as shown in Fig.1.16.
2.2.2. Langatate (La3Ga5.5Ta0.5O14)
Langatate (LGT) is another synthetic piezoelectric crystal homeotypic to quartz, with chemical composition La3Ga5.5Ta0.5O14. It has exciting properties, such as its higher piezoelectric coupling, structural stability up to 1400°C and presence of temperature compensated acoustic wave orientations, which have drawn the attention of sensor and frequency control communities as a possible alternative to quartz. The advantages of langatate areμ
1) no Langatate phase transitions at normal pressure, up to the melting temperature 1450°C. 2) It has no pyroelectric effect.
3) Langatate has very small hysteresis loss. 4) High electromechanical coupling factor.
5) Steady-state value of piezoelectric constant d11 in a temperature range up to 600 °C (less than 5% change up to 450 °C).
6) High electrical resistivity.
Its piezoelectric properties [23], [24] dielectric and elastic properties [23], piezoelectric coupling factor [25] have been studied for high temperature applications in acoustic waves sensors or timing, and frequency control. Y cut oscillators are usually used for OCXO applications.
2.2.3. Gallium orthophosphate (GaPO4)
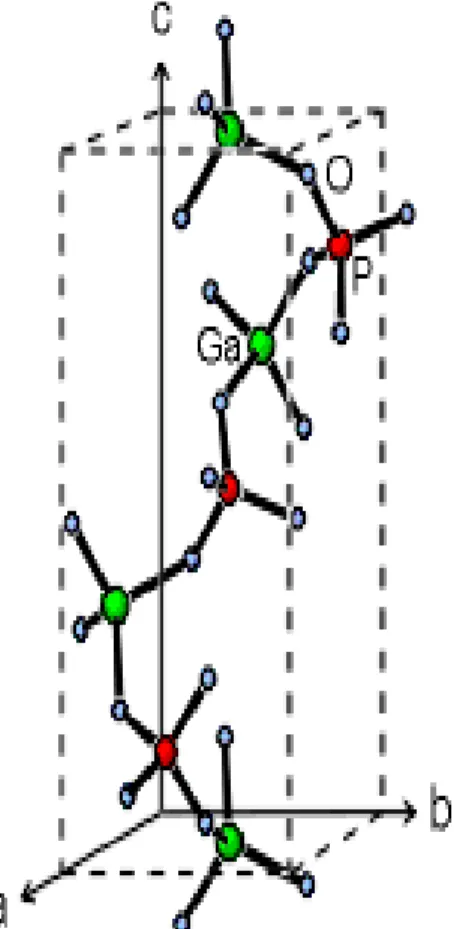
Gallium Orthophosphate is a quartz homeotypic piezoelectric crystal with a high sensitivity and a thermal stability up to λ70°C. The number of formula units per unit cell is 3, the same as in quartz, but due to the alternate sequence of Ga and P there is a doubling of the unit cell dimension in the c-direction, compared with quartz (Fig.1.17). The detailed crystal structure and temperature dependence of gallium orthophosphate was studied by H. Nakae et al. [26].
Fig.1.17: Gallium orthophosphate (GaPO4) crystal.
There exist two enantiomorphous structures of GaPO4 with the alpha-quartz space group and , yielding the (structural) right-handed and left-handed varieties. The lattice parameters are a = 4.λ01 Å and c = 11.048 Å at room temperature. GaPO4 is not ferroelectric so it has no Curie temperature and it does not show any pyroelectric effect. Gallium orthophosphate exhibits electromechanical coupling factors and longitudinal piezoelectric coefficients higher than those of quartz. GaPO4 is usually used for direct piezoelectric applications (accelerometers, force sensors), bulk acoustic wave applications (VCXOs – voltage controlled crystal oscillators –, OCXOs, chemical sensors, biosensors), surface acoustic wave applications (wireless identification system, remote control sensors). Y-16° cut oscillators are usually used in OCXO applications.
2.3. Materials constants comparison
A comparison of the material properties of alpha quartz, LGT, LGS and GAPO4 (LGT and LGS main properties from AXTAL, www.AXTAL.com, and GaPO4 properties from www.piezocryst.com) are given in the following tables.
Table 1.3 to Table 1.7 respectively present the general properties, the expansion coefficients, the piezoelectric and dielectric constants, the elastic moduli and the temperature coefficient of those elastic moduli for -Quartz, GaPO4, LGS and LGT.
Table 1.3: Material properties of -Quartz, GaPO4, LGS, LGT.
Material SiO2 GaPO4 La3Ga5SiO14 La3Ga5,5Ta0,5O14
Crystal space group 32 32 32 32
Melting point (°C) 1650 1670 1470 1510 Curie temperature (°C) 573
→
λ33
→ No phase transition No phase transition Lattice parameter (Å) a = b = 4.λ13 c = 5.406 a = b = 4.λ01 c = 11.048 a = b = 8.1685 c = 5.0λ20 a = b = 8.2470 c = 5.1303 Density (kg/m3) 2648.6 3570 5742.4 6126 Moh’s Hardness 7.0 5.5 6.5 6.4 Electromechanical coupling factor % X-cut vibrating according Y axis 10.λ 14.5 16.6 16.7
Table 1.4: Values of the expansion coefficients of -Quartz, GaPO4, LGS, LGT (given at 25 °C).
Material SiO2 GaPO4 La3Ga5SiO14 La3Ga5,5Ta0,5O14
13.71 12.78 5.68 6.17 7.48 3.6λ 4.08 3.λ3 6.5 10.6 5.43 4.77 2.λ 5 5.43 4.01 -1.λ -16.1 - - -1.5 -5.4 - -
Table 1.5: Values of the piezoelectric and dielectric constants of -Quartz, GaPO4, LGS, LGT
(given at 25 °C).
Material SiO2 GaPO4 La3Ga5SiO14 La3Ga5.5Ta0.5O14 d11 (10-12C/N) 2.31 4.5 -6.36 -6.54 d14 (10-12C/N) -0.726 1.λ 5.85 5.30 e11 (Cm-2) 0.171 0.20λ -0.456 -0.456 e14 (Cm-2) 0.0406 0.107 0.150 0.0λ4 ⁄ 4.428 6.1 18.λλ 1λ ⁄ 4.634 6.6 50.44 78.λ5
Table 1.6: Values of the elastic constants of -Quartz, GaPO4, LGS, LGT (given at 25°C).
Material SiO2 GaPO4 La3Ga5SiO14 La3Ga5.5Ta0.5O14 CE 11 (1010 Nm-2) 8.674 6.658 18.873 18.852 CE 12 (1010 Nm-2) 0.6λλ 2.181 10.45λ 10.788 CE 13 (1010 Nm-2) 1.1λ1 2.487 λ.624 10.336 CE 14 (1010 Nm-2) 1.7λ1 0.3λ1 1.414 1.351 CE 33 (1010 Nm-2) 10.72 10.213 26.151 26.18 CE 44 (1010 Nm-2) 5.7λ4 3.766 5.3λ 5.11 CE 66 (1010 Nm-2) 3.λλ 2.238 4.207 4.032
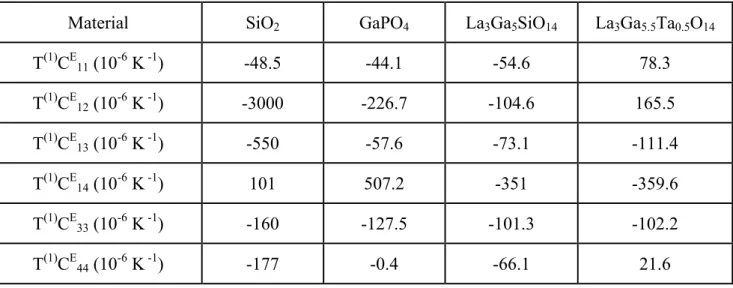
Table 1.7: Values of the temperature coefficient of elastic constants of -Quartz, GaPO4, LGS and
LGT (given at 25 °C).
Material SiO2 GaPO4 La3Ga5SiO14 La3Ga5.5Ta0.5O14 T(1)CE 11 (10-6 K -1) -48.5 -44.1 -54.6 78.3 T(1)CE 12 (10-6 K -1) -3000 -226.7 -104.6 165.5 T(1)CE 13 (10-6 K -1) -550 -57.6 -73.1 -111.4 T(1)CE 14 (10-6 K -1) 101 507.2 -351 -35λ.6 T(1)CE 33 (10-6 K -1) -160 -127.5 -101.3 -102.2 T(1)CE 44 (10-6 K -1) -177 -0.4 -66.1 21.6
T(1)CE 66 (10-6 K -1) 178 44.λ 7.51 -43.6 T(2)CE 11 (10-λ K -2) -107 -28.5 -72.3 -273.6 T(2)CE 12 (10-λ K -2) -3050 -70.8 -25.2 313.λ T(2)CE 13 (10-λ K -2) -1150 41.3 -64.λ -557.7 T(2)CE 14 (10-λ K -2) -48 280.6 212 1604.8 T(2)CE 33 (10-λ K -2) -275 -18.3 -63.2 -107.7 T(2)CE 44 (10-λ K -2) -216 -43.8 -74.2 -11.λ8 T(2)CE 66 (10-λ K -2) 118 -7.λ -131 -λ01.4 T(3)CE 11 (10-12 K -3) -70 -5λ.4 - - T(3)CE 12 (10-12 K -3) -1260 -205.7 - - T(3)CE 13 (10-12 K -3) -750 -10λ.λ - - T(3)CE 14 (10-12 K -3) -5λ0 -λλ.λ - - T(3)CE 33 (10-12 K -3) -250 -134.8 - - T(3)CE 44 (10-12 K -3) -216 -37.1 - - T(3)CE 66 (10-12 K -3) 21 11.λ - -
3. Crystal resonators and oscillators
3.1. Crystal resonators
A resonator is a device which produces electromagnetic or mechanical oscillations at resonant frequency by using the property of piezoelectricity. A crystal resonator can have many modes of vibration. Generally, only one of these modes is important for a particular application in communication systems. Resonators are usually used to generate the waveform with a specific
Fig.1.18: Model of temperature-frequency curve of AT cut [27].
In the equation (1.22), varies between +25°C and +35°C for AT cut crystal and from +85°C to +λ5°C for SC cut, depending on the dimensions of the crystal. The frequency-temperature characteristics is primarily dependent on the cut angle, because in equation (1.22), the quantity changes with , while is almost constant.
Fig.1.19: Frequency-Temperature characteristics of AT-cut for different values of θ. [2].
Note the different scale between Fig.1.1λ and Fig.1.20, the SC-cut presents a very low dependency of frequency against temperature. So, this is a big advantage of SC cut over AT cut.
Fig.1.20: Typical frequency-temperature characteristics of SC-cut, third overtone, for different values of θ.
varies from -1’ to 8’ from = 34°, [27]. 3.1.2. Equivalent circuit of crystal resonator:
The electrical equivalent circuit provides the link between the physical properties of crystal and the oscillator. The electrical parameters areμ
C0= Shunt capacitance (capacitance between the electrodes, crystal holder, leads).
C = Motional capacitance which represents the mechanical elasticity. L = Motional inductance which represents the mechanical inertia. R = Motional resistance which represents the mechanical losses.
34°-1’ 34°+8’
cut, thickness ), having its faces coated by thin electrodes, the current is given, without approximation, by [28]μ (1.23) ̅ (1.24) where (1.25) and (1.26) where is the density of the material.
and
̅ (1.27)
̅ is a so-called “stiffened” constants [2λ]. It is not a true elastic constant since it is defined only for plane wave and it depends on the propagation direction. Hence, here, the coefficients are expressed in the coordinate axes of the AT cut (rotated coefficients). The resonant frequency r is found by solvingμ
cotan (1.28)
At a frequency near r the current I1 can be approximated to the first order in - r byμ
̅ (1.2λ)
Where n is the overtone rank.
One then obtains an expression of the current which is of the same form than the current through a dipole consisting of a series circuit in parallel with a capacitance C0 withμ
̅ (1.30)
(1.31) To take into account the (small) damping in the material, one can simply replace c by c where is the viscoelastic coefficient. In this case become complex and is equivalent to the preceding capacitance in series with a resistance equal toμ
This results in the approximate equivalent circuit depicted in Fig.1.21. Let us insist on the fact that this modeling is valid only near the resonant (series) frequencyμ
√ (1.33)
Fig.1.22: Resonance and phase curves [27].
When a crystal operates at series resonance then it looks like purely resistive and the reactances of the inductor and capacitor are equal. A series resonant circuit is characterized by the angular frequency and its quality factor Q given byμ
, (1.34)
where the quality factor (Q) is usually defined asμ
≡ (1.35)
Q is inversely proportional to the linewidth of resonance. Classically, higher Q means higher
frequency stability and higher accuracy capability of a resonator.
With a load capacitance in series to the crystal (Fig.1.23), the resonance frequency is shifted according toμ
Fig.1.23: Load capacitance in series[27].
3.2. Crystal Oscillators
An electronic oscillator can be characterized as a device for producing a periodic oscillating signal such as sine wave or square wave. An oscillator produces AC signal of specific frequency from a DC power source. A simple harmonic oscillator circuit consists of an active amplifier and passive feedback network. If the output of the feedback amplifier can be used as a signal with suitable amplitude and phase then sustained oscillations can occur [6]. (Fig.1.24). Usually, the frequency of the main loop can be tuned by a voltage using a varicap diode in a small range (typically 1 or 2 Hz maximum at 5 MHz). Finally, an output amplifier is used as a buffer to get the final voltage level of the output.
Fig.1.24: Classical circuit of a crystal oscillator [2].
If the amplifier network has a voltage gain and the feedback network has a feedback ratio , then in order to sustain oscillations, one must have . Both and are complex functions of angular frequency and can be written as | | and | | where and are the phase shifts of the amplifier and feedback network respectively. Then the conditions for sustained oscillations areμ
| || | (1.38)
and (1.3λ)
These conditions (1.38-1.3λ) are called Barkhausen criterion. Equation (1.3λ) shows that, at the frequency of oscillation, the closed loop phase shift must be an integer multiple of . When the system is initially closed, the only signal in the circuit is noise. The component of the noise which satisfies the phase condition for oscillation propagates around the loop with increasing amplitude. Amplitude continues to increase until the amplifier gain is reduced by nonlinearities or by an automatic gain control (AGC). For the real world oscillators [30]μ
1. It is necessary that for small signalμ 2. For large signal gain saturationμ | |
3. The frequency of oscillation is determined by the phase conditionμ arg
3.2.1. Long-term and short term stabilities
A gradual change in frequency over days or months is known as aging or long term stability. This occurs for various reasons such as the change of crystal coefficients of elasticity due to creation or diffusion of defects, or when the crystal is subjected to stress or when trapped gasses escape. Aging occurs at a relatively constant rate per decade for each crystal (Fig.1.25).
oscillator with an adjustment range of 20 Hz can be corrected for λ or 10 years of aging at a 10-10 per day rate.
Short term Root Mean Square (RMS) frequency variations are a measure of the frequency fluctuations or phase noise. This can be defined as the standard deviation of the fractional frequency fluctuations for a specific averaging time (typically = 1 s for short term stability). This means that a time window is used to measure the value of δf/f, then the RMS value is computed from many time windows. Shorter or longer averaging times may be required to assess the accuracy for a given application. The manufacturers of high performance oscillators usually measure averages over 10-4 to 102 s and represent the results in log-log scale (Fig.1.26).
As detailed in the next paragraph, time domain stability is related to frequency domain measurements through the power spectral density of frequency fluctuations.
Fig.1.26: Exemple of short term time domain stability curve: RMS of averaged relative frequency fluctuations, for specific averaging times. [12].
3.3. Noise and stabilities in the time and frequency domains
3.3.1. Noise in time domain
Let us consider the sinusoidal voltage delivered by a real oscillator [31]μ
(1.40) whereμ
is the nominal peak voltage amplitude,
is the phase noise (around nominal phase ).
For ultra-stable systems, low noise conditions are considered and the amplitude noise is always neglected (| | and | | ). To study the phase noise of an oscillator, two random quantities are usedμ
1) Phase timeμ where (phase noise) and (jitter) are instantaneous 2) Fractional frequency fluctuationμ ∆
Then is averaged over successive time intervals starting at regularly spaced instants (Fig.1.27).
(1.41)
Fig.1.27: Samples divided into time steps by an interval τ to get the average value of y(t) [32].
The definition of the true variance is given byμ
(1.42) Thus, the estimation of the true variance for samples, is given byμ
, ∑ ∑ (1.43)
3.3.2. Noise in frequency domain
For a stationary process, the IEEE norm [31] states that “The measure of frequency instability is the (one-sided) spectral density of normalized frequency fluctuations, , given byμ
(1.46) - is the measured root mean squared (rms) value of normalized frequency
fluctuations in a band of Fourier frequencies containing frequency - is the width of this frequency band in Hz
For sufficiently narrow Fourier frequency bands (such that is approximately constant over the bandwidth), we haveμ
lim→ // | | ≡ ∑ ∑ (1.47)
Similarly, for the amplitude and phase one-sided spectral densities, we haveμ
and (1.48)
However, manufacturers prefer the quantity L(f) (dBc/Hz) instead of . L(f) (pronounced “ell
of f”) is the ratio of the power in one sideband due to phase modulation (PM) by noise (for a 1 Hz
bandwidth) to the total signal power (carrier plus sidebands). L(f) can be defined asμ
L(f) (1.4λ)
In decibels, L(f) = 3 dB
Due to Fourier transform properties, the power spectral densities and are given byμ
(1.50)
(1.51) Experimental practice shows that, besides long-term frequency drifts, the frequency of a high-quality frequency source can be perturbed by a superposition of independent noise processes, which can be adequately represented by random fluctuations having the following one-sided power spectral density of phase fluctuationsμ
∑ (1.52)
This power law model can be applied to and . The five common power-law noise processes in precision oscillators areμ
(1.54) (Random-walk FM) (Flicker FM) (White FM) (Flicker PM) (White PM) with FM =Frequency Modulation and PM = phase modulation.
3.3.3. Relationship between time and frequency stabilities
When one of the five common power-law noise processes, is a good approximation, the corresponding Allan variance can be calculated by [31]μ
(1.55)
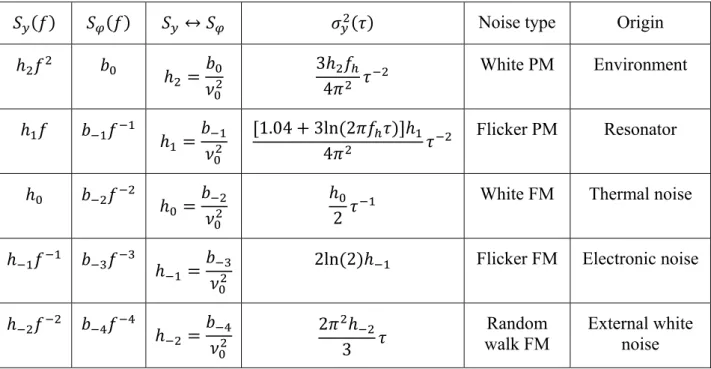
Table 1.8 presents the correspondence between noise types, PSD and Allan variance.
Table 1.8: Correspondence between noise types, power spectral densities and Allan variance (fh is
the high cut-off frequency) [31].
↔ Noise type Origin
White PM Environment
. ln Flicker PM Resonator
White FM Thermal noise ln Flicker FM Electronic noise
Random
walk FM External white noise
![Fig. 1.3: The forces on the faces of a cube located inside a stressed body [4].](https://thumb-eu.123doks.com/thumbv2/123doknet/14719755.750924/22.892.186.720.205.621/fig-forces-faces-cube-located-inside-stressed-body.webp)
![Fig. 1.6: Left-Handed and Right-handed quartz [2].](https://thumb-eu.123doks.com/thumbv2/123doknet/14719755.750924/29.892.230.661.368.715/fig-left-handed-and-right-handed-quartz.webp)

![Fig. 1.12: Schematic representation of various cuts in the quartz crystal [12].](https://thumb-eu.123doks.com/thumbv2/123doknet/14719755.750924/35.892.337.552.84.513/fig-schematic-representation-various-cuts-quartz-crystal.webp)


![Table 3.2: Resonator parameters from [35] and [36] used to draw Fig.3.4. Q factor of resonators from [36] have been found more precisely in [37]](https://thumb-eu.123doks.com/thumbv2/123doknet/14719755.750924/95.892.99.800.694.986/table-resonator-parameters-used-draw-factor-resonators-precisely.webp)
