Ministry of Higher Education & Scientific Research
Djillali LIABES University of Sidi-Bel-Abbes
Faculty of Natural and Life Sciences
Department of Biology
Thesis
Submitted for the degree of
Doctorate in Sciences
Biological Sciences
Option: Food and Human Nutrition
Presentedby:
Mustapha DIAF
Discussed on:
Board of Examiners
Mr. BENALI Mohamed Professor; Djillali LIABES University of Sidi-Bel-Abbes; Chairman Mr. KHALED Méghit Boumediene Professor; Djillali LIABES University of Sidi-Bel-Abbes; Supervisor Ms. MERZOUK Hafida Professor; Abou Bekr Belkaid University of Tlemcen; Examiner Ms. ZAHZEH Touria Professor; Djillali LIABES University of Sidi-Bel-Abbes; Examiner
Postprandial glucose and lipids metabolism state among
obese patients with type 2 diabetes
To
My Family
My Teachers
Foreword
his PhD thesis is interested in studying the postprandial versus fasting states as controversial issues in obese patients with type 2 diabetes, comparing to two control groups, in the north-western region of Algeria. The study is based on research work focusing on anthropometric, nutritional and biochemical parameters. The manuscript is structured as follows:
-The first section describes theoretical considerations about obesity (Chapter 1), type 2 diabetes (Chapter 2) and the metabolism of the postprandial states (Chapter 3); - The second part, covers the study design and the performed protocol according to
the preliminary hypothesis and objectives of the study (Chapter 4); - The third section concerns the results of the study (Chapter 5);
- And the conclusion which draws recommendations that might help researchers and health care professionals to manage correctly the postprandial state among people with type 2 diabetes.
The wording of this manuscript follows the latest version of ISO-690 (International Organization for Standardization) standard for bibliographic referencing in documents preparation, content, form and structure, published in 2010.
The research work in connection with this thesis has involved a great number of people, whom I am indebted to and I wish to thank them all for their help and support.
First and foremost, I am grateful to all the study patients for their willingness to participate in the study. Without them the study would never have been made.
him a lot, especially for devoting his precious time to meeting me and discussing my work.
I greatly thank Pr. Mohamed BENALI who has agreed to chair the board of examiners, to Pr. Hafida MERZOUK, Pr. Touria ZAHZEH, Pr. Rabah DJAZIRI and Pr. Nassima MOKHTARI, members of the examiners board, who have accepted to read and to examine this thesis.
I would like to acknowledge the contribution of the staff of the Diabetes Centre (Ex Gambetta), Mostefa Ben Brahim polyclinic (Sidi-bel-Abbes) and Meslem Tayeb Hospital (Mascara) for co-operation and assistance with assessment of clinical measurements. I appreciate the help I have received from Dr. TABTAB, Mr. HOUARI HH and Mr. BAHOU M who kindly participate in the motivation of participants.
I thank sincerely the financial support provided by the Research Laboratory of “Biotoxicology” and by the private Analytical Laboratory of Dr. ALLAL.
Abstract
Background: The magnitude of issues related to healthcare among type 2 diabetes patients is the result of the disease itself and also its association with several risk factors for cardiovascular diseases such as overweight, obesity and dyslipidemia. The overall goal of health behaviour and therapy interventions in people with diabetes who are overweight or obese is based on metabolic risk assessments that are measured by referring to fasting recommendations. However, it has been recently shown that postprandial metabolic responses are implicated as clinical signs and early markers of risk factors in a number of major diseases.
Objectives: The aim of the present study was to evaluate, during both fasting and postprandial state, glucose and plasma lipid parameters in obese patients with type 2 diabetes in order to show the main role of these parameters in health events prediction and to identify whether these responses are associated with each other. Two other groups are assessed as control; non-diabetic obese individuals and non-obese ones with type 2 diabetes.
Patients and Methods: Our study took place in two cities located in the North-Western region of Algeria (Sidi-Bel-Abbes and Mascara). During 33 months (November 2011 to July 2014), a total of 285 patients (105 males and 180 females), aged 55.41±12.77 years and distributed in three groups; diabetic overweight/obese patients (n=167), overweight/obese non-diabetic individuals (n=47) and normal weight patients with type 2 diabetes (n=71), were studied. Weight, height, waist circumference and body mass index were measured. Fasting and postprandial glucose, glycated haemoglobin (HbA1c) and lipid (total cholesterol “TC”, HDL-cholesterol “HDL-c”, LDL-cholesterol “LDL-c”, triglycerides “TG” and apolipoproteins “apo A-I and apo B”) serum profiles were evaluated. For data collection, we used a structured questionnaire to get necessary information about patient identification, general habits and diabetes and/or obesity-related information, furthermore, each patient completed a ‘three-day food diary’ administered at the screening. The diaries were analysed using the software program NutriSurvey.
compared to normal weight patients with type 2 diabetes, and this during both fasting (p=0.765, p=0.053, p=0.104) and postprandial state (p=0.266, p=0.974, p=0.064) respectively. However, a significant difference was observed for apo A-I level (p=0.027) between these two groups. On the contrary, LDL-c and TG showed higher significant levels during fasting (p=0.003, p=0.001) and postprandial state (p<0.001, p=0.001) respectively in overweight/obese non diabetic patients comparing to overweigh/obese diabetic ones. Lipid ratios comparison, during both fasting and postprandial states, indicated high significant differences of TC/HDL-c, LDL-c/HDL-c and TG/HDL-c ratios between the three groups of patients and between the two groups of overweight/obese patients. Nevertheless, no significant differences were noticed neither between the three groups (p=0.175) nor between each two groups as possible pairwise combinations when comparing apoB/apo A-I ratio. The apo B/apo A-I ratio provided best growing accurate trends when the postprandial TC/HDL-c (p<0.001, r2=0.298, F=120.352) and LDL-c/HDL-c (p<0.001, r2=0.234, F=86.632) ratios increase. On the other hand, dietary findings indicated a high daily total energy intake (2212.89±233.64 kcal) and lipid consumption (350.44±111.07 kcal), especially saturated ones; Myristic acid (p=0.019), Palmitic acid (p=0.001) and Stearic acid (p=0.001) in overweight/obese diabetic patients comparing to the two other groups. However, low dietary fibres intakes were recorded in all patients of both genders. Contrariwise, no distinctive deficiencies in dietary proteins and their amino acids constituents were noticed. Low dietary intake of vitamins D and B9 and some minerals (calcium, magnesium and iodine) were recorded in all patients of both genders.
Conclusion: Management of chronic diseases such as obesity and diabetes are very important concepts, especially if these two health complications are associated with each other. Avoiding abnormalities in postprandial metabolic responses require a good mastering of body weight, nutritional parameters and pathological conditions, considering the physiological differences between males and females.
Résumé
Contexte: L'ampleur des problèmes liés à la santé des patients atteints de diabète du type 2 est le résultat de la maladie elle-même et aussi son association avec les facteurs de risque de maladies cardio-vasculaires comme le surpoids, l'obésité et la dyslipidémie. L'objectif majeur des interventions comportementales et thérapeutiques chez les personnes diabétiques qui sont en surpoids ou obèses est basé sur les évaluations des facteurs de risque métabolique mesurés selon les recommandations en phase de jeûne. Cependant, il a été récemment montré que les réponses métaboliques postprandiales sont impliquées comme signes cliniques et marqueurs précoces de facteurs de risque dans un certain nombre de maladies graves.
Objectifs: L'objectif de la présente étude était d'évaluer, à la fois pendant la phase de jeûne et l’état postprandial, la glycémie et les paramètres lipidiques plasmatiques chez les patients obèses atteints de diabète du type 2 afin de montrer d’une part, le rôle principal de ces paramètres dans la prédiction des événements liés à la santé et pour déterminer d’autre part, si ces réponses sont associées entre eux. Deux autres groupes ont été étudiés en tant que témoins; les sujets obèses non diabétiques et les non obèses atteints de diabète du type 2. Patients et Méthodes: Notre étude a eu lieu dans deux villes situées dans la région du Nord-Ouest d’Algérie (Sidi-Bel-Abbès et Mascara). Durant 33 mois (de novembre 2011 à juillet 2014), 285 patients (105 hommes et 180 femmes), âgés de 55.41±12.77 ans et répartis sur trois groupes; patients diabétiques du type 2 en surpoids/obèses (n=167), les sujets non diabétiques en surpoids/obèses (n=47) et les patients diabétiques du type 2 normaux pondéraux (n=71), ont été enquêtés. Le poids, la taille, le tour de taille et l'indice de masse corporelle ont été mesurés. La glycémie à jeun et postprandiale, l'hémoglobine glyquée (HbA1c) et les lipides plasmatiques (cholestérol total "CT", HDL-cholestérol "HDL-c", LDL-cholestérol "LDL-c", triglycérides "TG" et apolipoprotéines "apo AI et apo B») ont été évalués. Pour le recueil des données, nous avons utilisé un questionnaire structuré afin d’obtenir les informations nécessaires concernant l’identification des patients, leurs habitudes générales et les renseignements sur le diabète et/ou l'obésité, en outre, chaque patient a complété un «carnet alimentaire de trois jours » qui a été administré au moment de l’étude. Les carnets alimentaires ont été analysés par le biais du logiciel Nutrisurvey.
indiqué des niveaux significativement élevés de glucose et d’HbA1c (p<0.001) chez les patients diabétiques par rapport aux non diabétiques. L’évaluation du profil lipidique a révélé des taux élevés mais non significatifs de CT, LDL-c et TG chez les patients diabétiques en surpoids/obèses par rapport aux patients diabétiques normaux pondéraux, à la fois pendant la phase de jeûne (p=0.765, p=0.053, p=0.104) et la phase postprandiale (p=0.266, p=0.974, p=0.064), respectivement. Cependant, une différence significative a été notée concernant l’apo A-I (p=0.027) entre ces deux groupes. Les taux des LDL-c et TG ont montré des niveaux significativement élevés pendant le jeûne (p=0.003, p=0.001) et l'état postprandial (p<0.001, p=0.001), respectivement chez les patients en surpoids/obèses non diabétiques par rapport aux patients en surpoids/obèses diabétiques. La comparaison des ratios lipidiques, pendant la phase de jeûne et l’état postprandial, a révélé des différences significatives de CT/HDL-c, LDL-c/HDL-c et TG/HDL-c entre les trois groupes de patients et aussi entre les deux groupes des sujets en surpoids et/ou obèses. Néanmoins, aucune différence significative n'a été remarquée ni entre les trois groupes (p=0,175), ni entre chacun des deux groupes sur la base du rapport apo B/apo AI. Le rapport apo B/apo AI fournit des tendances croissantes plus précises lorsque les ratios CT/HDL-c (p<0,001, r2=0.298, F=120.352) et LDL-c/HDL-c (p<0.001, r2=0.234, F=86.632) postprandiaux augmentent. D'autre part, l’analyse des carnets alimentaires a indiqué des apports énergétiques (2212.89±233.64 kcal) et lipidiques (350.44±111.07 kcal) élevés, plus particulièrement en acides gras saturés; l'acide myristique (p=0.019), l'acide palmitique (p=0.001) et l'acide stéarique (p=0.001) chez les patients diabétiques obèses ou en surpoids par rapport aux deux autres groupes. Cependant, de faibles apports en fibres alimentaires ont été enregistrés chez tous les patients des deux sexes. En revanche, aucune déficience distinctive dans l’apport en protéines alimentaires et leurs acides aminés constituants n’a été remarquée. De faible apport alimentaire en vitamine D et B9 et en certains minéraux (calcium, magnésium et iode) ont été enregistrés chez tous les patients, les deux sexes confondus.
Conclusion: La prise en charge des maladies chroniques comme l'obésité et le diabète est un concept très important, surtout si ces deux complications sont associées l’une à l'autre. La maîtrise des anomalies des réponses métaboliques postprandiales nécessite une bonne gestion du poids corporel, des paramètres nutritionnels et des conditions pathologiques, tout en tenant compte des différences physiologiques entre les hommes et les femmes.
صّخلم
يفلخ
:
ل
ل ونلإل مل سلإلءإ ل مل ونا يل يذإلى مإل ح بل ل تمإل ا مإلمجل إ
2ل
لهسفنل
للل جيتنلي
للإ ل ولإل ا ل مل يومدإل يع لإ لبل لإل إ ملل إل مإوعلعملهطابت الا يأ
نإ ب
ل
ل وهدإل ب سنل اتعإل
ل ا ل مل ونا يل يذإل
سلإلى مل دل يجا لإ ل يكولسلإل اخ تلإل ملييئ لإل هلإل تسيل. دإلي
للإل أل ولإ
نإ ب
ل
ل ن لإليلنبتل،ك لعم ل. اي لإل رفل ايصوتلبسحل ا تليلإل ي يلإل إل مإوعلمي تل ع
يل ي يلإل ااجت سال أل رخلإ
ل عليل
إل مإو لل كمل اا ل ي ييل اماعل لّثل لإل بلامل رفل
. ي ت سمإل إ ملإل م
ل
إ هلإ
:ل
هلإ
م
ه
سإ دإ
ا
ءانثأل،مي ت
اي لإلرف
بلاملةح مل
سلإل ب سن،ءإوسل حل عل لإ
ب سن
يل وهدإ
دإ
د
ى مإ
يذإ
ونا ي
م
ل ا
م ل نإ بلإل أل ولإ
سلإ
م
ل ونلإ
2
ل
لإ ه ل،
دإل اهظ إل جأل م
ييئ لإ
هل
ريا مإ
ي
عقوت
ي حل ينال يحال مل ل يح لإل افعا مإ
هل ابت إل م
ااجت سا
عم
اه ب
ثل. بلإ
ل
سإ دإ
ل
نتعومل ع
ل
ني خأ
ل
: ها ك
ل
ى مإ
ل
نبا ملرغلإلءا بلإ
ل
سلا
ل
ل
ءا بلرغلإلى مإ
ل
مل وبا مإ
ل
سلإ
لم
ل
ل ونلإ
2
ل.
ل
ى مإ
لل
يجهمإ
ل:
ل
سإ دإل ي جأ
ل
ي
ل
ا تلنتني م
ل
ي
ل
نمإ
ل
يلا لإ
ل
يب غلإ
لم
ل
ي س(ل ئإز إ
ل
اب لب
ل
ل
ل اخل) س م
33
ل
لرمونل م(لإ هش
2011
ل
لويلويل ياغلىإ
2014
ل سإ دإل لمل.)
285
ل
(لا ي م
105
ل
اج لإ
ل
ل
180
ل
لبتل)ءاسنلإ
ل
لم اعأ
55.41
ل±
12.77
ل
،اماع
علنع وم
ل
اث
ل
: اعوم
ل
ى م
ل
سلإ
لم
ل
ل ونلإ
2
ل
ل يذإ
ونا ي
لم
ل
ا
ل
= (ل نإ بلإ/ ولإ
167
= (ل سلالنبا ملرغلإلءا بلإ/ ئإزلإل ولإل ل ا شلإ،)
47
،)
ل
ى مإ
ل
ملنبا مإ
ل
سلإ
لم
ل
ل ونلإ
2ل
ولإل
ل
= (لي يب لإ
71
مل.)
ل
ايق
ل
ل ولإ
ل
ما لإ
ل
ل
يح
ل
ر إ
ل
رؤمل
ل
ةتك
ل
سلإل ب سنل ايق،ل لإل بلاملةح مل ل اي لإل رفل اخلمل.مس إ
ل
نبولجومهلإل ب سن، دإلي
ل
(ل
سلإ
HbA1c
، رسيلو لإ(ل وهدإل ب سن ل)
نت رلإل ب سن
ل
فخنمإليهدإ
ل
"ل فا لإ
LDL-c
ل ب سن،"
نت رلإ
ل
ليهدإ
ا لإ
ل
ل فا لإ
"HDL-c"
ل ب سنل ل يثاّلإل وهدإل ب سنل،
apolipoproteins
ل
Apo A1"
ل
ل
Apo B
، اايبلإلعمل ا ت سإل جأل مل.)"
ل
ا م ت سإ
ل
ايبت سإ
ل
و حلل
لع
ل
امول مإ
ل
م الإ
ل
أ ب
ل
ي ح
ل
يوه
ل
،ى مإ
ل
مهإ اع
ل
ل
امول م
ل
ماع
لع
لم
سلإ
ل
أ/
ل
نإ بلإ
ل
ل
فاض اا
ل
ى إ
ل
ك
ل،
ل
ل لمأ
ل
للمل ي م
ثاثل ل مل يئإ غل ايموي"
ل
يلإل" اأ
مل. سإ دإل رفلءانثألاه ي وتللم
ل
يلح
ل
ايمويلإ
ل
يئإ غلإ
ل
إ ت سأب
ل
ما ب
Nutrisurvey
لل
.ل
رغلإ
ل
نبا مإ
ل
ل . سلا
يلاح
ل
وهدإ
ل
ف ك
ل
فت مل بسن
لل
ل
اا ل إ ل رغ
ل
ل لخل افل يئا حإ
،ل رسيلو لإ
LDL-c
ل
ل
دل يثاّلإل وهدإ
ل
ى م
ل
سلإ
ل
ونا يل يذإ
لم
ل
ا
ل
نإ بلإل/ ولإ
ل
ن ا م
ل
لعم
ى م
ل
ل سلإ
ل
ولإ
ل
،ي يب لإ
ل
ءإوسلإ هل
ل
اخ
ل
ةح م
ل
(ل اي لإ
p
=0.104
،
p
=0.053
ل
ل
p
=0.104
ل أل)
ةح م
ل
بلام
ل
(ل لإ
p
=0.266
،
p
=0.974
ل،
p
=0.064
ع،ل)
ل
عم ل. إوتلإ
ل
،ك
ل
حول
ل
وج
ل
اتخإ
ل
ليلربك
ب سن
Apo A1
ل(
p
=0.027
نبل)
ل
مل يلاعل اوت سمل لجل با مال.نتعو جإ
ل
LDL-c
ءانثأل يثاّلإل وهدإل
ل
(ل اي لإ
p
=0.003
،
p
=0.001
بلاملةح م ل)
ل
(ل لإ
p
<0.001
،
p
=0.001
عل)
ل
دلإ هل ل، إوتلإ
ل
لى مإ
لإلءا بلإ
سلالنبا ملرغ
ل
ن ا م
ل
عم
ل
ن ا مل. سلالنبا مإلءا بلإ
ل
بسن
ل
، وهدإ
ل
ءانثأ
ل
اي لإ
ل
بلةح م
ل
عل ف ك، لإ
لف
ل
إ
ل
يئا ح إل اا
ل
لخلاف
ل
/ رسيلو لإ
HDL-c
،
HDL-C / LDL-c
ل وهدإ
/ يثاّلإ
HDL-c
ل
د
ل
ى مإل اعوم
ل
ل
ا يأ
ل
د
ل
نتعو جإ
ل
نبا مإل م
ل
ل. نإ بلإل ل ولإل ازب
مع
ل
،ك
لا
ل
جوت
لف
ل
إ
ل
ةا
ل
يئا ح إ
ل
ءإوس
ل
نب
ل
اعو جإ
ل
(ل اّلإ
p
=0.175
أ،ل)
نب
ل
لم
ل
ل يبسل علنتعو جإ
ل خلافل ن ا مإ
Apo A1/Apo B
لاكل.
أ
ل
ب سن
لل
Apo A1/Apo B
م ق
ل
ق
ل
ركأ
ل
نع
ل
ا
ل
لبسن
/ رسيلو لإ
c
-HDL
ل
<0.001)
p
ل،
=0.298
2r
،
F=120.352
)
c
-c/LDL
-HDL
<0.001)
p
ل،
=0.234
2r
ل،
F=86.632
امل رفلءانثأل)
لب
ل
اعل. لإ
لع
ل
،ك
اف
ل
يلح
ل
ايمويلإ
ل
يئإ غلإ
ل
قا لإل يمليل افت إل هظأ
ل
له سمإ
ل(
2212.89
±
233.64
ل
وليك
(ل وهدإل يم ل) ي ح
350.44
±
111.07
ل
وليك
) ي ح
ل
ل احلإلاصو خ،
ل ينهدإ
: ب مإ
ل
م
ل
(ل يتسيرمإ
p
=0.019
،)
ل
م
لللإ
يل ن
ل(
p
=0.001
م ل)
لللإ
ي
ل(
p
=0.001
دل)
ل
ى م
ل
سلإ
ل
ونا يل يذإ
لم
ل
نإ بلإ
لأ
ل
ا
ل
ولإ
ل
ن ا م
ل
عم
ل
نتعو جإ
ل
ملهنإلاكل.ني خلإ
ل
يجست
ل
افخإ
ل
ب سنلي
ل
ايللإ
ل
يئإ غلإ
ل
د
ل
عيم
ل
ى مإ
لم
ل
ا
ل
عم ل.نسن إ
ل
،ك
لم
ل
حاي
لأ
لن
ل
حإ
ل
ي
ل
نت رلإ
ل
احلإ
ل
ينيملإ
ل
نو مإ
ل
ا يألمل.اهل
ل
يجست
ل
افخإ
ل
ب سنلإ
ل
يئإ غلإ
لم
ل
نماتيف
ل
ل
ل
ل9
لب
ل
ل ا مإ
، وي سلالإ(
ل
وي سينغمإ
ل
ل
دل) ويلإ
ل
عيم
ل
.نسن إلال م،ى مإ
ل
صا إ
:ل إ
ل
يلمحتلإ
ل
إ ملإ
ل
مزمإ
ل
نإ بلا
ل
م
ل
سلإ
ل
وه
ل
وهفم
ل
مه
ل
،إ ج
ل
اصو خ
ل
إ إ
ل
هل بت إ
ل
افعا مإ
ل
عم
ل
اه ب
ل
ل. بلإ
ل
ي سلإ
لع
ل
ااجت سا
ل
رغلإل ي يلإ
ل
ي يب لإ
ل
لاملةح ملي
ب
ل
لإ
ل
بل تي
ل
، ولإليلإ يجلا ح
ل
ال مإ
ل
يئإ غلإ
ل
ل
اا إ
ل
، يض مإ
ل
عم
ل
خلإ
ل
ن ب
ل
ابتعا
ل
افاتخا
ل
يجولوي سفلإ
ل
نب
ل
ل وكذإ
. اال
ال
ل
هيحاتفم
:
ل
ةح م
لب
ل
لإ
نإ بلإل،
لمل،
ل
سلإ
لم
ل
ل ونلإ
2
،ل
، دإليل سلإ
ل
. وهدإ
ل
Table of Contents
Page
Foreword……….………... I Abstract………... III Résumé………... V صخلم………. VII Table of Contents………. IXList of Tables………. XIV
List of Figures……… XVI
List of Abbreviations……… XVII
Part One: Theoretical Considerations
Introduction……….………. 01 Chapter 1 Obesity 03 1.1Definition of obesity………..………... 04 1.2Prevalence of obesity……….………... 04 1.3 Aetiology of obesity……….……….. 06 1.3.1 Nutritional causes……… 06
1.3.2Physiological basis of obesity……… 07
1.3.3Nutrition transition………... 10
1.4Evolution of Adipose Tissue and Obesity………... 11
1.4.1Adipose tissue……… 11
1.4.2Obesity, adipocyte hyperplasia and hypertrophy………... 11
1.4.2.1Origin of adipocyte hyperplasia……… 12
1.4.2.2Origin of adipocyte hypertrophy……….. 12
1.4.3Obesity and adipose tissue distribution……….. 13
1.4.3.1Subcutaneous and visceral adipose tissue……….. 13
1.4.3.2Adipose tissue and insulin resistance………. 14
1.4.3.3Adipose tissue, free fatty acids lipolysis and glycerol release……….. 14
1.4.3.4Adipose tissue and glucose uptake………... 15
1.4.4Triglycerides synthesis………... 15
1.4.5Different origins of fatty acids……… 16
1.4.5.1Lipolysis……… 16
1.4.5.2Metabolism of brown adipose tissue………. 17
1.5 Health Consequences of Overweight and Obesity………. 17
1.5.4Type 2 diabetes………. 19
1.5.5Endocrine and metabolic disturbances……….. 20
1.5.6Cardiovascular diseases……….. 21
1.5.7Cancers………. 22
1.5.8Other health consequences of obesity……… 23
1.6 Treatments of Obesity………... 23
1.6.1Diet and physical activity……….. 23
1.6.2Pharmacological treatment……… 24
1.6.3Surgical procedures……… 25
Chapter 2 Type 2 Diabetes 26 2.1 Definition of Type 2 Diabetes………... 27
2.2 Diagnosis of Diabetes………. 28
2.3 Epidemiology of Type 2 Diabetes……… 28
2.3.1Aetiology and pathophysiology………. 28
2.3.2Genetic factors………... 29
2.3.3Environmental factors……… 30
2.3.4Abnormalities in insulin secretion………. 30
2.3.5Insulin resistance in type 2 diabetes……… 32
2.3.6Obesity……….. 33
2.3.7Evaluation parameters of glycemic control……… 34
2.4Complications of Type 2 Diabetes………... 34
2.4.1Acute complications of type 2 diabetes……….. 34
2.4.1.1Hypoglycemia……….. 34
2.4.1.2Diabetic ketoacidosis………... 34
2.4.1.3Hyperosmolar non-ketoacidotic coma………. 35
2.4.2Chronic complications of type 2 diabetes………. 35
2.4.2.1Micro vascular complications……… 35
2.4.2.2Macro vascular complications……….. 38
2.4.3Hypertension………... 40
2.4.4Metabolic complications of diabetes……….. 41
2.4.4.1Diabetic dyslipidemia……… 41
2.4.4.2Hypoglycaemia………. 44
2.4.4.3Lactic acidosis……… 44
2.4.5Mortality due to diabetes………... 45
2.5Treatment Goals for Patients with Type 2 Diabetes………... 46
2.5.1Food intake and life style conditions……….. 46
2.5.2Exercise………. 47
Chapter 3 Metabolism of Postprandial States 56
3.1General Information about Food Intake Control………... 57
3.1.1Food intake……… 57
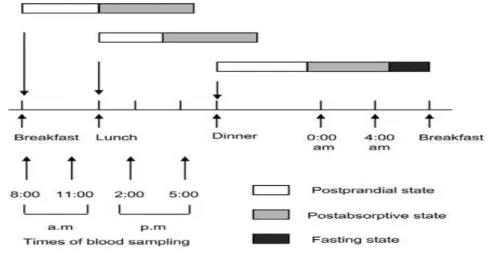
3.1.2Different periods after food intake………. 58
3.1.2.1Postprandial state……….. 58
3.1.2.2Postabsorptive state……….. 58
3.1.2.3Fasting state……….. 59
3.1.3Regulation of foodintake……….. 60
3.1.3.1Central nervous system factors……….. 60
3.1.3.2Circulatingfactors……….. 61
3.1.3.3Signalsfrom the periphery………. 62
3.1.3.4Externalfactors……….. 63
3.2Metabolism of Postprandial Glycemia………. 63
3.2.1Physiologie of postprandial glycemia……… 63
3.2.1.1Definition of postprandial glucose……… 63
3.2.1.2Factorsinfluencing postprandial hyperglycemia……… 65
3.2.2Pathophysiology of postprandial hyperglycemia……… 69
3.2.2.1Early decrease in insulin secretion………. 69
3.2.2.2Increasedinsulinresistance……….. …. 70 3.2.2.3Postprandial hyperglycemia, microvascular and macrovascular complications of diabetes……….. 70
3.2.3Treatments of postprandial hyperglycemia……… 73
3.2.3.1Diet and food composition……….. 73
3.2.3.2Pharmaceutical agents……….. 75
3.3Metabolism of Postprandial Lipemia……….. 76
3.3.1Factors influencing the postprandial lipid response……… 76
3.3.1.1Diet……….. 76
3.3.1.2Age……….. 77
3.3.1.3Lifestyle conditions……….. 78
3.3.1.4Gender………. 79
3.3.1.5Genetic and postprandial lipemia………. 80
3.3.2Measurement of postprandial lipids……….. 81
3.3.2.1Postprandial lipoproteins……….. 81
3.3.3.3Postprandial hyperlipidemia during insulin resistance and type 2diabetes 85
3.3.4Treatment of postprandial lipemia………. 86
3.3.4.1Diet and life style changes………. 86
3.3.4.2Pharmacotherapy……….. 87
3.4Relationship between Lipids and Glucose Metabolism……….. 88
3.4.1Physiological effects of fatty acids on insulin secretion………... 88
3.4.2Inhibition of pancreatic beta cells function by fatty acids………... 90
Part Two: Experimental Research Chapter 4 Patients and methods 4.1 Objective of the Study……….... 92
4.2 Study Design……… 92 4.2.1Study location……… 92 4.2.2Study duration………... 92 4.3Patients………. 93 4.3.1Recruitment of Subjects……… 94 4.4AnthropometricMeasurements………. 94
4.5 Blood Pressure Measurement……… 95
4.6 Blood Sampling and Assay Methods……… 95
4.6.1Assessment of carbohydrate metabolism……… 96
4.6.1.1Glucose……… 96
4.6.1.2HbA1c levels……… 96
4.6.2Exploration of lipid metabolism……… 96
4.6.2.1Total Cholesterol (TC)……… 96
4.6.2.2High-density lipoprotein cholesterol (HDL-c)……… 96
4.6.2.3Low-density lipoprotein cholesterol (LDL-c)……….. 97
4.6.2.4Triglycerides (TG)……… 97
4.6.2.5Apolipoproteins A-I (apo A-I)………. 97
4.6.2.6Apolipoproteins B (apo B)……… 97
4.7Questionnaires Distribution………... 98
4.7.1Personal data……….. 98
4.7.2Socioeconomic data……….. 98
4.7.3Lifestyle information……….. 98
4.7.4Food and hygiene behaviour………. 98
4.7.5Questions about RAMADAN fasting………... 98
4.8Checking Patient Records……….. 99
4.9 Food IntakeAssessment……….. 99
4.10 StatisticalAnalysis………... 100
4.10.5Correlation……….. 101
4.10.6Linear regression……….. 102
4.10.7Analysis of variance………. 102
4.10.8Non-parametric tests……….. 102
4.11Calculation of Food Rations………. 103
Chapter 5 Results 5.1 Anthropometric Assessments………... 106
5.2 Clinical Assessment………. 109
5.3 Analysis of Questionnaires Results………... 111
5.3.1Socio-professional data……….. 111
5.3.1.1Marital status………. 111
5.3.1.2Educational level……….. 112
5.3.1.3Occupational status……….. 113
5.3.2Assessment of physical activity and sports……….. 114
5.3.3Assessment of family antecedents………. 115
5.4Analysis of Food Diaries……….. 117
5.4.1Total energy intake……… 117
5.4.2Total energy intake according to daily meals………... 118
5.4.3Assessment of main energy nutrients intake……….. 120
5.4.3.1Assessment of carbohydrates intake……….. 123
5.4.3.2Assessment of fatty acids intake………. 124
5.4.3.3Assessment of essential amino acids intake………... 128
5.4.4Assessment of vitamin intake………. 129
5.4.4.1Fat-Soluble vitamins intake (A, D, E and K)………... 130
5.4.4.2Water-Soluble vitamins intake……… 131
5.4.5Assessment of minerals intake……… 133
5.4.5.1Macroelements……….. 134
5.4.5.2Trace element………... 135
5.5Blood Parameters……….. ……….. 137
5.5.1Assessment of fasting blood parameters………... ………. 137
5.5.2Assessment of postprandial blood parameters………..….………. 138
5.5.3Assessment of non-fasting blood parameters………. 139
5.5.4Comparison of blood parameters between the groups……….. 141
5.6Evaluationof Blood Lipid Ratios……… 142
5.6.1Assessment of fasting lipid ratios……… 142
5.6.2Assessment of postprandial lipid ratios………... 144
5.6.3Assessment of apolipoproteinsratios………... 145
5.6.4Comparison of lipid ratios between the groups………. 146
5.6.5Correlation of apo B/apo A1 ratio with conventional lipid ratios……….. 147
List of Tables
Page
Table 1.1 Metabolic and Cardiovascular Effects of Obesity 22
Table 1.2 Relation of cancer and mortality among overweight men and
women
23
Table 2.1 Definitions of Metabolic Syndrome from Major Organizations 40
Table 2.2 Treatment goals for adults with type 2 diabetes 46
Table 3.1 Summary of Post-prandial Glucose Guidelines 64
Table 5.1 Anthropometric characteristics of the three groups N=285 106
Table 5.2 Comparison between basic characteristics of the three groups 107
Table 5.3 Comparison of blood pressure values between males and female over
patients group
109
Table 5.4 Comparison of blood pressure values between the three groups 110
Table 5.5 Assessment of sport practiced by each patients’ group 114
Table 5.6 Comparison of family history by gender in each patients group 116
Table 5.7 Comparison of total energy intake and energy fulfilment between men and women in each group of patients
117 Table 5.8 Distribution of total energy intake in different daily meals among the
three groups according to patient's gender
118 Table 5.9 Comparison of daily meals contribution in TEI between the three
groups
119 Table 5.10 Distribution of the main energy nutrients by patient's gender in the
three groups
120
Table 5.11 Comparison between main energy nutrients consumed by the three
patients group
122
Table 5.12 Carbohydrates intakes of males and females in the three groups 123
Table 5.13 The daily intake of SFA in men and women in the three groups 124
Table 5.14 The daily intake of MUFA in men and women in the three groups 126
Table 5.15 The daily intake of PUFA in men and women within the three groups
127
Table 5.16 Essential amino acids obtained from the diet in each group 128
Table 5.17 Vitamin status between men and women in the three groups 129
males and females within each group
Table 5.21 Comparisonof non-fasting apolipoproteins and HbA1c between
males and females within each group
139 Table 5.22 Comparison of glucose and lipids levels during fasting, postprandial
and non-fasting states between the three groups of patients
141 Table 5.23 Comparisonof fasting biochemical blood ratios between males and
females within each group
142 Table 5.24 Comparisonof postprandial biochemical blood ratios between males
and females within each group
144 Table 5.25 Comparisonof apolipoproteins ratios between males and females
within each group
145
Table 5.26 Variations of non-fasting apolipoproteins ratio, fasting and
postprandial lipid ratios between the three groups of patients
List of Figures
Page
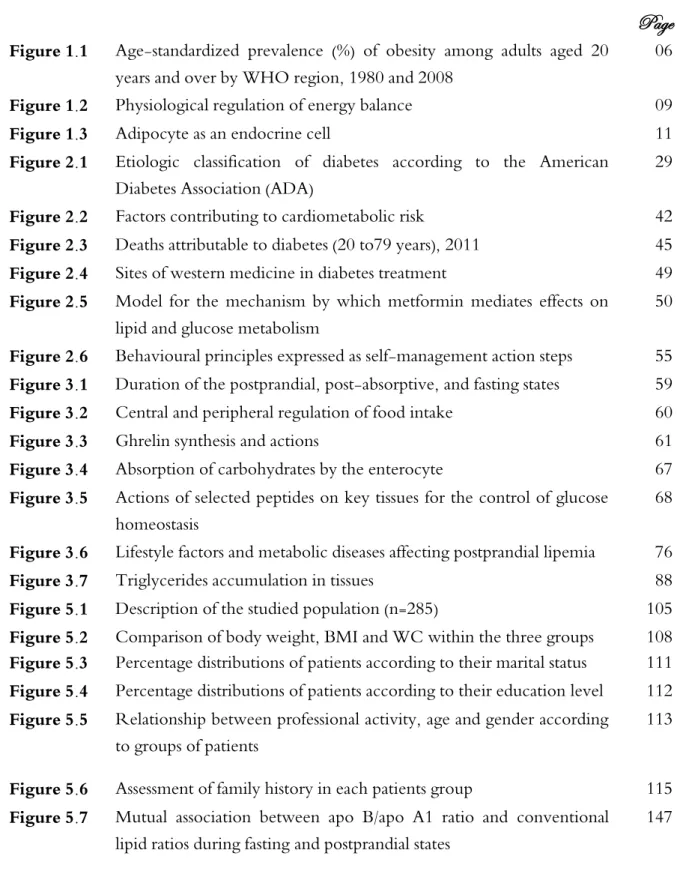
Figure 1.1 Age-standardized prevalence (%) of obesity among adults aged 20years and over by WHO region, 1980 and 2008
06
Figure 1.2 Physiological regulation of energy balance 09
Figure 1.3 Adipocyte as an endocrine cell 11
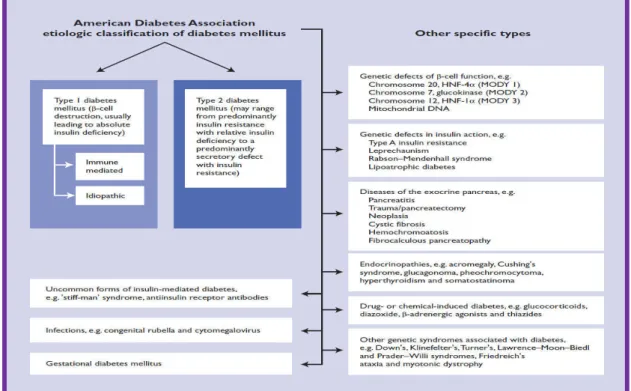
Figure 2.1 Etiologic classification of diabetes according to the American Diabetes Association (ADA)
29
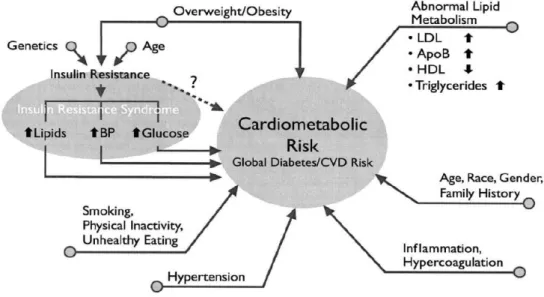
Figure 2.2 Factors contributing to cardiometabolic risk 42
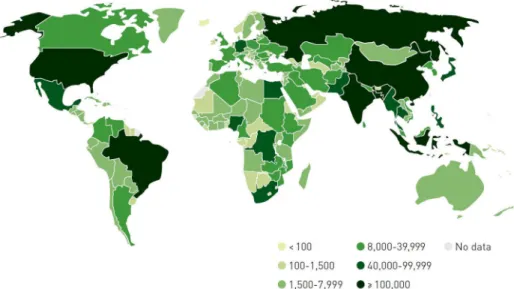
Figure 2.3 Deaths attributable to diabetes (20 to79 years), 2011 45
Figure 2.4 Sites of western medicine in diabetes treatment 49
Figure 2.5 Model for the mechanism by which metformin mediates effects on lipid and glucose metabolism
50
Figure 2.6 Behavioural principles expressed as self-management action steps 55
Figure 3.1 Duration of the postprandial, post-absorptive, and fasting states 59
Figure 3.2 Central and peripheral regulation of food intake 60
Figure 3.3 Ghrelin synthesis and actions 61
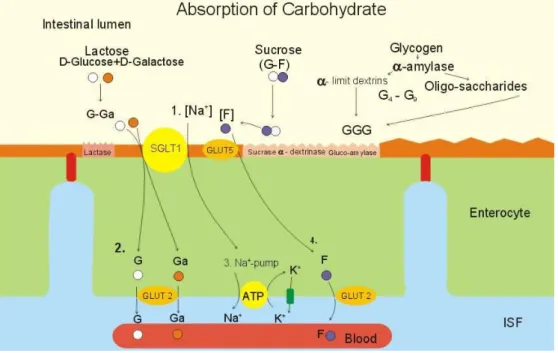
Figure 3.4 Absorption of carbohydrates by the enterocyte 67
Figure 3.5 Actions of selected peptides on key tissues for the control of glucose homeostasis
68
Figure 3.6 Lifestyle factors and metabolic diseases affecting postprandial lipemia 76
Figure 3.7 Triglycerides accumulation in tissues 88
Figure 5.1 Description of the studied population (n=285) 105
Figure 5.2 Comparison of body weight, BMI and WC within the three groups 108
Figure 5.3 Percentage distributions of patients according to their marital status 111
Figure 5.4 Percentage distributions of patients according to their education level 112 Figure 5.5 Relationship between professional activity, age and gender according
to groups of patients
113
Figure 5.6 Assessment of family history in each patients group 115
Figure 5.7 Mutual association between apo B/apo A1 ratio and conventional lipid ratios during fasting and postprandial states
List of Abbreviations
AA arachidonic acid
AACE American Association of Clinical Endocrinologists
acyl CoA acyl co-enzyme A
ADA American Diabetes Association
AFR WHO African Region
AGRP agouti-related protein
AHA/NHBLI American Heart Association/National Heart, Blood, and Lung Institute
AI adequate intake
ALA α-linolenic acid
AMPK adenosine monophosphate-activated protein kinase
AMR WHO Region of the Americas
AP area postrema
apo A-1 apolipoprotein A-1
apo A4 apolipoprotein A-4
apo A5 apolipoprotein A-5
apo B apolipoprotein B
apo B100 apolipoprotein B100
apo B48 apolipoprotein B48
apo C2 apolipoprotein C-2
apo C3 apolipoprotein C-3
ARC arcuate nucleus
ATP adenosine triphosphate
BCAA branched chain amino acids
BMI body mass index
CCK Cholecystokinin
CDA Canadian Diabetes Association
CETP cholesterol ester transfer protein
CHD coronary heart disease
CNS central nervous system
CV cardiovascular
CVD cardiovascular disease
DBP diastolic blood pressure
DBP Diastolic blood pressure
DCCT Diabetes Control and Complications Trial
DGLA dihomo-γ-linolenic acid
DHA docosahexaenoic acid
DHHA Departement for Health and Human Services
DKA diabetic ketoacidosis
DNA deoxyribonucleic acid
DPA docosapentaenoic acid
DSME diabetes self-management education
EAR estimated average requirement
EASD European association for the study of diabetes
EFA essential fatty acid
EMR WHO Eastern Mediterranean Region
ESC European society of cardiology
EUR WHO European Region
F HDL-c Fasting high-density lipoprotein cholesterol
FAO Food and Agriculture Organization
FAs fatty acids
FDA Food and Drug Administration
FFA free fatty acid
GABA γ-aminobutyric acid
GCKR glucokinase regulatory protein
GI glycaemic index
GIP glucose-dependent insulinotropic polypeptide
GLP glucagon-like peptide
HbA1c glycosylated haemoglobin
HCO3 venous bicarbonate
HDL-c high-density lipoprotein cholesterol
HGP hepatic glucose production
HHS hyperosmolar hyperglycemic state
His Histidine
HL hepatic lipase
HMG-CoA 3-hydroxy-3-methylglutaryl-coenzyme A
HTR Hormone replacement therapy
IAPP islet amyloid polypeptide
IDF International Diabetes Federation
IDL intermediate density lipoprotein
IL-6 interleukin-6
ILE Isoleucine
LA Linoleic acid
LDL-c Low-density lipoprotein cholesterol
LpL Lipoprotein lipase
Lys Lysine
Max. Maximum
MCH Melanin-concentrating hormone
MNT Medical Nutrition Therapy
MUFA Monounsaturated fatty acid
NCEP/ATP National Cholesterol Education Program/Adult Treatment Panel
NEFA non-esterified fatty acids
NHANES National Health and Nutrition Examination Survey
NPY Neyropeptide Y
NRC National research council
NTS Nucleus of the solitary tract
OGTT oral glucose tolerance test
OSA Obstructive sleep apnea
OXM Oxyntomodulin
Phe Phenylalanine
POMC Pro-opiomelanocortin
PPAR peroxisome proliferator–activated receptor
PPD postprandialy
PPG Postprandial glucose
PPHDL-c Postprandial high-density lipoprotein cholesterol
PPHG Postprandial hypeglycemia
PPTG Postprandial triglycerides
PUFA Polyunsaturated fatty acid
PVN Paraventricular nucleus
PYY Peptide YY
PYY3-36 Peptide YY3-36
RDA Recommended dietary allowance
RLP-c Remnant-like particle-cholesterol
RNA Ribonucleic acid
SBP Systolic blood pressure
SCAT Subcutaneous adipose tissue
SNS Sympathetic nervous system
T1D Type 1 diabetes
T2D Type 2 diabetes
TC Total cholesterol
TEI Total energy intake
TFRNS Task force to Revise the National Standards
TG Triglycerides
Thr Threonine
TNF-α Tumour necrosis factor α
TRH Thyrotropin-releasing hormone
TRL Triglyceride-rich lipoproteins
Trp Tryptophan
UCP1 Uncoupling protein 1
UKPDS United Kingdom Prospective Diabetes Study
Val Valine
VAT Visceral adipose tissue
VLDL Very low density lipoprotein
Introduction
Obesity prevalence is increasing at an alarming worldwide rate in all age-groups (Emery-Tiburcio et al., 2015). Concurrently, type 2 diabetes (T2D) is continuing to be an increasing public health burden. The worldwide prevalence of diabetes among adults (aged 20-79 years) will increase from 6.4% in 2010 to 7.7% by 2033 (Shaw et al., 2010). The exceeding of body weight associated with glucose intolerance and/or T2D is characterized by hyperinsulinemia, peripheral resistance to the action of insulin, hypertriglyceridemia, decreased high-density lipoprotein cholesterol and other lipid and carbohydrate changes (Weiss et al., 2003; Reaven, 2005). Diabetes and obesity affect functioning, quality of life and are significantly associated with worsening of many health issues especially, those related to cardiovascular events.
Assessment of health risks, including diabetes and obesity, are measured in clinical settings and epidemiological research by referring to fasting recommendations. However, the postprandial state, a period that comprises and follows a meal, is recently receiving increased attention. The postprandial state cumulatively includes approximately half of the nycthemeral period and involves numerous finely regulated motor, secretory, hormonal and metabolic events. It was about thirty-five years ago, when Zilversmit (1979) suggested that postprandial lipemia may have a role in atherogenesis and other cardiovascular problems.
Currently, both T2D and obesity have been associated with exaggerated postprandial lipemia and glycemia. Postprandial lipid and glucose metabolism states have been investigated
Introduction
The regulatory pathways of postprandial metabolism are influenced by several factors including nutritional parameters modulated by dietary pattern and meal composition, life style conditions (physical activity, smoking, and alcohol consumption), physiological status (age, gender, and menopausal status), pathological conditions (diabetes, insulin resistance, and obesity) and genetics which may contribute to inter-individual variability on postprandial responses, and thereby, susceptibility to health complications (Lopez-Miranda & Marin, 2010).
The aim of the present thesis was to show, on the one hand, the main role of measuring biochemical parameters in overweight/obese patients with T2D, during both fasting and postprandial states. On the other hand, this research aimed to evaluate whether these responses are associated with each other while considering all factors influencing these metabolic responses.
The study protocol took place over three years (November 2011 to July 2014), in two cities from the north-western region of Algeria (Sidi-Bel-Abbes and Mascara). The investigation involved two other groups as control; overweight/obese individuals without diabetes and non-obese ones with T2D using a prospective multicenter case-control study.
Chapter 1. Obesity
C
HAPTER
1
O
BESITY
Page
1.1 Definition of Obesity
04
1.2 Prevalence of Obesity
04
1.3 Aetiology of Obesity
06
1.4 Evolution of Adipose Tissue and Obesity
11
1.5 Health Consequences of Overweight and Obesity
17
C
HAPTER
1
O
BESITY
1.1 Definition of Obesity
Overweight and obesity are defined as abnormal or excessive fat accumulation that presents a risk to health. The body mass index (BMI), a person’s weight (in kilograms) divided by the square of his or her height (in meters), is considered as a crude population measure of obesity. For a BMI of 30 kg/m2 or more, a person is generally considered obese. For a BMI equal to or more than 25 kg/m2, a person is considered overweight.
Since the interpretation of body fatness depends on such factors as gender, age, ethnic group, and level of physical activity, measurement of body fat is not easily done in clinical practice. Overweight is considered as a surrogate for “obesity” both clinically and epidemiologically. However, Central adiposity refers to conditions where fat is located more in the abdominal area than on the hips, thighs, or arms (Bray, 2007).
According to the World Health Organization (WHO), overweight and obesity are major risk factors for lots of chronic diseases such as diabetes, cardiovascular diseases and cancer. In a similar way, overweight and obesity are now dramatically on the rise in low, middle and in high income countries, particularly in urban settings (WHO, 2009).
Chapter 1. Obesity
because being overweight or obese can lead to adverse metabolic effects on blood pressure, cholesterol and triglyceride levels, and can result in increases in risks of diabetes, risks of coronary heart disease, ischaemic stroke, and a number of common cancers.
Between 1980 and 2008, the worldwide prevalence of obesity (BMI ≥30 kg/m2) almost doubled (Figure 1.1). By 2008, 10% of men and 14% of women in the world were obese, compared with 5% of men and 8% of women in 1980. As a result, an estimated half a billion men and women over the age of 20 were estimated to be obese in 2008. In all WHO regions, women were more likely to be obese than men (WHO, 2012).
The WHO Region of the Americas are characterized by a highest prevalence of overweight and obesity (62% overweight in both sexes, and 26% obese), contrariwise the WHO South-East Asia Region are characterized by lowest prevalence (14% overweight in both sexes and 3% obese). In the other WHO Regions, over 50% of women were overweight approximately half of these overweight women were obese (WHO, 2012).
Figure 1.1 Age-standardized prevalence (%) of obesity among adults aged 20 years and over by WHO region, 1980 and 2008 (WHO, 2012)
AFR: WHO African Region, AMR: WHO Region of the Americas, SEAR: WHO South-East Asia Region, EUR: WHO
European Region, EMR: WHO Eastern Mediterranean Region, WPR: WHO Western Pacific Region.
1.3 Aetiology of Obesity
The excess of energy consumption (dietary intake) relative to energy expenditure (energy loss via metabolic and physical activity) are the common causes of obesity, but the aetiology of obesity includes genetic, physiologic, environmental, psychological, social, economic, and even political factors that interact in varying degrees to promote the development of obesity and it is highly complex (Aronneet al., 2009).
1.3.1 Nutritional causes
Chapter 1. Obesity
Today’s and according to the fast paced life, for lots of families that are struggling to meet the economic style, the majority of products in grocery stores are non-perishable, highly processed, and pre-packaged foods. These high calorie products are frequently consumed by millions of peoples and are heavily marketed not only to adults but also to children as well (Wright & Aronne, 2012).
1.3.2 Physiological basis of obesity
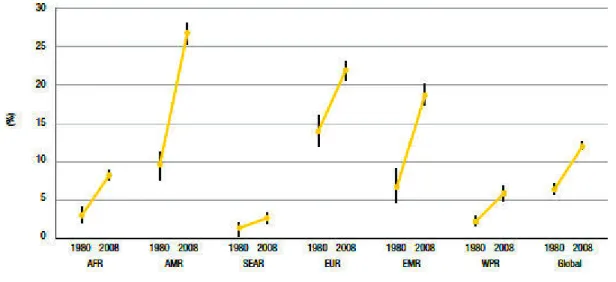
Several peripheral signals and central coordination in the brain are required to help the regulation of the physiological system which can control the perturbations of the balance between food intake and energy expenditure and contribute to obesity. The hypothalamus is a central regulator in this system. This section of the brain receives information about energy balance through neuronal and hormonal signals to several tissue nuclei within it- particularly the ventro-medial, paraventricular and arcuate nuclei- and to the lateral hypothalamic area.
The arcuate nucleus has an essential role in this system; it contains two sets of neurons, one produces agouti-related protein (AGRP) and neuropeptide Y (NPY) and the other produces pro-opiomelanocortin (POMC) and cocaine- and amphetamine-related transcript (CART).
The first type is orexigenic, promoting food intake and reducing energy expenditure, and the second type produces the antagonist anorexigenic effect (Barsh & Schwartz, 2002).
Peripheral endocrine signals exert their effects through this system over both long-and short-term time-frames. Insulin has a role in the central nervous system (CNS) as a signal of the level of adiposity over a moderate- to long-term period and has an anorexigenic effect
and signal of the state of nutrition, as its plasma levels are highly correlated to adipocyte number and fat content. However, leptin is involved in the long-term regulation of adiposity, and other peptides are responsible for the short-term regulation of appetite. One of these, the orexigenic peptide ghrelin, is secreted primarily by the stomach and duodenum, and shows a rise in serum levels before eating and a decrease after eating (Kohnoet al., 2003).
Another mediator, peptide YY3-36 (PYY3-36), is secreted from the distal gastrointestinal tract on ingestion of food, with concentrations peaking within approximately one hour. It binds to presynaptic Y2 receptors in the NPY neurons that have putative inhibitory effects, which might lead to decreased food intake.
Satiety is mediated by the response to other factors, such as gut distension and the release of the peptide cholecystokinin (CCK). The central arcuate nucleus processes these different inputs and exerts its effects by signalling to various downstream effector neurons. These include the orexigenic melanin-concentrating hormone (MCH) neurons and orexin or hypocretin neurons in the lateral hypothalamus, the thyrotrophin-releasing hormone (TRH) neurons that are involved in regulating the hypothalamic-pituitary-thyroid axis (Flier
et al., 2000) and the γ-aminobutyric acid (GABA)-releasing interneurons in the
paraventricular nucleus (PVN), which modulate orexigenic or anorexigenic effector neurons. Further inputs to this system include the dopamine, serotonin and endocannabinoid signalling systems (Figure 1.2).
Chapter 1. Obesity
Figure 1.2 Physiological regulation of energy balance (Bellet al., 2005)
This weight-regulatory system is a powerful protection against weight loss; however, the same cannot be said for weight gain. With increasing adiposity, the consequent rise in leptin has a limited effect on reducing food intake and averting obesity. The anti-obesity role of leptin is limited by cellular resistance to this signal, which might have developed in response to evolutionary pressure to promote fat storage and so protect against starvation. Various mechanisms have been proposed for the occurrence of leptin resistance, including impairment of leptin transport, as well as the presence of negative regulators of leptin and insulin signalling (Moriet al., 2004).
animal models and the investigation of the genetics of rare and common human forms of obesity (Bellet al., 2005).
1.3.3 Nutrition transition
Change in diet with high fat, high energy-dense foods and a sedentary lifestyle are results of westernization, urbanisation and mechanization occurring in most countries around the world (WHO, 2000; Popkin, 2001).
Lots of factors have contributed to increased life expectancy such as the best control of infectious disease, the advancement in nutrition and hygiene. But in developed countries, infectious diseases and nutrient deficiency diseases are being replaced by other diseases such as obesity, cardiovascular diseases and diabetes (WHO, 2000).
The low price of vegetable oils and sugar means that they form, with cereals, the cheapest food ingredients around the world (Drewnowski, 2000). As a result, diets based on cereals and grain products have been reduced (Popkin, 2001) and the world average energy consumption has greatly increased, but the distribution of this consumption is not evenly throughout the world’s population (Drewnowski, 2000).
Traditional diets which contain fibre and complex carbohydrates are now replaced by diets high in sugar, fat and animal products as major result of urbanisation and rising incomes (Drewnowski, 2000; Popkin, 2001). The substitution of ethnic cuisine and traditional food habits by westernised fast foods, soft drinks, increased meat consumption and the increased energy density is particularly a problem for the poor people in all countries around the world
Chapter 1. Obesity
1.4 Evolution of Adipose Tissue and Obesity
1.4.1 Adipose tissue
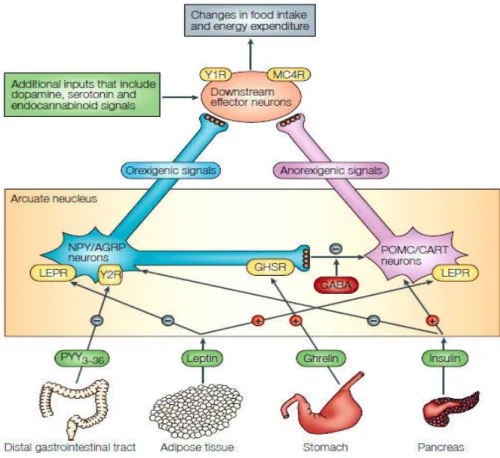
Adipocytes are cells that secrete several proteins and bioactive peptides (adipokines) that is why adipose tissue is now considered as real endocrine organ. In addition to these functions, adipocytes are also energy depots that store triglycerides during feeding and release fatty acids during fasting (Kershaw & Flier, 2004) (Figure 1.3). Several adipose tissue-generated molecules are discovered; leptin, interleukin-6 (IL-6), and tumour necrosis factor-α (TNF- factor-α). These molecules play an important role in energy homeostasis.
Figure 1.3 Adipocyte as an endocrine cell (Mantzoros, 2006)
1.4.2 Obesity, adipocyte hyperplasia and hypertrophy
It is well known that obesity is an unbalance between calories consumed and energy expended. The storage of excess energy in fat cells enlarged these cells in size and/or
1.4.2.1 Origin of adipocyte hyperplasia
Preclinical studies have demonstrated that adipocyte hyperplasia occurs in two steps: an increase in numbers of pre-adipocytes, followed by the differentiation of pre-adipocytes into mature adipocytes. The transition process from proliferation to differentiation in the adipocyte is tightly regulated by interaction between the cell-cycle regulators and the differentiating factors, and creates a cascade of events leading to the commitment of cells into the adipocyte phenotype (Rosen & Spiegelman 2000). This process, described as ‘adipogenesis’, requires a specific sequence of events to unfold, including growth arrest of proliferating pre-adipocytes, coordinated re-entry into the cell cycle with a limited clonal expansion, and growth arrest before terminal differentiation during lipid accumulation, suggesting that some cross-talk occurs between the cell cycle or the cell proliferation machinery and the factors controlling cell differentiation.
1.4.2.2 Origin of adipocyte hypertrophy
Hypertrophy is an increase in adipocyte volume. Using incorporation of environmental C14 as a tracer, Spalding and colleagues (2008) documented that “new adipocytes form constantly to replace lost adipocytes” and estimated the half-life of the average adipocyte to be in the order of 8.3 years. Furthermore, the same group postulated that adipocyte cell number is relatively fixed by early adulthood, and that any alterations in fat mass during adulthood are merely credited to alterations in adipocyte hypertrophy (Spaldinget al., 2008).
Chapter 1. Obesity
1.4.3 Obesity and adipose tissue distribution
The central change to the body in obesity is clearly the increase in the amount of adipose tissue – which may constitute more than half of total body mass in those with a BMI that is in excess of the threshold of obesity. It is not, however, only the total amount of fat that is important, but also its distribution. Thus, a more central fat deposition (‘android’ or ‘apples’, as opposed to ‘gynoid’ or ‘pears’) is associated with a greater risk of metabolic syndrome and several of the other diseases linked to obesity. A key question is why visceral fat is particularly significant in terms of obesity-associated disorders, and a long-standing position is that it is the proximity to the liver and the portal circulation that is important (Trayhurn, 2007).
1.4.3.1 Subcutaneous and visceral adipose tissue
Fat present around abdominal viscera in mesentery and momentum, known as visceral fat, is different from that present in subcutaneous areas (subcutaneous fat). The type of fat cells (Adipocytes), their endocrine function, lipolytic activity, response to insulin and other hormones differ between subcutaneous adipose tissue (SCAT) and visceral adipose tissue (VAT) (Mohsen Ibrahim, 2010).
Subcutaneous fat accumulation represents the normal physiological buffer for excess energy intake (high caloric diet) with limited energy expenditure (physical inactivity). It acts as a metabolic sink where excess free fatty acids (FFAs) and glycerol are stored as triglycerides (TGs) in adipocytes (Freedland, 2004). When the storage capacity of SCAT is exceeded or its ability to generate new adipocytes is impaired because of either genetic predisposition or
subcutaneous tissue, the natural store house for energy. Chronic stress leads to elevated cortesol levels that may lead to accumulation of VAT (Bjorntrop, 2001).
The anatomical and physiological differences between VAT and SCAT help explain the increased metabolic and cardiovascular risks associated with abdominal obesity. It is important to mention that the sequences proposed are being hypothetical.
1.4.3.2 Adipose tissue and insulin resistance
Adipocytes from VAT are more insulin-resistant than SCAT adipocytes. Smaller adipocytes tend to be more insulin-sensitive; large adipocytes become insulin-resistant. Amount of visceral fat is an important factor associated with variations in insulin sensitivity (Hisra & Vikram, 2003).
Insulin resistance prevents glucose and more fat from entering the cell and becoming preferentially oxidized. Subjects with visceral abdominal obesity, when compared with those with peripheral obesity, had lower glucose disposal, glucose oxidation and greater lipid oxidation.
Insulin resistance may be one of the most important factors linking abdominal visceral adiposity to cardiovascular risk (Mohsen Ibrahim, 2010).
1.4.3.3 Adipose tissue, free fatty acids lipolysis and glycerol release
Visceral adipocytes are more metabolically active and have a greater lipolytic activity than SCAT adipocytes (Lemieux & Despres, 1994). VAT is more susceptible to the
Chapter 1. Obesity
The degree of FFA suppression following meal ingestion differs between abdominally and peripherally obese persons. FFAs release is greater in the abdominally obese individuals (Mohsen Ibrahim, 2010).
1.4.3.4 Adipose tissue and glucose uptake
Visceral adipose tissue has higher rate of insulin-stimulated glucose uptake compared with SCAT adipocytes (Mohsen Ibrahim, 2010).
Small adipocytes in SCAT have a high avidity for FFAs and TG uptake. The new, small, more insulin-sensitive adipocytes act as a sink or powerful ‘buffers’, avidly absorbing circulating FFAs and TGs in the postprandial period (Freedland, 2004).
SCAT cells may act as a buffer or sink for circulating FFAs and TGs, but once they reach their capacity they lose their protective benefit, fat begins to accumulate in tissues not suited for lipid storage (Freedland, 2004). SCAT in abdominal wall has higher uptake of TGs and larger FFA release per kilograms than femoral fat does.
1.4.4 Triglycerides synthesis
Triglycerides are synthesised from three molecules of fatty acyl (co-enzyme A) CoA that are esterified to one molecule of glycerol-3-phosphate (G-3-P), which is then derived from glucose via glycolysis, to form a molecule of triglyceride. The overall reaction sequence for triglyceride synthesis is of more than esoteric interest because the synthesis and deposition of triglyceride in adipose tissue and muscle is a major factor in regulating energy metabolism in mammals. It is generally held that insulin controls triglyceride synthesis in adipose tissue
can be reduced to G-3-P for triglyceride synthesis in these tissues. However, there is increasing evidence that the pathway outlined above is not the major source of G-3-P for triglyceride synthesis in mammals. In fact, a metabolic pathway termed glyceroneogenesis (i.e. the synthesis of glycerideglycerol from sources other than glycerol and glucose) is emerging as an important source of carbon for glycerideglycerol in mammals, both during starvation and after ingestion of a diet high in carbohydrates (Nyeet al., 2008).
1.4.5 Different origins of fatty acids 1.4.5.1 Lipolysis
The liberation of glycerol and non-esterified fatty acids is the results of white adipose tissue triacylglycerol lipolysis which are released into the vasculature and are used as energy substrates by other organs.
Lipolysis rates are regulated precisely through hormonal and biochemical signals in response to changes in nutritional state. These signals modulate the activity of lipolytic enzymes and accessory proteins, allowing for maximal responsiveness of adipose tissue to changes in energy requirements and availability (Duncanet al., 2007).
Nutritional regulation of lipolysis can occur at multiple levels in response to changing metabolic conditions and nutrient intakes.
During the post-absorptive state, rapid regulation of adipose tissue lipolysis occurs in order to maintain the energy supply substrates and also to allow for efficient storage of excess fuels following a meal. In some extreme nutritional states, such as starvation or obesity,
Chapter 1. Obesity
1.4.5.2 Metabolism of brown adipose tissue
Large amounts of chemical energy as heat are dissipated by brown adipose tissue which is much evolved in mammals. Brown fat cells possess large numbers of mitochondria that contain a unique protein called uncoupling protein 1 (UCP1). UCP1 functions to dissipate the proton motive force that is normally used to drive the synthesis of cellular adenosine triphosphate (ATP)(Cannon & Nedergaard, 2004).
In small mammals, the brown adipose tissue persists as a distinct tissue, the major deposit of brown adipose tissue in newborn humans (between the shoulder blades) regresses shortly after birth. Other depots of brown adipose tissue can exist, for many decades, in adult humans but, it would have a negligible impact on whole-body energy homeostasis (Seale & Lazar, 2009).
1.5 Health Consequences of Overweight and Obesity
1.5.1 Morbidity
Above a BMI of 25 kg/m2, morbidity for a number of health conditions increases with BMI increasing. Higher morbidity in association with overweight and obesity has been observed for hypertension, T2D, coronary heart disease (CHD), stroke, gallbladder disease, osteoarthritis, sleep apnea and respiratory problems and some types of cancer (endometrial, breast, prostate, and colon) (Mustet al., 1999).
Obesity is also associated with complications of pregnancy, menstrual irregularities, hirsutism, stress incontinence, and psychological disorders (depression).