RESEARCH OUTPUTS / RÉSULTATS DE RECHERCHE
Author(s) - Auteur(s) :
Publication date - Date de publication :
Permanent link - Permalien :
Rights / License - Licence de droit d’auteur :
Bibliothèque Universitaire Moretus Plantin
Institutional Repository - Research Portal
Dépôt Institutionnel - Portail de la Recherche
researchportal.unamur.be
University of Namur
Topological Properties and Temporal Dynamics of Place Networks in Urban
Environments
Noulas, Anastasios; Shaw, Blake; Lambiotte, Renaud; Mascolo, Cecilia
Published in:
Proceedings of the 24th International Conference on World Wide Web
Publication date:
2015
Link to publication
Citation for pulished version (HARVARD):
Noulas, A, Shaw, B, Lambiotte, R & Mascolo, C 2015, Topological Properties and Temporal Dynamics of Place
Networks in Urban Environments. in Proceedings of the 24th International Conference on World Wide Web.
ACM Press, WWW '15 24th International World Wide Web Conference, Florence, Italy, 18/05/15.
General rights
Copyright and moral rights for the publications made accessible in the public portal are retained by the authors and/or other copyright owners and it is a condition of accessing publications that users recognise and abide by the legal requirements associated with these rights. • Users may download and print one copy of any publication from the public portal for the purpose of private study or research. • You may not further distribute the material or use it for any profit-making activity or commercial gain
• You may freely distribute the URL identifying the publication in the public portal ?
Take down policy
If you believe that this document breaches copyright please contact us providing details, and we will remove access to the work immediately and investigate your claim.
Topological Properties and Temporal Dynamics of
Place Networks in Urban Environments
Anastasios Noulas
Computer Laboratory University of Cambridge
Blake Shaw
Foursquare 568 Broadway, New York
Renaud Lambiotte
Department of Mathematics University of NamurCecilia Mascolo
Computer Laboratory University of CambridgeABSTRACT
Understanding the spatial networks formed by the trajectories of mobile users can be beneficial to applications ranging from epi-demiology to local search. Despite the potential for impact in a number of fields, several aspects of human mobility networks re-main largely unexplored due to the lack of large-scale data at a fine spatiotemporal resolution. Using a longitudinal dataset from the location-based service Foursquare, we perform an empirical anal-ysis of the topological properties of place networks and note their resemblance to online social networks in terms of heavy-tailed de-gree distributions, triadic closure mechanisms and the small world property. Unlike social networks however, place networks present a mixture of connectivity trends in terms of assortativity that are sur-prisingly similar to those of the web graph. We take advantage of additional semantic information to interpret how nodes that take on functional roles such as ‘travel hub’, or ‘food spot’ behave in these networks. Finally, motivated by the large volume of new links ap-pearing in place networks over time, we formulate the classic link prediction problem in this new domain. We propose a novel vari-ant of gravity models that brings together three essential elements of inter-place connectivity in urban environments: network-level interactions, human mobility dynamics, and geographic distance. We evaluate this model and find it outperforms a number of base-line predictors and supervised learning algorithms on a task of pre-dicting new links in a sample of one hundred popular cities.
1.
INTRODUCTION
Mobile user trajectories are known to exhibit structural and tem-poral regularities associated with the daily and weekly cycles of hu-man activity. The spatial network formed by user movement, and its topological characteristics in particular, have been explored in recent research including the detection of urban neighborhoods [11], place recommendation to mobile users [31], touristic route identifi-cation [26], and a broad range of appliidentifi-cations in epidemiology [2].
Permission to make digital or hard copies of all or part of this work for personal or classroom use is granted without fee provided that copies are not made or distributed for profit or commercial advantage and that copies bear this notice and the full citation on the first page. Copyrights for components of this work owned by others than ACM must be honored. Abstracting with credit is permitted. To copy otherwise, or republish, to post on servers or to redistribute to lists, requires prior specific permission and/or a fee. Request permissions from [email protected].
WWW’15, May 18–22, 2015, Florence, Italy.
Copyright 20XX ACM X-XXXXX-XX-X/XX/XX ...$15.00.
However, the majority of models of human mobility focus exclu-sively on its spatial characteristics [7, 16, 39], and neglect both net-work topology and temporal dynamics. Recent net-work has proposed more advanced computational methods that realize some of these aspects, for instance by incorporating information about users’ so-cial network [36] and their spatiotemporal dynamics [9]. The ap-plicability of these approaches is limited, however, as they rely on complete knowledge of a user’s historic whereabouts and social connections as input, which might not be readily available in most domains.
The goal of this paper is to bridge the gap between universal mobility models and complex computational methods in mobility modeling. As opposed to tracking the whereabouts of individual users, our key idea is to use the aggregate trajectories of users between real-world places to define a network of venues in the city. Using a longitudinal dataset from the location-based service Foursquare we empirically analyze place networks in one hundred metropolitan areas across the globe. Exploiting a set of insights on the growth patterns, temporal dynamics, and topological prop-erties of these place networks, we then build a new human mobil-ity model that accurately predicts the future interactions between places in urban environments with minimal parameterization and computational costs. Our work is articulated in three parts: Place network growth and temporal pattern analysis
.
We first consider the temporal properties of place networks, and focus on their growth over time in terms of edge and node addition pro-cesses (Section 2). In accordance with previous observations in online social networks [21], we observe a densification pattern, as the number of edges grows superlinearly to the number of nodes in the system. A saturating effect for node growth is reached quickly nonetheless, when the large majority of Foursquare venues have been added to the network. It takes approximately 10 weeks for mobile users to crowdsource a large fraction (more than95%) of public places in a city. Subsequently, we compare instances of place networks across consecutive time windows of observation; we find that a significant number of new links are generated over time as users form new spatial trajectories when they navigate be-tween places. The set of places that generate those edges, however, remains remarkably stable over long periods of time. These results reveal the importance of viewing connections as fleeting entities that emerge dynamically in the network.Topological properties of place networks
.
We then empirically analyze the topological properties of place networks (Section 3). We make two key observations: first, we note that place networksexhibit the well-known characteristics of social networkssuch as heavily skewed degree distributions, scale-free properties, small-world behavior, and high clustering coefficients. We trace this re-lationship to the inherent inter-dependence between mobility and social link formation in geographic space [36, 9, 40]. In contrast, we also find a striking difference compared to social networks: they show a resemblance to the web graph presenting a balanced assor-tative mixing pattern with hub nodes connecting to each other but also to low degree nodes.This non-social property arises from the different roles played by places in the network. In particular the existence of travel spots (e.g. train stations or airports), act as in-termediate hubs between nearby places (e.g. restaurants, the most frequent place type in the network), typically characterized by low degrees. These characteristics are consistent across one hundred cities.
A new gravity model for link prediction in place networks
.
Fi-nally, the turnover of links in the network over time motivates the following prediction task: given past observations about the con-nectivity of public venues in Foursquare, we would like to predict the pairs of places that are likely to connect at a future time (Sec-tion 4). Candidate predic(Sec-tion models need to rank highly the pairs of venues that are most likely to interact, a task complicated by a number of challenges. In particular, the highly volatile, time depen-dent, link generation process and sparse data setting may hinder the use of complex prediction algorithms that can be prone to overfit-ting. The inherently spatial embedding of the network suggests the need for models which integrate appropriately geographic distance as a factor. We therefore develop a generalization of gravity mod-els[7, 16, 8, 29], popular in the mobility and transport literature, into which we incorporate the temporal aspects of the system. The model combines information on venue synchronization in terms of user activity, in- and out-bound movement towards places, and geo-graphic distance. In practice, it captures the observation that nodes may act as sources or sinks of users in the course of time, depend-ing on their cycle of activity. Finally, it incorporates information about the interaction of places on the network level, a valuable as-pect of attraction that has been ignored by past mobility modeling approaches. The ranking strategy put forward by the model out-performs popular supervised learning algorithms by at least two points in the Area Under the Curve (AUC) score, and by a large margin the model adhering to the standard formulation of gravity in the literature (AUC score 0.905 versus 0.811). This is achieved with minimal requirements for training and optimization, making it ideal in practical application scenarios where expensive compu-tations can pose a trade-off against the real time demands of many mobile applications. These results are discussed in Section 5.2.
NETWORK GROWTH AND DYNAMICS
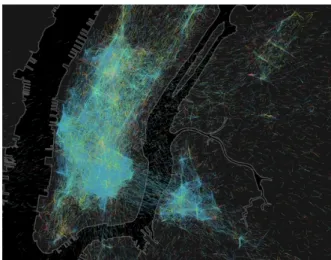
Figure 1 presents a visualization of the place network shaped by the movement of Foursquare users in New York City. One can spot hubs being formed at multiple areas of the city, with local transitions connecting them to nearby places and occasional long jumps connecting places located further apart from each other, for example when users move between Manhattan and Brooklyn.
In this section, we investigate the growth patterns of such net-works. In particular, we are asking how does the number of new edges observed in the network relate to the number of nodes, or places that are being crowdsourced by Foursquare users? Subse-quently, we explore how the network in a city changes over long periods of time, when considering different temporal windows of observation. Are two temporal network snapshots similar to each other? Or, instead, do mobile users form new trajectories as they
Figure 1: A visualization of the place network for New York City at 11pm. Each dot represents a user traveling between venues, and is color-coded by the category of the destination with blue being nightlife and green being food. We clearly see the edges of the network formed by people moving between places.
explore the city, contributing towards the formation of a large vol-ume of new links?
2.1
Preliminaries on place networks
We define an urban place network as a directed weighted net-work whose nodes are the popular public places of a city. For each city, we consider a finite time period of observation t and build a directed graphGtcomprised of a set of nodesVt and a set of
edges, or links,Et. An edge is formed between a pair of places if a Foursquare user directly transitioned between that pair during periodt. By a direct transition of a user between two places i and j, we mean that the user checked in at placei first and his next check-in took place atj. If more than one transition occurs between two places, the weight of an edge is incremented accordingly. We fur-ther impose a temporal threshold on each transition so that only direct transitions within3 hours are taken into account. This aims to avoid biases related to non-direct user movements.
2.2
Network growth patterns
Network densification is a fundamental phenomenon in network dynamics and relates to the different rhythms with which nodes and edges are added to the network. Previous work by Leskovec et al. [21] characterizes empirically the densification process in on-line social and technological networks showing that the number of edges grows superlinearly with the number of nodes in the network. Specifically, given the number of nodesn(t) observed at a point in timet, one is interested in the number of edges e(t) and the way this relationship forms ast grows. Formally we have:
e(t)∝ n(t)α (1) Different values of the exponent α imply differences in the ex-pected number of edges over time. A graph withα = 1 maintains a stable average degree over time, whereas α > 1 corresponds to an increase in the average degree. The findings reported by Leskovec et al. suggest that the latter is the case in many real world networks, and here we investigate whether it holds also in urban place networks. We pick a random point in timet0where we begin
monitoring the evolution of a place network and then measure the number of new nodes and edges added by users sequentially. Fig-ure 2 shows the number of edges versus the number of nodes in the
100 101 102 103 104 105 Nodes 100 101 102 103 104 105 106 Edges Los Angeles San Francisco x1.14
Figure 2: Number of edges versus number of nodes in Los An-geles and San Francisco as the cities become crowdsourced by Foursquare users.
cities of Los Angeles and San Francisco, as venue information in these cities becomes crowdsourced over time by Foursquare users. Initially the number of links grows superlinearly with the number of nodes. We have measured using the least squares optimization method an exponentα = 1.14 with a standard deviation±0.06 across a set of one hundred cities. However, at a specific city size-dependent threshold, this scaling breaks, as the number of nodes ceases to increase whereas new links continue to appear. At that point, a majority of places have been discovered by the users, and finite-size effects induce a slowing down of new place discovery, as shown in Figure 3, where we plot the fraction of newly added venues over time for the two cities. One observes that it takes ap-proximately10 weeks for Foursquare users to crowdsource a sig-nificant fraction of the city’s set of public venues, as the probability of seeing a new place after the10th week drops to approximately 0.02, with a convergence very close to zero after several weeks. One should note that new venues such as retail facilities are con-tinuously created in a city, so the probability may never drop to zero, but the time scale of urban growth is much slower, on the order of months or years [27], than the rate of place discovery by Foursquare users. Unlike an online social network, or other tech-nological networks, that may be able to reach a maximum number of nodes in the order of years (Facebook still adds new users at a high rate [41]), urban place networks are smaller in size by several orders of magnitude. Even a large metropolis will have on the order of several thousand places, which is a significantly smaller number compared to the hundreds of millions of users in a social graph. Im-portantly, the number of edges crowdsourced by the users remains small as compared to the total number of connections, of the or-dern(t)2, and no finite-size effect is encountered by link creation,
which leads to the patterns of Figure 2.
2.3
Temporal dynamics of place networks
Link generation over time
.
The results of section 2.2 show that place networks are dynamically evolving entities with new edges being added continuously over time. Given these observations, a natural question to ask is how do these links persist in time? Put otherwise, will an observed link re-appear?Considering three-month temporal snapshots over a period of two years, from the beginning of 2012 to the end of 2014, we es-timate the probability of a new place, or a new edge, being added in a subsequent time period. Formally, given the set of edgesEt
observed in a network snapshot during a three month periodt and the set of edgesEt+1of the subsequent time period, we define the
0 5 10 15 20 25 30 35 40 45 Week Count 0.00 0.02 0.04 0.06 0.08 0.10 0.12 0.14 0.16 0.18 N ew P la ce P ro ba bi lit y LosAngeles SanFrancisco 100 101 102 103 104 105 Nodes 100 101 102 103 104 105 106 Edges Los Angeles San Francisco x1.14
Figure 3: Starting from week2, we show the fraction of new venues added to the system out of the total observed that week, for Los Angeles and San Francisco.
Apr ’1 2 Jul ’1 2 Oct ’12 Jan ’1 3 Apr ’1 3 Jul ’1 3 Oct ’13 Network Snapshot Sequence 0.60 0.65 0.70 0.75 0.80 0.85 0.90 0.95 1.00 Ne w Edge Probability
Figure 4: Probability of observing a new edge in the next network snapshot. The probability is measured by comparing successive temporal network snapshots. Each point on the x-axis refers to the date that a snapshot ends and its successor begins. The shaded area corresponds to the standard deviations across100 cities worldwide.
probability of a new edge occurring in the next snapshot as: Pe= |E
t+1
− Et
|
|Et+1| (2)
Figure 4 shows the corresponding probabilities across seven subse-quent intersections of network snapshots. The probability of a new edge forming is approximately70− 75% and has small standard deviations across cities as shown by the shaded curve.
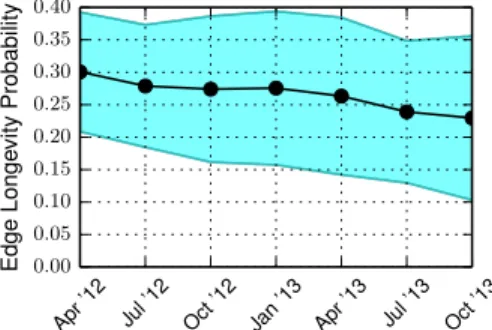
A related measurement is the probability that an edge will persist in the network by re-emerging consistently in network snapshots over several months. Figure 5 shows the average probability for a given edge’s reappearing in snapshotst+1, t+2 . . . t+n given that the edge has appeared in snapshott. We use the term edge longevity to denote this process. Formally, this probability is defined as the cardinality of the intersection ofn consecutive network snapshots, divided by the cardinality of the starting snapshott:
Pe,n= | Et ∩ Et+1 · · · ∩ Et+n | |Et| (3)
We observe that this probability is just above30% with values dropping towards20% over subsequent months. The small portion of stable links that propagate through time, roughly20%, corre-sponds to high-weight edges representative of regular traffic pat-terns like commuting. We will delve deeper into the functional role of places in the network in Section 3, where we observe that most high-weight edges are linking to travel hubs (airports, train
Apr’12 Jul’12 Oct’12 Jan’13 Apr’13 Jul’13 Oct’13
Network Snapshot Sequence
0.00 0.05 0.10 0.15 0.20 0.25 0.30 0.35 0.40 Edge Longe vity Probability
Figure 5: The edge longevity probability measure shows the ten-dency for an edge to appear in future temporal network snapshots.
5 10 15 20 Edge Weight 0.0 0.2 0.4 0.6 0.8 1.0 E dg e Pe rsi st en ce P ro ba bi lit y
Figure 6: Probability that an edge will persist in the next network snapshot as a function of the edge’s weight for New York.
stations etc.). Figure 6, demonstrates that an edge’s longevity di-rectly relates to its weight. We report the probability that an edge will persist in the following snapshot as a function of the edge’s weight defined as:
Pe(w) = |{
e∈ Et
∩ Et+1: weight(e)
≥ w}| |{e ∈ Et: weight(e) > w}| (4)
whereweight(e) is the function that returns the weight of an edge e. An edge with weight equal to 2 has a probability very close to 0.4 of being observed in the next time window, with the same probabil-ity doubling to a value very close to0.8 when the weight is equal to5. It should be noted that there is a possibility, albeit small, that high-weight edges may not re-appear in the future. Large events or transport disruptions could alter the flow of movement of urban populations [15], e.g. when a large crowd is moving to the park for a music festival. This can lead to the opportunistic appearance of high-weight edges that may not persist over long periods of time. Node persistence over time
.
We now investigate whether places persist over longer periods of time. As we did in the case of net-work links, we formulate the new node and node longevity proba-bilities and observe how these evolve across several temporal snap-shots. Similarly to the new edge probability definition, the new node probability, defined asPu= |
Vt+1
− Vt
|
|Vt+1| (5)
for the set of nodes inVtduring periodt, is approximately 5%,
as shown in Figure 7. These results suggest that connectivity in cities emerges over a very stable base of venues with the constant generation of new links formed due to differences in users’ mobil-ity patterns. We also consider the persistence probabilmobil-ity of nodes
Apr’12 Jul’12 Oct’12 Jan’13 Apr’13 Jul’13 Oct’13
Network Snapshot Sequence 0.00 0.05 0.10 0.15 0.20 0.25 0.30 0.35 0.40 Ne w Node Probability
Figure 7: Probability of observing a new node in the next network snapshot.
Apr’12 Jul’12 Oct’12 Jan’13 Apr’13 Jul’13 Oct’13
Network Snapshot Sequence 0.60 0.65 0.70 0.75 0.80 0.85 0.90 0.95 1.00 Node Longe vity Probability
Figure 8: Node longevity across temporal network snapshots.
formalized as: Pv,n= | Vt ∩ Vt+1 · · · ∩ Vt+n | |Vt| (6)
We observe that places seen in a snapshot, not only persist to the following one as implied by Figure 7, but as shown in Figure 8 they are active in the network with a probability greater than95% over many subsequent months with the value remaining above90% on average even after two years.
Taken together, these results paint a picture of a highly volatile network in terms of the edge generation process. Unlike online social networks, such as Facebook, where the friendships being formed among users tend to persist across time, in place networks the majority of links are constantly evolving and often fleeting, ex-isting only for a short time period. This observation motivates the construction of link prediction models that can track their evolution over time. An improved understanding of the mechanisms behind network evolution is crucial in order to provide more intelligent location-based services that can adapt to the ever-changing patterns of cities and offer more tailored recommendations and advertise-ments based on a user’s location and expected mobility patterns. Prior to devising predictive models for link prediction in place net-works, we investigate their topological properties in the following section.
3.
PROPERTIES OF PLACE NETWORKS
In Section 2, we have shown how place networks are similar to other networks in terms of densification patterns. We now ask whether this similarity manifests also with regard to the more elab-orate properties of networks. We aim to answer the following ques-tion: Do place networks in cities have similar structural properties to other social and technological networks that have been empiri-cally investigated in the past or are they fundamentally different?
City |V | |E| C Cr D Dr d dr hki r Saint Petersburg 9292 278099 0.20 0.08 5.83 5.91 3.30 3.25 42.57 −0.05 Moscow 8962 168945 0.19 0.07 6.25 6.00 3.21 3.37 30.96 −0.05 Sao Paulo 8643 66110 0.17 0.04 6.83 6.25 3.67 3.68 18.01 −0.05 New York 8156 145671 0.18 0.07 5.91 5.25 3.12 3.14 40.99 −0.07 Kuala Lumpur 7656 56035 0.19 0.05 6.41 6.00 3.45 3.43 23.93 −0.06 Istanbul 7389 60790 0.14 0.02 10.00 7.50 4.66 4.20 10.50 +0.05 Tokyo 7327 36627 0.23 0.07 7.58 7.16 3.79 3.79 10.40 −0.09 Bangkok 6986 33827 0.15 0.04 7.41 6.58 3.88 3.74 15.58 −0.00 Singapore 6825 30384 0.14 0.02 8.08 7.08 4.02 3.89 14.95 −0.00 Jakarta 4645 10776 0.08 0.00 10.83 9.25 5.45 5.07 5.84 +0.05
Table 1: Statistics and network properties for a set of10 cities in the first three months of 2013. For each network we report the number of nodes|V |, number of edges |E|, mean clustering coefficient C, median network diameter D, mean shortest path d, average degree hki for the undirected network versions and assortativityr. We denote the statistics of the corresponding null models with the subscript r where appropriate. 100 101 102 103 104 Node Degree 10−7 10−6 10−5 10−4 10−3 10−2 10−1 100 PDF Sao Paulo Kuala Lumpur New York k−1.84
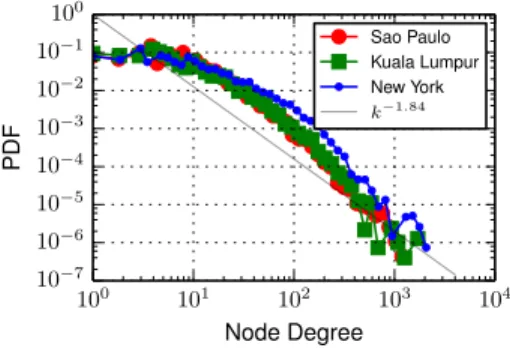
Figure 9: Probability density of the degree distribution in a tempo-ral network snapshot for three cities and a linear fit to the plotted data on a log-log scale.
Topological network properties such as the degree distribution, community structure or small-world behavior are known to have important implications for the functionality of real-world networks, including their robustness and information spreading. Moreover, the existence of regularities in the network topology, associated with mechanisms driving link formation, is a central ingredient in algorithms for link recommendation, as seen in online social net-works [1, 22]. In Table 1, we summarize the statistics of the place networks built from the check-ins observed in the first three months of2013 for 10 cities in our dataset.
Network heterogeneity and the functional role of places in the urban domain
.
Many real world networks, including the world wide web and social networks, are known to exhibit a heavy-tailed degree distribution, often approximated by a power-law of the form P (k) ∝ k−β. The latter is associated with a strong heterogene-ity in the connectivheterogene-ity of the system, as a vast majorheterogene-ity of nodes are poorly connected, while a few nodes play the role of hubs and inter-connect a large number of neighbors. As we show in Figure 9, place networks also exhibit a heavy-tailed degree distribution. Us-ing the maximum likelihood parameter estimation method [10], we fit the distribution, and find a mean power-law exponentβ equal to 1.84 with a standard deviation of 0.09 across 100 cities. A similar relationship holds for the edge weight distribution in the network, shown in Figure 10. The exponent2.65± 0.05 indicates the ex-istence of strong links, associated with a large flow of users, even on the order of several hundreds, between certain places. In or-der to interpret the strong heterogeneities present in the system, we exploit semantic information about Foursquare venue types.Fig-100 101 102 103 Edge Weight 10−8 10−7 10−6 10−5 10−4 10−3 10−2 10−1 100 PDF Sao Paulo Kuala Lumpur New York x−2.65
Figure 10: The edge weight distribution is more broad compared to the distribution of degrees shown in Figure 9.
ure 11, illustrates the distribution of edge weights stratified by the underlying place categories (e.g. ’food’, ’nightlife’, etc.) for New York City. Food places (e.g restaurants, sandwich places, coffee shops etc.) dominate the sets of low-weight nodes, but are progres-sively replaced by transportation hubs as weight increases. This observation is in agreement with the fact that food places are the largest set in terms of number of places, i.e. that correspond to a mean fraction0.4± 0.05 of the venues observed in a city, whereas travel places are dominant in terms of their proportion of check-ins,0.13± 0.07, despite their fairly small number of venues (mean 0.04± 0.02). Both types of venues match their traditionally per-ceived role as functional units in the urban setting: that is, a diverse pool of food establishments operating alongside the presence of a few primary transportation hubs that handle most of the citizen and commuter mobility. While other place types co-exist in this envi-ronment, the dominance of food and travel spots, in terms of num-ber of nodes and high weight links respectively, is remarkable. This potentially reflects two fundamental requirements of modern cities as part of the ever-intensifying urbanization process in modern de-velopment. First, the need for efficient urban mobility facilitated by transportation hubs, and second, the necessity for the presence of myriad food spots, spread around the city, in order to support human populations with vital resources.
Note that, as the distribution of edge weights is well fitted by a power law, there is a vast number of edges that only occur once or twice. By definition, the latter do not survive long and tend to appear as new events in the network evolution, as we discussed in the previous section (see Figure 4). The fact that the distribution of node degrees is less peaked at small values (the probability is
Figure 11: Edge weight distribution by place category in New York with Travel & Transport in green color and Food in black.
approximately uniform for degrees smaller than10), implies that places are more persistent than edges, as we observed in Figure 7. Triadic closure and small-world property
.
A list of the main network statistics for a sample of cities in the dataset is given in Table 1. We first note that the vast majority (almost99%) of the nodes belong to the network’s giant connected componentNGC.For each city, we also present a randomized network (null model) where links are randomly rewired, preserving the number of nodes, edges and the original degree distribution of the places in the work. This way we are able to assess the significance of the work measurements as compared to the corresponding random net-work.
Triadic closure is a central mechanism of social network evolu-tion, typically measured with the average clustering coefficientC
C = 1 |V |
X
u∈V
cu (7)
wherecu is the fraction of closed triangles between nodes
con-nected to nodeu, also known as the local clustering coefficient. C has been calculated for the undirected version of the place net-work, leading to a mean clustering coefficient value ¯C = 0.20 with a standard deviation0.06 across the full set of cities. The corresponding average value for the null models was significantly lower, ¯Cr= 0.07± 0.03. The exact mechanisms leading to a high
density of triangles in place networks may be different from those of social networks, yet it is notable that this property consistently holds in the former class of networks. Let us also note that place networks are embedded in space, and that spatial embedding is a plausible mechanism leading to triadic closure [37]. The strong connections between social network topology and human mobility patterns [38, 9, 40, 23] are also expected to make social networks and place networks share similar patterns.
Next, we focus on the distance between nodes, in terms of the number of hops between them in the place network. We report a mean shortest path ¯d = 3.35± 0.52 across cities and a mean diam-eter ¯D = 6.35± 1.46, when the values of the randomized versions are ¯dr = 3.33± 0.46 and ¯Dr = 5.93± 1.19 respectively. The
existence of short paths connecting places in the network, together with their high clustering coefficient, imply that place networks are small-world. The small-world property can have significant
im-plications for multiple processes in urban systems, including the spread of epidemic disease or information propagation and rumor spreading in cities, as has been described in the context of many other network systems [19]. Despite the relationship with online social networks identified so far, as we demonstrate next, place net-works present non-social connectivity patterns too.
Analogies to the web graph
.
Because of their strong relationships to human mobility, place networks can be viewed as spatial navi-gation systems[20]. For this reason, and inspired by recent works on virtual navigation of web users in online domains [42, 43], we now investigate whether place networks reproduce non-social topo-logical properties, associated with information systems like the web graph. To do so, we focus on the notion of assortativity [28]. Social networks are known to present positive assortative mixing, that is a tendency for high-degree nodes to be connected with each other. On the contrary, the world wide web presents a mixed assortativ-ity trend with hubs connecting to each other but also to low-degree nodes. In the case of place networks, we observe a very similar behavior with a mean value ofr =¯ −0.055 ± 0.04. This value is remarkably consistent across the one hundred cities, and very close to that observed empirically in the world wide web graph (r =−0.065) and in protein interaction networks (r = −0.156) [28]. The latter observation is reminiscent of recent models of cities as biological organisms [5].The assortativity scores in place networks can be explained by their polycentric, hierarchical structure ([35]), where two dominant connectivity patterns emerge: transport hubs (high degree nodes) connect to each other through the transportation system to facil-itate commuter transit and, at the same time, hubs interact with a plethora of low degree nodes, associated with services, such as food and nightlife places, as users move to nearby places for re-freshments and entertainment. This process is also reminiscent of authorities and hubs in the web, that is pages with authoritative content and others that connect to many of them.
4.
LINK PREDICTION
The empirical analysis of place networks in Section 2 has re-vealed that a large number of new links is being generated steadily over time. Despite the large turnover of the links present in the sys-tem, the networks exhibit stable topological patterns, as described in Section 3. Our objective now is to exploit network structure to-gether with mobility information about the temporal dynamics of places, in order to predict where edges will appear in a future time period. We manifest this goal by proposing a new gravity model in Paragraph 4.2. We also formalize a set of network and mobility models (Paragraph 4.1) and present a host of supervised learning algorithms (Paragraph 4.3) that we use as a testbed to assess the model’s efficacy.
Problem formulation
.
Given a graph representing the place net-work of a cityGt= (V, Et) during a period t, the goal is to predict the edgesEt+1that appear in the network during the nexttempo-ral snapshot t + 1. The problem essentially consists of ranking pairs of nodes(i, j) according to a numeric score rij estimating
the likelihood of an edge appearing between a source nodei and a destination nodej, with i, j ∈ V . Link prediction has been a popular problem in recent years and numerous models have been proposed to determinerij: from unsupervised predictors primarily
exploiting node topology in the network [22], to supervised learn-ing algorithms that integrate multiple signals synchronously [24].
5 10 15 20 Common Neighbors 0.0 0.1 0.2 0.3 0.4 0.5 0.6 Link Probability
Figure 12: The probability of link formation in the next temporal network snapshot as a function of the common neighbors shared by two nodes in the network, shown for Chicago.
Challenges
.
The introduction of the link prediction problem in the domain of urban place networks brings new challenges that the can-didate prediction models need to address. First, the realization of the short term temporal dynamics in user mobility due to the exis-tence of periodicities and diurnal patterns in human activity during a week. For example, a corporate office is more likely to connect to a coffee shop on a Wednesday morning as opposed to a Saturday night. Second, the ability to cope with the long term temporal dy-namicscharacterizing the system, since there is significant novelty in terms of edges in the network over time; activity in the system drift as users alter their mobility patterns during urban exploration or due to seasonal changes. Third, geography is known to play an important role in connectivity in urban environments [30]. As a consequence, link prediction models deployed in cities should in-tegrate information on the distance between places effectively.4.1
Network formation and human mobility
We view an urban place network as an entity shaped by the inter-play of two primary forces: its current network form, as seen in a given window of observation, and human movement, which is the generative force of connectivity in the system. Our underlying as-sumption is that this feedback loop between network and mobility forces is key to the network’s evolution. In the following, we de-fine a number of models, associated with different link formation mechanisms, which we exploit in the link prediction problem. Network predictors
.
Let us first introduce network models for the link prediction task. We are guided by the common properties be-tween place networks and social networks, discussed in Section 3. Being also inspired by popular algorithms for link prediction in online social networks, we introduce a set of predictors which are based on two key factors in link generation: triadic closure and node centrality.• Triadic closure mechanics. A standard predictor to deter-mine whether two nodes in a network will connect is the number of common neighbors they share. We thus define the CommonNeighbors feature for two venues i and j as |Γi∩ Γj|. In the above formulation, the greater in
num-ber the common neighbors of two venues, the more likely they are to interact in the future through a direct user transi-tion. We verify this assumption in Figure 12 where we see a significant increase in the probability of inter-place con-nectivity as the number of common neighbors for a pair of places grows. Jaccard’s similarity coefficient has been pro-posed [22] as an improvement to this indicator by taking into account, additionally, the size of the neighborhoods of the two places. We refer to this model as NeighborOverlap and define it as |Γi∩Γj| |Γi∪Γj|. 2 0 2 4 6 8 10 Logarithm (base 10) 10 4 10 3 10 2 10 1 100 Link Probability Distance Popularity
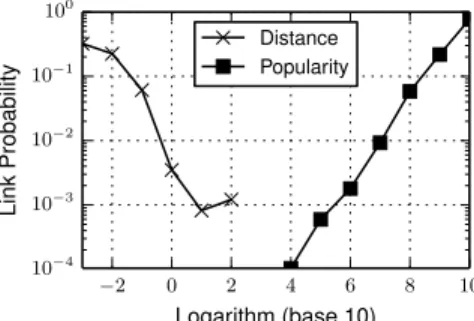
Figure 13: The probability of link formation in the next temporal network snapshot as a function of the geographic distance between two places and the product of their popularities in New York.
Furthermore, we define the AdamicAdar indicator that de-pends on the number of common neighbors of two places, but also penalizes those common neighbors that have high degrees: X z∈Γi∩Γj 1 log(|Γz|) (8)
This measure is known as a very efficient predictor in online social networks [1]. In Section 5, we will show that this is also the case for place networks. For this reason, we also integrate it into the new gravity model we present in Para-graph 4.2.
• Node centrality metrics. In addition to the previous predic-tors based on triangles, we also focus on predicpredic-tors purely based on the importance of the nodes. A basic centrality measure is degree centrality, and it is incorporated into the feature DegreeProduct as|Γi|.|Γj|, which can be
general-ized by taking into account the direction of the links, In-OutDegreeProduct as|Γ+i|.|Γ−j|. Finally, we also use a non-local measure of centrality, PageRank [32], denoting the score of placei as rw(i), and define the PlaceRank indicator rw(i).rw(j).
Mobility predictors
.
We now introduce a set of spatial and mo-bility information signals related to places.• Static mobility metrics. Geographic distance is well-known to have an impact on human mobility [7, 16], and its ef-fect has been evaluated in the case of location-based social networks [9, 31]. For this reason, we use the GeoDistance predictor that ranks two candidate venuesi and j according to their geographic distanced(i, j) measured in kilometers. The closer two venues are, the higher their position will be in the prediction list, with the implicit assumption being that nearby places are more likely to form a link at a future time. Next, we define a Popularity feature that ranks venue pairs according the product of their popularitycicj, whereci is
simply the sum of check-ins at placei. The strong effect of geographic distanceand popularity on the probability of a link existing for a pair of places is shown in Figure 13. • Mobility dynamics. The popularity of Foursquare venues
does not remain static over time however. It is constantly changing with strong diurnal and weekly patterns due to cor-responding variations in urban human movement and activ-ities. Since we are able to capture the precise time of each
0
5
10
15
20
Destination Peak Hour
0
5
10
15
20
Or
igin
Peak
Hour
0.00
0.05
0.10
0.15
0.20
0.25
0.30
0.35
0.40
0.45
(a) Weekdays 0 5 10 15 20Destination Peak Hour 0 5 10 15 20 Or igin Peak Hour 0.00 0.05 0.10 0.15 0.20 0.25 0.30 0.35 0.40 (b) Weekends
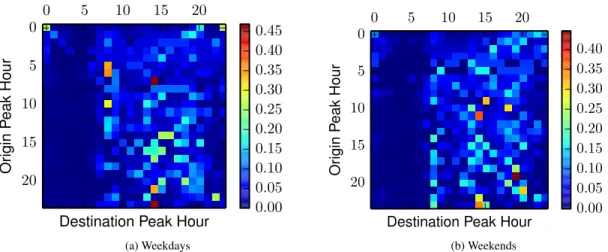
Figure 14: Diurnal venue interaction patterns aggregating over weekdays (top) and weekends (bottom) for the city of London. On the y-axis (rows) we note the peak hour of the origin venue, and on the x-axis (columns) that of a destination. Each point refers to the density of transitions between venues in a given hour slot.
check-in we can explicitly model these fluctuations. We de-fine the temporal similarity between two placesi and j as the cosine similarity between theirT -dimensional check-in frequency vectors equal to:
cos(~ciτ, ~cjτ) : τ∈ {1, T } (9)
T can be set equal to 24 or 168 to capture daily and weekly cycles of activity respectively. We denote the diurnal and weekly similarity models as DiurnalSim and WeeklySim respectively. Both metrics are based on the assumption that two venues are more likely to connect when they are visited by mobile users during similar hours.
The importance of place synchronization is shown in Figure 14, where we visualize the relationship between venue interaction fre-quencies and venue peak hours (peak hour is simply the hour when the number of check-ins of a venue maximizes). Plotting on the y-axis the peak hour of an origin venue we can see the probability of forming an edge with a destination venue that peaks at a certain hour of the day. Venues that are active in the morning are rela-tively more likely to connect to venues that peak in the morning too, with this relationship holding considering different temporal intervals through day and night. In the following paragraph, we fuse information about the mobility dynamics seen here with the network features presented above, to introduce a new gravity model that realizes the characteristics of modern mobility datasets.
4.2
Gravity Models
The use of gravity models to reproduce human migration pat-terns roots back to the seminal work of Ravenstein [34]. Different variants have been developed, initially in transportation research and urban planning in the 50s and 60s [8, 29] and more recently when studying large-scale mobility patterns measured in census or cellular data [7, 16]. Inspired by Newton’s law of gravity, gravity models assume that the flux between two regionsi and j takes the formPij∝ kikjf (dij) where f (dij) is a deterrence function
de-creasing with the geographic distancedijbetweeni and j. kiis a
measure of the region’s mass, its attractiveness. Taking a standard form for the deterrence functionf (d) ∼ d−β, we propose in this
section two versions of gravity models: a classic formulation, as defined in the literature, and a new gravity model that incorporates the importance of network structure and temporal synchronization
between regions. Note that in the present domain places are used as proxy for regions.
• A static formulation of gravity. The notion of mass, in gravity models, depends on the nature of the system under scrutiny. In the case of fluxes of mobility between cities, for instance, it is common to use their population as a proxy. In our classic version of the gravity model, we therefore use the total popularity of place as its mass, and define a Gravity index as:
cicj
d(i, j)β (10) This model is essentially a combination of the Popularity and GeoDistance features, defined in the previous paragraph and whose effect on place connectivity has been illustrated in Figure 13.
• A dynamic gravity model. Modern mobile datasets have the advantage, as compared to old-fashioned data concerning mobility, e.g. based on censuses, to include a fine temporal resolution. Our analysis of place networks suggests that the temporal patterns of node activity play an important role in link formation. This observation motivates the incorporation of temporal information into the gravity model in order to ac-count for the inherently dynamic aspects of human mobility. Similarly, our results concerning triadic closure also suggest the incorporation of network information in the modeling ap-proach.
For this reason, we propose a new gravity model, called Dy-namicGravity, that brings together three fundamental as-pects for link prediction: network structure, mobility dynam-ics and geography. Formally, the model is defined as:
aij T X τ =1 ci(τ )+cj(τ )− d(i, j)β (11) withT = 168 and ci(τ )+ noting the out-strength of place
i, that is the sum of weights of all out-going edges, during hourτ . Equivalently, ci(τ )−accounts for the in-strength at
two places defined above. The model aims at capturing in a principled way the most important information signals in the data.
First, the importance of a place in the network in terms of its strength. Second the directionality of the edges gener-ated by a place given that places act as sources or sinks in the network. Third, the temporal dynamics and periodici-tiesof these forces as they fluctuate in time. Finally the po-tential connections between nodes driven by triadic closure. While these components favor connectivity between impor-tant nodes in the network (hubs), geographic distance acts in this context as a balancing factor and biases connectivity towards nearby places. This allows for the hubs to connect towards the plethora of low-degree nodes that are present all over the city and the mixed assortativity trends seen in Sec-tion 3 are also realized.
At this point, note that there is a possibility for two places not to share any common neighbors in the network. These places are still able to connect in the future. To accommodate this potential, we extend the original formulation of the Adamic-Adar [1] model to the formP
z∈Γi∩Γj
1
log(|Γz|) + 1.0. The unit value is added
to represent the connectivity of all nodes in the network towards an imaginary nodeimand thus model the possibility of all nodes
in the system to interact at the network level. Finally, note that when no information about time is available (T = 1), there are no common neighbors between two nodes(aij = 1) and there is no
information about edge directionality, the equation of the dynamic gravity model falls back to the setup of the original, static gravity model formalized in Equation 10.
4.3
Supervised learning methods
Supervised learning methods have been recently hypothesized to provide effective solutions to the link prediction problem [24], compared to unsupervised predictors such as those presented in the previous paragraphs. Supervised learning algorithms are aware of the class imbalance (ratio of positive and negative instances) in the system, and unlike their unsupervised counterparts, are able to op-erate across multiple differentiating class boundaries and capture the inter-dependency of many variables. Even if a single variable is considered (e.g. distance) and multiple decision boundaries exist, a supervised learning method can learn that more complex relation-ship. Finally, as more data flows in the system through time and more training labels become available, supervised learning models are only expected to improve in terms of accuracy.
Training methodology: We build a training dataset on the previous network snapshot, using positive and negative labels for connected pairs and disconnected pairs of nodes respectively. We have exper-imented both with a balanced and an imbalanced training dataset case where the class distribution is preserved, choosing the latter as it yielded better experimental results in all cases. For each pair of placesi and j, we construct input feature vectors xij formed
by all network and mobility features introduced in Paragraph 4.1. Here, we employ three classifiers: logistic regression [13] (applied with l2 regularization) and the ensemble learning methods random forests[6] (optimized here with50 trees of maximum depth 50) and gradient boosting [14] (with100 tree estimators of maximum depth10).
5.
EVALUATION
Experimental Setup
.
We assess the ranking performance of all models in the link prediction task by means of Area Under theCurve (AUC) score. To extract the Receiver Operating Character-istic (ROC) curve we measure the True Positive Rate versus False Positive Rate ratio for varying decision thresholds on the ranked list of pairs of places in each city. Then the AUC score is calculated by measuring the area under the ROC curve and it provides an indica-tion of the performance of an informaindica-tion signal in balancing the trade-off between precision and recall. A predictor that ranks place pairs randomly would yield a ROC curve matching the diagonal line,y = x, and hence an AUC score 0.5. We make use of a more informed baseline, named EdgeWeight, that simply ranks pairs of nodes according to the their edge weight in the previous tempo-ral snapshot (if an edge does not exist the score is0). We test the performance of all ranking strategies in a realistic temporal cross-validation setting by training on the first three months of 2013 and testing on the following temporal snapshot in the same year. We summarize the performance of all models in Table 2 showing their average score in terms of AUC and standard deviations across the one hundred cities in the dataset.
Results
.
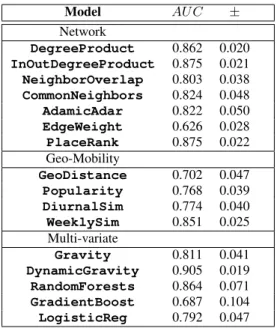
Focusing on the network models, we observe that the model which exploits edge directionality information of the nodes, InOutDegreeProduct, performs best with an AUC score0.875 improving predictability over the DegreeProduct that ignores di-rectionality (AUC=0.862) and scoring equally with the PageRank adaptation, PlaceRank. The former demonstrates that there are places in the network that tend to behave as sources or sinks by generating or absorbing mobility flows of users. The models that do the next best in terms of AUC performance are those based on common neighbors between places; {textbfCommonNeighbors scores AUC=0.824 and AdamicAdar attains a very similar score, AUC=0.822.We next evaluate the class of models that are built on geographic or mobility information about places. While geographic distance explains to some extent the connectivity between places and per-forms better than the naive predictor EdgeWeight, it is clearly be-ing outperformed by the Popularity predictor that captures the sig-nificance of places in the network in terms of how frequently they are visited by Foursquare users. Ranking performance improves further when the temporal visitation patterns of users at places is taken into account as the WeeklySim model suggests. As implied by the significant improvement (AUC=0.851 versus AUC 0.774) over DiurnalSim which employs information about diurnal mo-bility patterns only, the temporal synchronization between places across weekdays and weekends matters. Looking across all predic-tion methods, we note that the dynamic gravity model, Dynamic-Gravity, outperforms by a clear margin all models in the list. No-tably, it raises the performance of the classic gravity formulation by almost ten points (AUC=0.905 vs 0.811). This shows how the tem-poral dynamics of user mobility at places combined with informa-tion about the connectivity patterns and structure of the place net-work, formed by the trajectories of mobile users, can significantly improve predictability over mobility models that utilize solely static information. The dynamic version of the gravity model we present here essentially fuses the best information signals from the mobility and network classes above (InOutDegreeProduct, AdamicAdar and WeeklySim) as well as integrating geographic distance as a factor. It effectively captures the fact that places not only behave as sources or sinks in the network, but also that the way they adhere to these roles in the system changes dynamically over time. For example, one would expect a school, or a corporate office, to be a sink node in the morning, that becomes a source when it terminates operations later in the day. At the same time a transportation hub in
Model AU C ± Network DegreeProduct 0.862 0.020 InOutDegreeProduct 0.875 0.021 NeighborOverlap 0.803 0.038 CommonNeighbors 0.824 0.048 AdamicAdar 0.822 0.050 EdgeWeight 0.626 0.028 PlaceRank 0.875 0.022 Geo-Mobility GeoDistance 0.702 0.047 Popularity 0.768 0.039 DiurnalSim 0.774 0.040 WeeklySim 0.851 0.025 Multi-variate Gravity 0.811 0.041 DynamicGravity 0.905 0.019 RandomForests 0.864 0.071 GradientBoost 0.687 0.104 LogisticReg 0.792 0.047
Table 2: Mean AUC and standard deviation scores across cities for all features and models.
the area may follow an inverse pattern, being a source in the morn-ing and a sink in the evenmorn-ing, in accordance with local commuter mobility trends.
Finally, the model outperforms not only the static gravity version and all network and mobility models, but also supervised learning algorithms that have previously been shown to excel in link predic-tion in other domains [24]. Besides, the latter require special care in terms of training and parameter optimization. This can be costly in many realistic deployment scenarios that demand crisp and accu-rate responses, a frequent case in mobile application settings. The parameterβ in the case of the DynamicGravity model has been set equal to1 for all cities. Its simple formulation has allowed it to generalize well without overfitting in a very volatile network environment, where link formation can be influenced by seasonal drifts, changes in individual user mobility patterns or even large so-cial events that can alter the mobility flows of user populations in the urban domain [15].
6.
DISCUSSION AND RELATED WORK
In this work, we have investigated the properties of urban place networks formed by the check-in patterns of millions of Foursquare users across a large set of100 cities around the globe. We have shown that these networks exhibit many of the well-known prop-erties of other social technological networks, and that the growth patterns of these networks are characterized by a dynamic edge generation process over a relatively stable set of nodes.
Understanding the way venues interact in the urban domain by means of user mobility patterns can support existing applications and pave the way for new ones. The science of placing a new re-tail facility or venue, for instance, in an already established urban network of places would benefit from precise information about network connectivity in the local area and its underlying dynam-ics [17, 18]. Seeing cities as dynamically evolving networks is in line with recent works that propose the exploitation of network-based techniques to understand modern urban systems [4, 5, 3]
Using network analysis techniques to understand how cities grow and evolve may not be a novelty on its own, yet most research in this domain has focused on street network analysis [12, 33] or the analysis of transportation networks [35, 25]. The novelty of our approach is based on positioning real world places at the spotlight of network analysis using as input Foursquare’s venue database. While the network of places has been a fundamental element in re-lated works in location-based services, either for the detection of neighborhoods as in the case of the Livehoods project [11] or to perform venue recommendations [31], its properties have not been studied empirically in the past. In that respect the analysis we con-duct can benefit future works where the place network becomes important.
Our results have implications for the development of modern mobile applications too. The image of a highly volatile network in terms of the edge generation process in particular motivates the construction of link prediction models that can track their evolu-tion over time. Unlike in online social networks, such as Facebook, where the friendships being formed among users tend to persist across time, in place networks the majority of links are constantly evolving and often fleeting, existing only for a short time period. A better understanding of the mechanisms behind network evolu-tion is crucial in order to provide more intelligent locaevolu-tion-based services that can adapt to the ever-changing patterns of cities and offer more tailored recommendations and advertisements based on the user’s location and expected mobility patterns.
Acknowledgments
Anastasios Noulas acknowledges the support of EPSRC through Grant GALE (EP/K019392) and the Foursquare family for the great times in New York.
7.
REFERENCES
[1] L. Adamic and E. Adar. Friends and neighbors on the web. Social networks, 25(3):211–230, 2003.
[2] P. Bajardi, C. Poletto, J. Ramasco, M. Tizzoni, V. Colizza, and A. Vespignani. Human mobility networks, travel restrictions, and the global spread of 2009 h1n1 pandemic. PloS ONE, 6(1):e16591, 2011. [3] M. Batty, K. Axhausen, F. Giannotti, A. Pozdnoukhov, A. Bazzani,
M. Wachowicz, G. Ouzounis, and Y. Portugali. Smart cities of the future. The European Physical Journal Special Topics,
214(1):481–518, 2012.
[4] L. Bettencourt. The origins of scaling in cities. Science, 340(6139):1438–1441, 2013.
[5] L. Bettencourt, J. Lobo, D. Helbing, C. Kühnert, and G. West. Growth, innovation, scaling, and the pace of life in cities. Proceedings of the National Academy of Sciences, 104(17):7301–7306, 2007.
[6] L. Breiman. Random forests. Machine learning, 45(1):5–32, 2001. [7] D. Brockmann, L. Hufnagel, and T. Geisel. The scaling laws of
human travel. Nature, 439(7075):462–465, 2006.
[8] G. Carrothers. An historical review of the gravity and potential concepts of human interaction. Journal of the American Institute of Planners, 22(2):94–102, 1956.
[9] E. Cho, S.A. Myers, and J. Leskovec. Friendship and mobility: user movement in location-based social networks. In KDD’11. [10] A. Clauset, C. Rohilla Shalizi, and M. Newman. Power-law
distributions in empirical data. SIAM review, 51(4):661–703, 2009. [11] J. Cranshaw, R. Schwartz, J. Hong, and N. Sadeh. The livehoods
project: Utilizing social media to understand the dynamics of a city. In ICWSM’12.
[12] P. Crucitti, V. Latora, and S. Porta. Centrality measures in spatial networks of urban streets. Physical Review E, 73(3):036125, 2006. [13] R.-E. Fan, K.-W. Chang, C.-J. Hsieh, X.-R. Wang, and C.-J. Lin.
Liblinear: A library for large linear classification. The Journal of Machine Learning Research, 9:1871–1874, 2008.
[14] J. H. Friedman. Greedy function approximation: a gradient boosting machine. Annals of Statistics, pages 1189–1232, 2001.
[15] P. Georgiev, A. Noulas, and C. Mascolo. Where businesses thrive: Predicting the impact of the olympic games on local retailers through location-based services data. In ICWSM’14.
[16] M. González, C. Hidalgo, and A.-L. Barabási. Understanding individual human mobility patterns. Nature, 453(7196):779–782, 2008.
[17] P. Jensen. Network-based predictions of retail store commercial categories and optimal locations. Physical Review E, 74(3):035101, 2006.
[18] D. Karamshuk, A. Noulas, S. Scellato, V. Nicosia, and C. Mascolo. Geo-spotting: mining online location-based services for optimal retail store placement. In KDD’13.
[19] J. Kleinberg. Navigation in a small world. Proceedings of the National Academy of Sciences, 406:845–845, 2000.
[20] S.H. Lee and P. Holme. Exploring maps with greedy navigators. Physical Review Letters, 108(12):128701, 2012.
[21] J. Leskovec, J. Kleinberg, and C. Faloutsos. Graphs over time: densification laws, shrinking diameters and possible explanations. In KDD’05.
[22] D. Liben-Nowell and J. Kleinberg. The link-prediction problem for social networks. Journal of the American society for information science and technology, 58(7):1019–1031, 2007.
[23] D. Liben-Nowell, J. Novak, R. Kumar, P. Raghavan, and A. Tomkins. Geographic routing in social networks. Proceedings of the National Academy of Sciences, 102(33):11623–11628, 2005.
[24] R. N. Lichtenwalter, J. T. Lussier, and N. V. Chawla. New perspectives and methods in link prediction. In KDD’10. [25] R. Louf, C. Roth, and M. Barthelemy. Scaling in transportation
networks. PLoS ONE, 2014.
[26] C. Lucchese, R. Perego, F. Silvestri, H. Vahabi, and R. Venturini. How random walks can help tourism. In Advances in Information Retrieval, pages 195–206. 2012.
[27] A.P. Masucci, K. Stanilov, and M. Batty. Limited urban growth: London’s street network dynamics since the 18th century. PloS ONE, 8(8):e69469, 2013.
[28] M. Newman. Assortative mixing in networks. Physical review letters, 89(20):208701, 2002.
[29] J. H. Niedercorn and B. Bechdolt. An economic derivation of the gravity law of spatial interaction. Journal of Regional Science, 9(2):273–282, 1969.
[30] A. Noulas, S. Scellato, R. Lambiotte, M. Pontil, and C. Mascolo. A tale of many cities: universal patterns in human urban mobility. PloS ONE, 7(5):e37027, 2012.
[31] A. Noulas, S. Scellato, N. Lathia, and C. Mascolo. Mining user mobility features for next place prediction in location-based services. In ICDM’12.
[32] L. Page, S. Brin, R. Motwani, and T. Winograd. The pagerank citation ranking: Bringing order to the web. Stanford InfoLab, 1999. [33] S. Porta, P. Crucitti, and V. Latora. The network analysis of urban
streets: a dual approach. Physica A: Statistical Mechanics and its Applications, 369(2):853–866, 2006.
[34] E.G. Ravenstein. The laws of migration. Journal of the Statistical Society of London, pages 569–577, 1785.
[35] C. Roth, S. M. Kang, M. Batty, and Marc Barthélemy. Structure of urban movements: polycentric activity and entangled hierarchical flows. PloS one, 6(1):e15923, 2011.
[36] A. Sadilek, H. Kautz, and J. Bigham. Finding your friends and following them to where you are. In WSDM’12.
[37] S. Scellato, A. Noulas, R. Lambiotte, and C. Mascolo. Socio-spatial properties of online location-based social networks. In ICWSM’11. [38] S. Scellato, A. Noulas, and C. Mascolo. Exploiting place features in
link prediction on location-based social networks. In KDD’11. [39] F. Simini, M. González, A. Maritan, and A.-L. Barabási. A universal
model for mobility and migration patterns. Nature, 484(7392):96–100, 2012.
[40] D. Wang, D. Pedreschi, C. Song, F. Giannotti, and A.-L. Barabási. Human mobility, social ties, and link prediction. In KDD’11.
[41] The Next Web. Facebook passes 1.23 billion monthly active users, 945 million mobile users, and 757 million daily users.
http://goo.gl/11YL5e, 2014.
[42] R. West and J. Leskovec. Automatic versus human navigation in information networks. In ICWSM’12.
[43] R. West and J. Leskovec. Human wayfinding in information networks. In WWW’12.