HAL Id: hal-00662418
https://hal.archives-ouvertes.fr/hal-00662418
Preprint submitted on 24 Jan 2012
HAL is a multi-disciplinary open access
archive for the deposit and dissemination of
sci-entific research documents, whether they are
pub-lished or not. The documents may come from
teaching and research institutions in France or
abroad, or from public or private research centers.
L’archive ouverte pluridisciplinaire HAL, est
destinée au dépôt et à la diffusion de documents
scientifiques de niveau recherche, publiés ou non,
émanant des établissements d’enseignement et de
recherche français ou étrangers, des laboratoires
publics ou privés.
Evolution of pressure profiles during the discharge of a
silo
Christophe Perge, Maria Alejandra Aguirre, Paula Alejandra Gago, Luis
Pugnaloni, Denis Le Tourneau, Jean-Christophe Géminard
To cite this version:
Christophe Perge, Maria Alejandra Aguirre, Paula Alejandra Gago, Luis Pugnaloni, Denis Le
Tourneau, et al.. Evolution of pressure profiles during the discharge of a silo. 2012. �hal-00662418�
Christophe Perge1, Mar´ıa Alejandra Aguirre2,3, Paula Alejandra Gago4,
Luis. A. Pugnaloni4, Denis Le Tourneau1 and Jean-Christophe G´eminard1
1Universit´e de Lyon, Laboratoire de Physique, Ecole Normale Sup´erieure de Lyon, CNRS, 46 All´ee d’Italie, 69364 Lyon cedex 07, France.
2Grupo de Medios Porosos, Fac. de Ingenier´ıa, Universidad de Buenos Aires. Paseo Col´on 850, (C1063ACV) Buenos Aires, Argentina.
3 LIA PMF-FMF (Franco-Argentinian International Associated Laboratory in the Physics and Mechanics of Fluids), Argentina - France.
4Instituto de F´ısica de L´ıquidos y Sistemas Biol´ogicos (UNLP, CONICET La Plata), Calle 59 Nro. 789, 1900, La Plata, Argentina.
We report measurements of the pressure profile in the outlet plane of a discharging silo. We observe that, whatever the preparation of the granular system, a dynamic Janssen effect is at play: the apparent mass of the grains, i.e. the part of their mass sustained by the base, is significantly smaller than their actual mass because of the redirection of the weight to the lateral wall of the container. The pressure profiles reveal a significant decrease of the pressure in the vicinity of the outlet as the system discharges whereas the flow-rate remains constant. The measurements are thus a direct experimental proof that the flow-rates of granular material through an aperture are not controlled by the local stress conditions.
PACS numbers: 45.70.-n, 45.70.Mg, 47.80.Fg
I. INTRODUCTION AND BACKGROUND
Granular flows through apertures have been intensely studied [1–12] due to their practical importance to several industries (e.g. pharmaceutical, mining, agriculture) and disciplines (e.g. chemistry, physics, engineering).
Depending on the size of the outlet relative to the size of the grains three regimes can be observed for the dis-charge of a silo through an orifice: a continuous flow, an intermittent flow, or a complete blockage of the system due to arching [13–15]. In the continuous-flow regime, generally observed for large outlets, the mass flow rate, W , is known to scale as A5/2, where A denotes the
di-ameter of the aperture. This scaling is generally known as the Beverloo law [2, 16]:
W = Cρ√g(A − kd)5/2 (1)
where ρ stands for the bulk density of the granular sam-ple, g the acceleration of gravity and d the diameter of the grains. The parameters k and C are empirical di-mensionless constants of order one. The constant k ac-counts for the presence, at the periphery of the outlet, of a boundary layer which, in practice, reduces its effec-tive diameter (the so-called empty annulus [17]). The thickness of the latter boundary layer is of about the grain size d. Therefore, one accounts for the flow-rate W considering, instead of A, the effective diameter A − kd (Eq. 1). Experimentally, k has been found to be inde-pendent of the particle size and to take values between 1 and 3, depending on the particle and container properties [18]. The Beverloo scaling is in good agreement with the experimental observations even if, for instance, Mankoc et al. introduced an exponential correction to improve the agreement between the empirical law and the exper-imental flow-rates [13]. From Eq. (1), W is expected to
vanish when A is smaller than a critical value A0≡ kd.
In practice, when A is close to A0, the system is likely
to jam. In this regime, which is out of the scope of the present article, the jamming probability has been shown to be mainly controlled by the ratio A/d [14, 15, 19–22]. Interestingly, in accordance with the experimental ob-servations, the flow rate W given by the Beverloo law does not depend on the height, Hg, of granular
mate-rial above the outlet. This behavior differs qualitatively from the one observed for the discharge of a container filled with a viscous liquid during which the mass flow-rate depends linearly on Hg. The explanation most
fre-quently used for this independence is based on the so-called Janssen effect: friction redirects the weight of the material onto the lateral wall of the silo, which leads to a saturation of the pressure at the bottom of the container, in the outlet region [23, 24]. Therefore, since the pressure at the outlet does not depend on Hg, the flow rate is also
independent of Hg [25]. Note that such conclusion
im-plicitly assumes that the pressure governs the flow rate as it does in viscous fluids. However, in a horizontal configuration, it was recently proven that the above ar-gument is improper [26, 27]. Indeed, different flow-rates were achieved for the same bottom pressure and, inde-pendently, the flow rate was observed to be constant even while the pressure near the outlet decreased during the discharge.
Concerning the pressure inside a silo, the mentioned Janssen effect is known to have been previously observed by Hagen in 1852 [1, 12], as stated by Janssen in 1895 [23, 28] when he attempted to quantify it. Some recent works report measurements of the pressure at the bot-tom of closed containers, i.e. in static conditions [29–32]. Note however, that even if the Janssen effect has been observed to be at work also in some dynamical
situa-2 tions [33], the conditions of applicability are not
neces-sarily fulfilled during the discharge of a silo. Few groups have experimentally or numerically studied flow rates and stress variations during the discharge of vertical contain-ers. Pacheco-Martinez et al. [34] studied the discharge of a silo while its walls were shaken at different frequen-cies and amplitudes, therefore creating different stress conditions inside the container. They measured a con-stant flow rate and, failing to find any other reason, they accounted for their observation by assuming that upon discharge a screening effect is recovered (i.e., a dynamic Janssen effect).
In addition, Ahn et al. [35] measured the flow rate and the total pressure at the bottom of a hopper. Different granular column heights in the tube were associated with different values of the normal stress (pressure) at the bot-tom. They identified three regimes: unchocked, transi-tional, and chocked regimes. In the chocked regime, they observed that the flow rate is constant, given by Beverloo law, even when the average normal stress at the bottom decreases during the discharge. One could conclude that the flow rate is independent of pressure. However, only the average normal stress in the outlet plane is measured and one also could argue that the flow-rate could rather depend on the local stress near the outlet. There is thus a need for a study of the stress profile in the outlet plane. In the present article, we report on the discharge of a silo filled with a dense packing of polydisperse glass spheres. In particular, we simultaneously measure the flow rate, the vertical forces exerted by the material on the lateral wall and the vertical stress profile in the outlet plane.
II. EXPERIMENTAL TECHNIQUES
A. Experimental setup
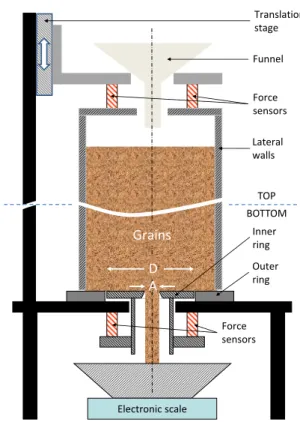
The experimental setup is a vertical silo consisting of two mechanically independent parts: the lateral wall and the outlet plane (Fig. 1).
The lateral wall consists of a vertical cylinder (Plexi-glas, internal diameter Dc = 51.1 mm and total height
H = 80 cm). The vertical force necessary to sustain the cylinder is measured by means of two sensors (Testwell, KD40S/50N) which hold it from the top. The force mea-surements are made to within 0.01 N in the range 0 to 100 N. The force sensors are attached to a translation stage (Newport, UMR5.16), which permits the adjust-ment of the vertical position of the cylinder to within 5 µm.
The outlet plane is designed to measure the profile of the vertical force applied to it. It consists of an outer ring sustained by a fixed table and an inner ring supported by two force sensors (Testwell, KD40S/10N) which mea-sure the vertical force applied to it to within 0.01 N in the range 0 to 20 N. The external diameter (60 mm) of the outer ring is larger than the internal diameter of the
Electronic scale Force sensors Inner ring Outer ring Lateral walls Force sensors TOP BOTTOM Funnel Translation stage A D Grains
FIG. 1. Experimental setup – The experimental device is a silo consisting of two mechanically independent parts: a lateral wall made of an acrylic cylinder and an outlet plane constituted of a pair of rings. A first pair of sensors measures the total vertical force applied to the lateral wall. A second pair of sensors measures the vertical force applied to the inner ring at the bottom. The outer ring is added to insure a flat bottom surface. A displacement stage is used to avoid the mechanical contact between the lateral wall and the outlet plane, to tune the gap between the two parts and to mobilize the friction at the wall. The mass of the grains flowing out of the silo is measured by means of an electronic scale.
cylinder above. The inner ring fits in the outer ring and the gap between the two parts is about 200 µm so as to insure that they are not in mechanical contact. We denote D the external diameter of the inner ring. The vertical position of the rings is adjusted so that their upper surfaces are in the same horizontal plane; the out-let plane. In addition, the rings are covered with a thin (50 µm) polymeric film which insures that, without intro-ducing any significant mechanical coupling between the rings, the grains do not fall in the gap. A conical aper-ture (the outlet) is pierced at the center of the inner ring and we denote A its diameter in the outlet plane. We used two aperture diameters: A = 5 mm or A = 10 mm. Thus, in this configuration, the sensors at the bottom
measure the vertical force applied over a surface area S = π(D2
− A2)/4 of the bottom surface. In addition, in
order to obtain the force profile, we used two sets of ring pairs (inner and outer ring) presenting 9 equally-spaced values Sn (n ranging from 1 to 9) of the surface area S,
from the 11% to 96% of the surface area of the silo cross-section. Each set is complemented with a disk of external diameter 60 mm which allows measurements of 100% of the force applied to the outlet plane (S10).
A plug (a cylinder of diameter slightly smaller than A held by a clamp) is used to initially close the outlet. Again, the mechanical contact between the inner ring and the plug is insured by a sufficient gap between the me-chanical parts. The clamp is designed in order to release the plug which then falls without perturbing the force measurements.
Once the system is open, the grains fall in a container and the mass M (t) of grains in the container at time t is measured by means of an electronic scale (Kern, 440-51N) to within 1 g at 1 Hz.
The granular material consists of a total mass MT =
2 kg of polydisperse glass bead (Matrasur Corp., sodosil-icate glass, ρg = 2200 kg m−3). We used three different
samples corresponding to diameters d ∈ [150−250], [250− 425] and [425, 600] µm. The measured bulk density of all samples is about ρ ≃ 1500 kg m−3, i.e., a packing fraction
of about 0.68.
B. Setting of the lateral wall position
Before any experimental run, the empty system is ad-justed in order to avoid the contact between the vertical wall and the outlet plane. To do so, thanks to the trans-lation stage at the top, the vertical wall is approached to the outlet plane while the force from the upper sensors is monitored. A significant change in the force is measured when the two parts enter in contact. When the system is filled with grains, the lateral wall is slightly displaced downwards because of the associated vertical force. Due to the stiffness of the sensors, a force of 100 N induces a displacement of about 50 µm. Thus, in order to avoid the contact between the two parts without allowing the grains to enter the gap, the cylinder is lifted by 150 µm before the filling.
Then, a mass MT of grains is gently poured from the
top by means of a centered funnel. Once filled, the total height of the granular column is about Hg≃ 66 cm.
C. Mobilization of the friction at the lateral wall
In order to check that the experimental system gives reliable measurements of the vertical forces applied to the lateral wall and to the bottom, we measure, using the largest disk (S10, external radius 60 mm, aperture
A = 10 mm), the total force exerted by the grains on the base plane. 2500 2000 1500 1000 500 0 Mapp. , M wall (g) 400 300 200 100 0 t (s) Mobilization Filling Discharge
FIG. 2. Mobilization of the friction at the lateral wall – An experimental run consists in 2 or 3 independent steps: the filling, the (optional) mobilization and the discharge. We re-port measurements of the vertical forces applied to the lateral wall and to the outlet plane, in terms of the equivalent masses Mwall(grey line) and Mapp.(black line), respectively. During the filling at constant flow rate, we observe an almost lin-ear increase of the forces Mwalland Mapp.. We check that the sum Mwall+ Mapp.indeed equals the mass of grains inside the silo, Min (dashed line). After the filling, the apparent mass Mapp.measured at the base is of about 1/3 of the total mass MT≃2000 g of grains inside the container. If the discharge is initiated starting from the latter initial conditions we say that the results correspond to a “Partial mobilization”. How-ever, previous to the discharge, supplemental mobilization of the friction at the lateral wall can be achieved by lifting the outer cylinder thanks to the translation stage (In the present example, each plateau corresponds to a step by 10 µm). The apparent mass Mapp.decreases toward an asymptotic value of about 80 g. In this case, we refer to the “Full mobilization”. Note that Mwallincreases such that Mwall+ Mapp.is constant to within the precision of the measurements (dashed line). Fi-nally, during the discharge, a dynamic Janssen effect is clearly at play. Indeed, Mapp. remains almost constant whereas the remaining part of the grain weight is redirected to the wall (d = 250 − 425 µm, A = 10 mm, “Full mobilization”).
In Fig. 2, we report the temporal evolution of the ver-tical force exerted to the lateral wall and to the bottom. The results are reported in terms of the apparent mass at the bottom, Mapp., and of the mass of grains sustained
by the lateral wall, Mwall. We consider three phases: the
filling, the mobilization, and the discharge.
First, we report Mapp. and Mwall while the system is
filled at constant flow-rate with grains (diameter 250 − −425 µm) from the funnel at the top. During the fill-ingof the system, we observe a partial redirection of the vertical force onto the lateral wall: Mwall (grey line)
in-creases continuously with time. In accordance, Mapp.
(black line) is less than the total mass inside the system, Min. The mass Min is approximately equal to the sum
Mwall+ Mapp.. We point out that the bottom disk does
not exactly measure the total mass at the bottom as a part of the grains are sustained by the plug of diameter 10 mm at the center (for a total diameter of 51 mm). We thus estimate that Mapp.underestimates the
4 250 200 150 100 50 0 Mapp. (g) 600 500 400 300 200 100 0 MT (g)
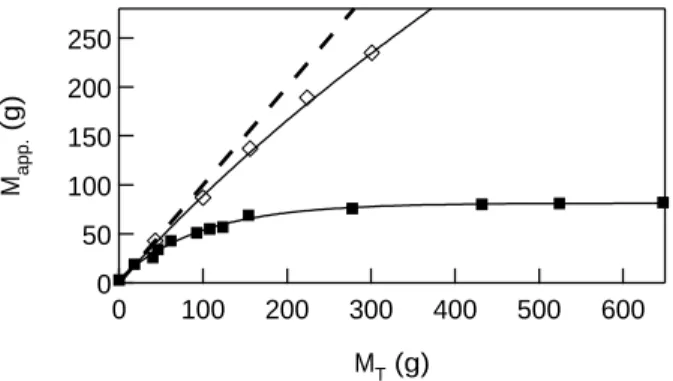
FIG. 3. Static Janssen effect – We report the apparent mass Mapp. measured at the base of the silo as a function of MT, the total mass of grains inside. For the partial mobi-lization (open diamonds), Mapp.is only slightly smaller than MT (dashed line). For the full mobilization (full squares), Mapp.saturates to Mapp.sat = 81 g when the height of the gran-ular column, Hg, exceeds the container radius Dc/2, which corresponds to MT≫MTc ≃97 g (d = 125 − 250 µm).
that Minincreases linearly with time in accordance with
the constant filling rate (Fig. 2, Filling). At the end of the filling phase, Min = MT ≃ 2000 g, the total mass
of grains in the system, and Mapp.≃ 0.4 MT. We shall
refer to this first, reproducible, state as the “partially mobilized” state of the system.
Supplemental redirection of the vertical force to the lateral wall can be achieved by gently lifting, step by step, the cylinder by means of the translation stage at the top (Fig. 2, Mobilization). We observe, while lifting the lateral wall by steps of 10 µm, that Mapp. decreases
toward an asymptotic value of about 80 g. In accordance, Mwallincreases such that the sum Mapp.+ Mwallremains
constant and equal to MT. The saturation is obtained
for a total displacement of about 100 µm, such that the final gap between the vertical wall and the base plane is sufficiently small (about 250 µm) to prevent the grains to escape the system. We shall refer to this second, re-producible, state as the “fully mobilized” state of the system.
In order to better characterize the static Janssen effect in our experimental system, we repeated the experiment changing the total mass MTand measuring the apparent
mass Mapp. corresponding to the partial and full
mobi-lization conditions (Fig. 3). As already mentioned, dur-ing the filldur-ing process, in absence of supplemental mobi-lization, the apparent mass Mapp.does not saturate even
for MT as large as 2000 g, corresponding to heights of
the granular column, Hg, as large as 66 cm (more than
10 times the container diameter. From the curvature of the experimental curve, we rougly estimate a saturation height of about 150 cm which is not accessible with our experimental device). Therefore, the partial mobiliza-tion only leads to Mapp. slightly smaller than MT. By
contrast, the full mobilization of friction leads to a satu-ration of Mapp.at a value of about Mapp.sat = 81 g, reached
exponentially for a characteristic mass Mc
T= 97 g which
corresponds to a static screening length λstat.≃ 35 mm.
Note that, as expected, λstat. is of the order of the
con-tainer radius Dc/2 = 25.5 mm.
Finally, when the plug is released, one observes a sud-den decrease in Mwall and a sudden increase in Mapp.
(Fig. 2, Discharge). Then, during the discharge, a partial redirection of the vertical force to the lateral wall is ob-served. Indeed, Mwalldoes not drop to zero. On the
con-trary; Mwalland Mapp.continuously decrease in a more or
less complex pattern, depending on the initial mobiliza-tion of fricmobiliza-tion, whereas the sum Mwall+ Mapp.decreases
linearly throughout the entire discharge, whatever the initial condition. In the next sections, we shall discuss in detail the results obtained during the discharge.
III. EXPERIMENTAL RESULTS
A. Mass flow-rate
First, whatever the preparation of the system, the mass flow-rate W obeys Beverloo law; throughout the dis-charge, even during the early stages, W is independent of the height Hgof the granular column and is given by
Eq. (1) with k ≃ 3 and C = 0.73 ± 0.02 (Fig. 4).
2 1 0 M (kg) 80 40 0 t (s) 30 20 10 0 W (g/s) 10 8 6 4 2 0 A - k d (mm) d = (150-250) µm d = (250-425) µm d = (425-600) µm
FIG. 4. Beverloo law – Mass flow rate W as a function of the diameter of the orifice corrected by kd due to the “empty annulus”. The granular flow is observed to obey the Beverloo law (dashed line from Eq. 1) with k ≃ 3 and C ≃ 0.73 ± 0.02 for the two aperture sizes and all the different grain sizes we considered (Partial mobilization – To within the experimental accuracy, W is the same for the full mobilization). Inset: Temporal evolution of the mass of grains, M , deposited in the scale (d = 250 − 425 µm, A = 10 mm).
B. Dynamic Janssen effect
In the previous section, we observed that the mass flow-rate W is independent of the preparation of the system, obeys the Beverloo law and, thus, is constant throughout the discharge.
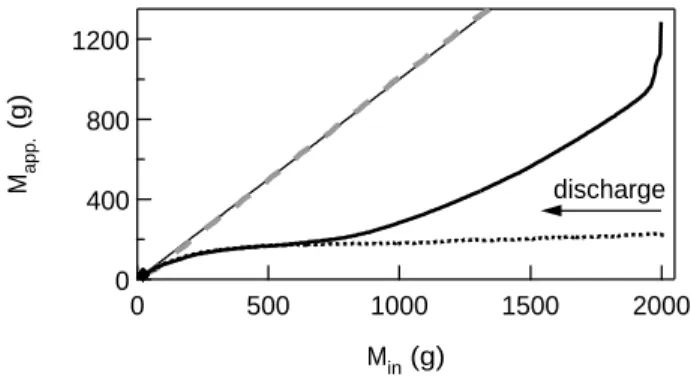
In Fig. 5, we report Mapp. as a function of Min =
MT− M (t), calculated as the difference between the
ini-tial total mass of grains, MT, and the mass of grains
deposited in the scale, M (t). We observe that Mapp.(t)
depends drastically on the initial redirection of the force to the lateral wall.
When the full mobilization of friction is previously achieved in statics, Mapp.is almost constant throughout
the subsequent discharge, as long as the grains height Hg
is large in comparison with the container diameter Dc. In
order to get convinced of the efficiency of the screening ef-fect, one can notice that a decrease in Minfrom 2 to 1 kg
induces a decrease of Mapp. from 221 g to 182 g. The
relative change in Mapp. is of the order of 20%, which
might be considered as important even if associated to a change by a factor 2 in the inner mass, Min. However,
one must rather consider that only 40 g of 1 kg, thus only 4% of the corresponding weight, are transmitted to the bottom. Thus, even if Mapp.slightly decreases with Hg,
a strong screening effect is at play and Mapp. saturates
to a maximum value of about Msat.
app.∼ 200 g, consistent
with the dynamic screening length λdyn. ∼ 70 mm. A
clear dynamic Janssen effect is observed.
1200 800 400 0 Mapp. (g) 2000 1500 1000 500 0 Min (g) discharge
FIG. 5. Dynamic Janssen effect – We report the apparent mass Mapp. measured at the base of the silo as a function of Min, the mass of grains inside during the discharge. For the full mobilization (dotted line), Mapp. is almost constant dur-ing the discharge, except when the height Hg of the granular column is of the order of or smaller than the silo diameter, Dc. We thus observe a clear dynamic Janssen effect and es-timate the screening length λdyn.∼70 mm (equivalent mass Min≃200 g). For the partial mobilization (continuous line), Mapp. continuously decreases from its initial value towards the value measured in the case of the full mobilization. In addition, we report Mapp.+ Mwall (grey dashed line) during the discharge and observe, at all time, a good agreement (to within 20 g) with the mass Min (thin black line) of grains in the container (A = 5 mm, d = 250 − 425 µm).
In absence of supplemental mobilization of the friction (partial mobilization), Mapp.continuously decreases from
its initial value until it reaches, and follows, the same ap-parent mass measured in the case of full mobilization. Thus, even if the full mobilization is not previously im-posed, the discharge itself will eventually mobilize the friction at the wall. One might have expected that such
flow-induced mobilization should occur in a short frac-tion of time rather than require the discharge of a large portion of the granular material. We shall see in the fol-lowing sections that such fast flow-induced mobilization actually occurs in the bulk of the granular column. The slow mobilization during discharge described here is due to a layer of grains aligned against the lateral wall that presents a distinct behavior.
Whatever the initial condition, the apparent mass Mapp. decreases when the grain height Hg is smaller
than λdyn.. When the discharge process ends, a stagnant
crater of mass Min= 23 g is left around the outlet.
In conclusion, during the discharge, in spite of the grain flow, the partially mobilized system keeps memory of the preparation. However, this memory is eventually lost after some material is discharged and the sample eventu-ally follows the apparent mass of a fully mobilized bed. Besides, whatever the preparation of the system, a dy-namic Janssen effect is observed with a screening length λdyn.∼ 2λstat..
C. Pressure profile
In this section, we report measurements of the pres-sure profile on the outlet plane, during the discharge process. An outlet diameter A = 5 mm is used in all the experiments but we note already that similar results are obtained with the larger aperture. We shall report separately the results obtained for the full mobilization (Sec. III C 1) and the partial mobilization (Sec. III C 2).
We use various pairs of inner and outer rings at the bottom to measure the force exerted on different surface areas, Sn, around the outlet during the discharge. We
point out that the measurements correspond, for each surface area, to an independent discharge. In order to check the reproducibility of the results, each experiment is repeated 5 times.
1. Full mobilization of the friction
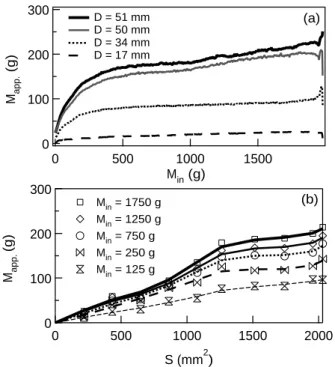
We first consider measurements obtained during the discharge after the full mobilization of the friction at the lateral wall. The measurements are reported in terms of the equivalent mass, Mn, associated with the surface
area Sn, as a function of the mass of grains inside the
container, Min (Fig. 6a). Note that for all the Sn (or
equivalently for all external diameter Dn of the inner
ring), the effective mass Mnexhibits the same qualitative
behavior with time (or equivalently with Min). In spite
of a slight decrease with Min, the vertical force on the
outlet plane is fairly constant as long as the height of the height Hg of the material above the outlet is much larger
than λdyn.(or equivalently Min≫ Mapp.sat. ∼ 200 g). The
apparent mass Mn as a function of S for a given mass
6 300 200 100 0 Mapp. (g) 2000 1500 1000 500 0 S (mm2) Min = 1750 g Min = 1250 g Min = 750 g Min = 250 g Min = 125 g 300 200 100 0 Mapp. (g) 1500 1000 500 0 Min (g) D = 51 mm D = 50 mm D = 34 mm D = 17 mm (a) (b)
FIG. 6. Full mobilization: apparent mass Mapp.during the discharge – (a) Apparent mass Mapp. vs. inner mass Min for various disk diameters D. (b) Apparent mass Mapp. vs. surface area S for various inner mass Min, or equivalently at different times t (A = 5 mm, d = 250 − 425 µm).
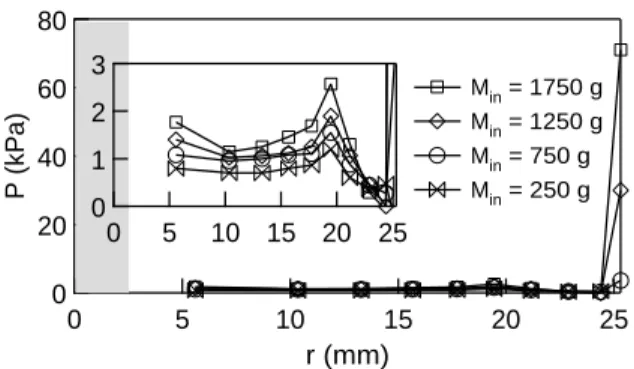
From the results reported in Fig. 6b, one can easily estimate the pressure profile, P (r), in the outlet plane. Indeed, P (r) = (Mn− Mn−1)g/(Sn− Sn−1) corresponds
to the pressure at a distance r = (Dn−Dn−1)/4 from the
center of the aperture (Dn stands here for the external
diameter of the disk having a surface area Sn). The
ex-perimental profiles (Fig. 7) show a smooth dependence of the pressure on r. The pressure P exhibits a clear peak at r ≃ 18 mm and a minimum at r ∼ 23 mm, i.e., 1 or 2 mm away from the wall. Note that the minimum at the center is clearly reminiscent of the pressure profile at the base of a static granular pile [30].
2. Partial mobilization of the friction
Let us now consider measurements obtained in the case of a partial mobilization of the friction at the lateral wall. With the same experimental techniques, we report Mnas
a function of Min (Fig. 8). In this later case, the most
striking result is the peculiar behavior of the mass mea-sured with the largest disk (D = 51 mm) whereas the other diameters lead to measurements similar to those previously obtained for the full mobilization (Fig. 6a). We point out that each mass Mnexhibits an initial value
larger than previously measured for the full mobilization. However, all Mn, excepted M10which is associated with
the larger disk, rapidly decrease at the beginning of the
3 2 1 0 P (kPa) 25 20 15 10 5 0 r (mm) Min = 1750 g Min = 1250 g Min = 750 g Min = 250 g Min = 125 g
FIG. 7. Full mobilization: pressure profile P (r) during the discharge– The grey region at the center indicates the outlet (A = 5 mm, d = 250 − 425 µm).
discharge (Min.MT), and exhibit a subsequent
tempo-ral evolution similar to that previously observed for the full mobilization. Only the apparent mass Mapp.= M10
exhibits a peculiar behavior.
1200 800 400 0 Mapp. (g) 1500 1000 500 0 Min (g) D = 51 mm D = 50 mm D = 34 mm D = 17 mm
FIG. 8. Partial mobilization: apparent mass Mapp. dur-ing the discharge– Apparent mass Mapp. vs. inner mass Min for various disk diameters D. Note the large difference between the results obtained for D = 50 mm and D = 51 mm (A = 5 mm, d = 250 − 425 µm).
It is then particularly interesting to consider the pres-sure profile P (r) (Fig. 9). The prespres-sure P (r) exhibits a large value, initially of about 100 kPa, close to the lat-eral wall, whereas the average pressure is of the order of 1 kPa. Apart from the large pressure measured at the periphery of the silo base, the measured pressure profile is very similar to the one obtained for the full mobiliza-tion (Fig. 9, inset). Thus, the difference in the apparent mass between the two experimental conditions (the par-tial and the full mobilization) is mainly due to a drastic change of the pressure, in the outlet plane, in the vicin-ity of the lateral wall. In the next section IV, we shall discuss further the latter experimental observation.
80 60 40 20 0 P (kPa) 25 20 15 10 5 0 r (mm) Min = 1750 g Min = 1250 g Min = 750 g Min = 250 g 3 2 1 0 25 20 15 10 5 0
FIG. 9. Partial mobilization: pressure profile P (r) dur-ing the discharge – Note the large pressure at the periph-ery of the base plane, at r ≃ 25 mm. The grey region at the center indicates the outlet. Inset: An enlarged view of the pressure profile to highlight the behavior away from the wall (A = 5 mm, d = 250 − 425 µm).
IV. DISCUSSION
Let us first comment on the difference between the pressure profiles measured for the full or partial mobi-lization of the friction previous to the discharge. Instead of the pressure, it is pertinent to consider the mass Mn
as a function of Sn (Fig. 8). One observes, from the
dif-ference between the measurements provided by the two largest disks, that a large mass of the grains is initially sustained by a small region of the outlet plane, close to the lateral wall. In what follows, the latter region shall be referred to as the “periphery”.
For Min = 1750 g, the periphery sustains a mass of
about 600 g (i.e., about 1/3 of the mass of the granular material in the container). Considering the diameter of the inner wall (i.e. 51 mm) and the diameter of the disk S9 (D9 = 50 mm), one assesses that the width of the
periphery is smaller than 0.5 mm (thus of the order of the typical grain size). It is then pertinent to consider the mass M9, i.e., the mass sustained by the bottom plane,
the periphery excepted. We observe that M9 is fairly
constant during the discharge (Fig. 8, D = 50 mm) from which we conclude that the decrease in the apparent mass Mapp.(Fig. 5) is mainly due to the decrease of the mass
sustained by the periphery. Thus, one can conclude that the redirection of the weight is such that the outlet plane, excepted a peripheral region having a typical width of the order of the grain size, only sustains the mass of the grains located in a region of height λdyn. above the
outlet. The remaining mass of grains inside the container is sustained by the lateral wall or by the periphery of the base.
The large apparent mass on the periphery of the base can be explained by the vertical alignment of the grains due to the presence of the smooth wall. During filling, grains that reach the wall, as they flow along the free surface of the growing column, tend to lay most of their
weight on the grains just below that are also touching the wall. This creates a rather stable layer of grains all along the wall that redirects the weight of adjacent grains in the bulk preferentially towards the negative vertical di-rection. Therefore, the wall itself carries little weight unless mobilization is forced by lifting the wall. A large proportion of the weight is transmitted by the layer ad-jacent to the wall directly to the base. During discharge, such layer is expected to destabilize. However, it takes a large proportion of the discharge for the base periphery to adjust to the apparent mass of a mobilized condition (Fig. 9).
In order to better understand the slow progressive mo-bilization of the friction and the granular flow inside the container, we measured the grain velocity at the lateral wall. The granular column is imaged from the side and the velocity profile is obtained by image correlation. The results indicate that the granular flow at the wall starts at the top of the granular column. During the discharge, a front separating an upper region, in which the grains slide at the wall, and a lower region, in which no sliding of the grains is observed, propagates downwards (Fig. 10). The position of the front rapidly tends to an asymptotic position, which corresponds to the final height (typically 20 mm) of the pile left around the outlet at the end of the discharge. The mobilization of the friction at the wall is associated with the propagation of the latter front. In addition, by observing the system from the bottom (we used a transparent base in this case), we checked that the grains do not slide in the base plane, at least at a distance smaller than 5 mm from the outlet.
1.0 0.0 vz (mm/s) 50 40 30 20 10 0 h (mm) 80 60 40 20 0 t (s) 50 40 30 20 10 0 z (mm)
FIG. 10. Grain velocity at the wall – Left: Schematic view of the stream lines during a discharge. Center: Schematic profile of the grain velocity at the wall, vz(z), at a given time t. Right: Vertical position of the front z above the outlet plane as a function of time t. The front reaches an steady value in about 60 s whereas, in the given experimental conditions, the flow-rate W = 3 g/s is such that discharge lasts about 600 s (A = 5 mm, d = 250 − 425 µm).
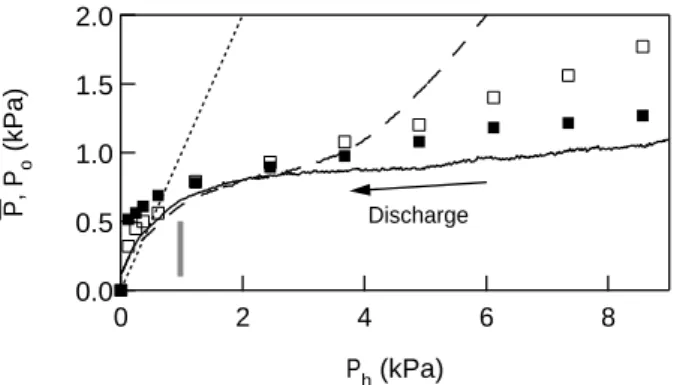
Finally, let us comment on the relation between the flow rate and the pressure in the outlet region. We can first report, from the apparent mass Mapp., the
aver-age pressure P in the outlet plane during the discharge (Fig. 11). Considering the entire discharge, including data obtained for a height Hgof granular material smaller
8 than the screening length λdyn., we observe a change in
the average pressure P by at least a factor 2 for the full mobilization. The change is even larger for the partial mobilization. However, all the data reported here are associated with a constant flow rate W since we have re-moved the last few seconds of the discharge from Fig. 11 where the flow rate falls and vanishes. These observa-tions are compatible with the results previously reported by Ahn et al [35] and with measurements obtained in a horizontal configuration [26, 27]. The authors concluded that the flow-rate is independent of the pressure at the bottom of the container.
One could argue that W should depend on the pres-sure in the outlet region and not on the average prespres-sure in the outlet plane, above identified with the average ver-tical stress in the outlet plane. From the experimental pressure profiles (Figs. 7 and 9), we can estimate the ver-tical stress near the outlet, Po, by considering the closest
point, corresponding to r ≃ 5 mm and thus to a dis-tance of about 2.5 mm from the outlet (Fig. 11). Note first that, as expected, the local stresses estimated for the partial and full mobilization are similar. Again, we observe that a decrease of at least a factor 2 in Po (We
remind here that the height Hg of granular material is
not necessarily larger than the screening length λdyn.),
without any significant change in W . Assuming that the vertical component of the stress in the outlet region is a correct estimate of the local pressure in a typical volume A3 around the outlet, which is likely because of the
flu-idization of the material in the latter region, we conclude that the flow rate is not controlled by the local pressure in the outlet region.
V. CONCLUSION
We reported measurements of the pressure profile on the flat base of a discharging silo.
We observed first that the dynamics of the mass sus-tained by the base is largely altered by the preparation of the system. When the friction at the lateral wall is previously mobilized, the apparent mass is fairly con-stant during the discharge whereas the apparent mass significantly decreases in the case of a partial mobiliza-tion. However, the system looses memory of the initial condition during the discharge because the sliding of the
grains at the lateral wall leads to a flow-induced mobi-lization of the friction. The velocity profile at the lateral wall sustains the latter conclusion.
It was already known that the flow rate does not de-pend on the apparent mass, i.e., on the average pressure in the outlet plane. Our measurements indicate that the flow rate does not depend on the local pressure in the outlet region, identified with the vertical local stress in the outlet plane. We can conclude that the granular flow is not controlled by the local stress conditions.
In conclusion, the physical origin of the Beverloo law 2.0 1.5 1.0 0.5 0.0 P, P o (kPa) 8 6 4 2 0 Ph (kPa) Discharge
FIG. 11. Pressures P and Po vs. pressure Ph – The average pressure in the outlet plane, P (lines), and the pres-sure in the vicinity of the outlet, Po (symbols), are reported as functions of the hydrostatic pressure, Ph (the weight of the granular matter inside divided by the surface area of the base). The average pressures P for partial- (dashed line) and full-mobilization (continuous line) differ significantly. In con-trast, the pressure in the vicinity of the outlet is not drasti-cally altered by the preparation of the system. Whatever the preparation, partial- (open squares) or full-mobilization (full squares), the pressure near the outlet decreases by at least a factor 2 whereas the flow-rate remains constant during the whole discharge. The vertical grey dash points the pressure at the screening length (A = 5 mm, d = 250 − 425 µm).
remains unclear and still requires additional efforts to be elucidated.
ACKNOWLEDGMENTS
This work has been supported by the program PICT 32888 (ANPCyT), I 006 (UBA) and the International Cooperation Program CONICET-CNRS. L. A. P. and M. A. A. acknowledge support from CONICET.
[1] G.H.L. Hagen, Poggendorffs Ann. Phys.Chem. 46, 423 (1839).
[2] W. A. Beverloo, H. A. Leninger and J. van de Valde, Chem. Eng. Sci. 15, 260 (1961).
[3] L. P. Kadanoff, Rev. Mod. Phys. 71, 435 (1999). [4] P. G. de Gennes, Rev. Mod. Phys. 71, S374 (1999).
[5] V. Trappe, V. Prasad, L. Cipelletti, P. N. Serge and D. A. Weitz, Nature (London) 411, 772 (2001).
[6] H. M. Jaeger, S. R. Nagel and R. P.Behringer, Rev. Mod. Phys. 68, 1259 (1996).
[7] J. Duran, Sands, Powders and Grains, Springer, New York, (2000).
[8] G. H. Ristow, Pattern Formation in Granular Materials, Springer, New York, (2000).
[9] R. M. Nedderman, U. T¨uz¨un, S.B. Savage and G.T. Houlsby, J. Chem. Eng. Sci. 37, 1597-1609 (1982). [10] U. T¨uz¨un, G. T. Houlsby, R. M. Nedderman, S. B.
Sav-age, J. Chem. Eng. Sci.37, 1691-1709 (1982).
[11] S. B. Savage, R. M. Nedderman, U. T¨uz¨un and G.T. Houlsby, J. Chem. Eng. Sci. 38, 189-195 (1983). [12] B. P. Tighe and M. Sperl, Gran. Matt.9, 141-144 (2007). [13] C. Mankoc, A. Janda, R. Ar´evalo, J. M. Pastor, I. Zuriguel, A. Garcimart´ın and D. Maza,Gran. Matt. 9, 407-414 (2007).
[14] C. Mankoc, A. Garcimart´ın, I. Zuriguel, D. Maza and L. A. Pugnaloni, Phys. Rev. E 80, 011309 (2009).
[15] F. Ulissi. Graduate Thesis on Mechanical Engineering: Estudio del perfil de velocidades y variables que gobier-nan los flujos en silos y tolvas de configuraciones varias. (July 2008). Engineering Faculty University of Buenos Aires, Argentina.
[16] R. L. Brown and J. C. Richards, Principles of Powder Mechanics, Pergamon Press, Oxford, (1970).
[17] R. L. Brown and J. C. Richards, Trans. Inst. Chem. Eng. 38, 243-256 (1960).
[18] Nedderman, R.M., Laohakul, C. Powder Technol. 25, 91-100 (1980).
[19] K. To, P.-Y. Lai and H. K. Pak, Phys. Rev. Lett. 86, 71 (2001).
[20] I. Zuriguel, L. A. Pugnaloni, A. Garcimart´ın and D. Maza, Phys. Rev. E 68, 030301(R) (2003).
[21] I. Zuriguel, A. Garcimart´ın, D. Maza, L. A. Pugnaloni and J. M. Pastor, Phys. Rev. E 71, 051303 (2005). [22] A. Janda, I. Zuriguel, A. Garcimart´ın, L. A. Pugnaloni
and D. Maza, Euro Phys. Lett. 84, 44002 (2008). [23] H. A. Janssen, Versuche ber Getreidedruck in Silozellen.
Zeitschr. d. Vereines deutscher Ingenieure,
39(35):1045-1049 (1895).
[24] J. Duran, Sands, Powders and Grains: An Introduction to the Physics of Granular Materials, Springer-Verlag, Berlin, 2000.
[25] See for example: R. L. Brown and J. C. Richards, Trans. Inst. Chem. Eng. 38, 243-256 (1960), comment on pp.167. H. M. Jaeger and S. R. Nagel, Science 20, 255 (5051), 1523 - 1531(1992), comment on pp.1527. H. M. Jaeger S. R. Nagel and R. P. Behringer, Rev. Mod. Phys. 68, 1259-1273(1996), comment on pp.1261. J. Kakalios, Am. J. Phys. 73 (1), 8-22(2005), comment on pp.15. C. S. Campbell, Pow Tech 162, 208-229 (2006), comment on pp.212. X.I. Wu, K. J. Maloy, A. Hansen, M. Ammi and D. Bideau, Phys Rev Lett 71 (9) 1363-1366 (1993), comment on pp.1363. G. H. Ristow, Physica A 235(1997) 319-326, comment on pp.324.
[26] M. A. Aguirre, J. G. Grande, A. Calvo, L. A. Pugnaloni and J.-C. G´eminard, Phys. Rev. Lett. 104, 238002 (2010). [27] M. A. Aguirre, J. G. Grande, A. Calvo, L. A. Pugnaloni and J.-C. G´eminard, Phys. Rev. E. 83, 061305 (2011). [28] M. Sperl, Gran. Matt. 8, 5965 (2006).
[29] L. Vanel and E. Cl´ement, Eur. Phys. J. B 11, 525-533 (1999).
[30] L. Vanel, D. Howell, D. Clark, R. P. Behringer, and E. Cl´ement, Phys. Rev. E 60, R5040 (1999).
[31] E. Kolb, T. Mazozi, E. Cl´ement and J. Duran Eur. Phys. J. B 8, 483-491 (1999).
[32] L. Vanel, Ph. Claudin, J.-Ph. Bouchaud, M. E. Cates, E. Cl´ement, and J. P. Wittmer, Phys. Rev. Lett. 84, 7, 1439-1442 (2000).
[33] Y. Bertho, F. Giorgiutti-Dauphin´e and J.-P.Hulin, Phys. Rev. Lett. 90, 144301 (2003).
[34] H. Pacheco-Martinez, H. J. van Gerner and J.C. Ruiz-Su´arez, Phys. Rev. E. 77, 021303, (2008).
[35] H. Ahn, Z. Ba¸sarano˘gu, M. Yilmaz, A. Bu˘gutekin and M. Zafer G¨ul, Powder Technol. 186, 65-71 (2008).