Copyright WILEY-VCH Verlag GmbH & Co. KGaA, 69469 Weinheim, Germany, 2020.
Supporting Information
for Adv. Funct. Mater., DOI: 10.1002/adfm.202002630
Particle Surfaces to Study Macrophage Adherence, Migration,
and Clearance
Dedy Septiadi, Aaron Lee, Miguel Spuch-Calvar, Thomas
Lee Moore, Giovanni Spiaggia, Wildan Abdussalam, Laura
Rodriguez-Lorenzo, Patricia Taladriz-Blanco, Barbara
Rothen-Rutishauser, and Alke Petri-Fink*
Copyright WILEY-VCH Verlag GmbH & Co. KGaA, 69469 Weinheim, Germany, 2020.
Supporting Information
Particle surfaces to study macrophage adherence, migration and clearance
Dedy Septiadi, Aaron Lee, Miguel Spuch-Calvar, Thomas Lee Moore, Giovanni Spiaggia, Wildan Abdussalam, Laura Rodriguez-Lorenzo, Patricia Taladriz-Blanco, Barbara Rothen-Rutishauser, Alke Petri-Fink*
Figure S1. Transmission electron micrographs of four different silica particles and their
corresponding hydrodynamic diameter (Dh) distributions measured by dynamic light scattering.
Figure S2. Fluorescence confocal micrographs of a. spin coated 1.2 µm silica particles on
bare glass and b. spin coated 1.2 µm silica particles on PLL-functionalized glass. Scale bar = 100 µm.
Figure S3. Orthogonal view showing internalization of spin coated 1.2 µm silica particles
(green) by single MDM (red).
Figure S4. Zeta potential value of four silica particles.
Figure S6. Thickness determination of PLL layer by atomic force microscopy through profile
extraction at a generated edge (black line). Mean plateau height determined for level difference between PLL and underlying glass substrate.
Quartz Crystal Microbalance
Mass adsorption to the sensor surface produces an observable shift in the resonance
frequency. This behaviour is governed by the Sauerbrey equation[1] for thin and rigid films where:
∆𝑓 = −2𝑓0
2
𝐴√𝜌𝜇∆𝑚
f is the frequency, f0is the fundamental frequency, A is the sensor area (0.283 cm2), µ is the
shear modulus of quartz (2.947 x 10¹¹ g cm-1 s-2), ρ is the density of quartz (2.648 g cm-3) and
m being the mass gained. The frequency shift associated with silica particle adsorption was
used to derive a corresponding mass by applying the Sauerbrey equation. To determine the mass-derived particle density, the total Sauerbrey mass per unit area was divided by the mass of one silica particle by assuming the density of silica particles to be 1.9 g cm-3 and
approximating the volume of each particle as a sphere with radii determined from dynamic light scattering measurements.
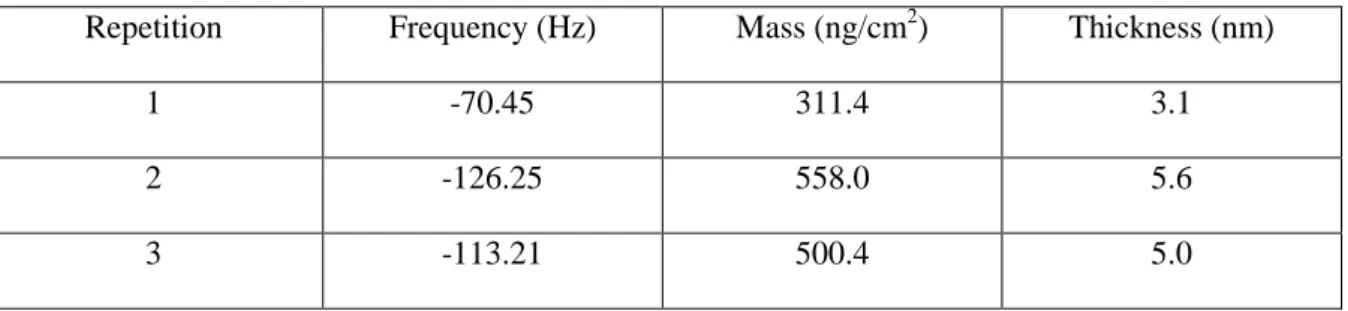
Table S1. Determination of PLL thickness by means of quartz crystal microbalance.
Repetition Frequency (Hz) Mass (ng/cm2) Thickness (nm)
1 -70.45 311.4 3.1
2 -126.25 558.0 5.6
Table S2. Mean surface roughness (Rms) measured by AFM Surface Rms roughness (nm) Glass 0.6 PLL 4.7 Silica 50nm 30.6 Silica 180nm 78.4 Silica 480nm 198.9 Silica 1200nm 408.5
Figure S7. Time-lapse fluorescence images showing particle phagokinetic by MDM (red). 1.2
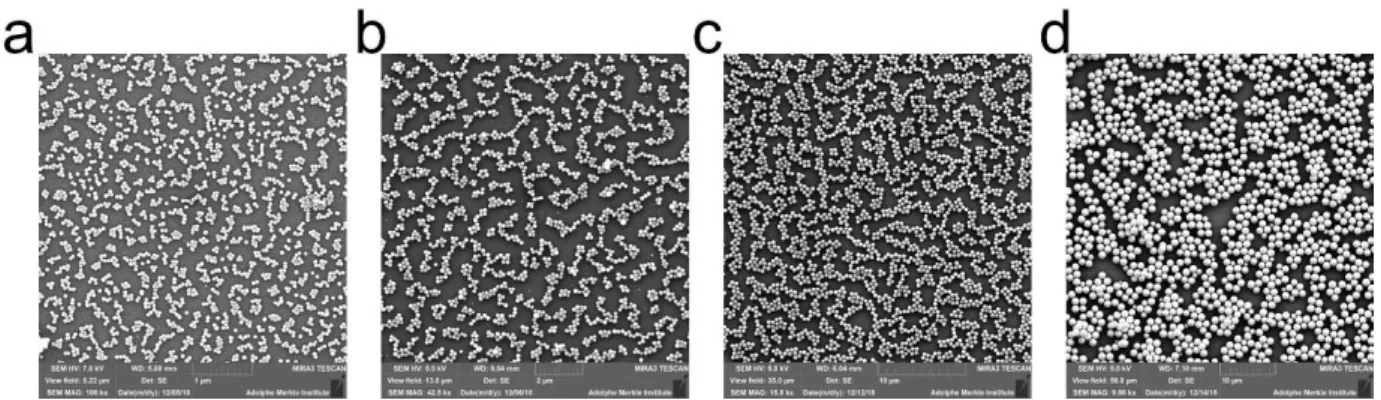
Figure S8. Scanning electron micrographs showing four different homogenous particle surfaces. a. 50 nm, b. 180 nm, c. 480 nm and d. 1.2 µm. Scale bar for panel a to d = 1 µm; 2 µm; 50 µm; 10 µm, respectively.
Figure S9. Density of particle surface measured by means of image processing.
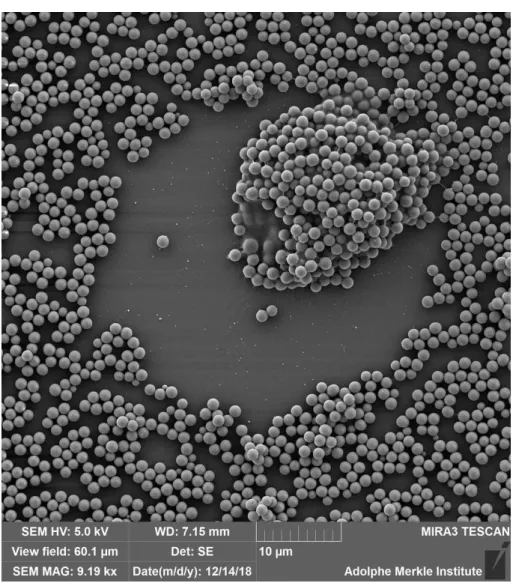
Figure S11. Representative scanning electron micrograph showing interaction between single
Figure S12. Representative scanning electron micrographs showing interaction between
Figure S13. Scanning electron micrograph showing the pulling of particles (480 nm) from PLL-glass substrate by membrane protrusion (red oval). Particles were also distributed on the apical (top) part of cell membrane and inside the MDM.
Figure S14. Confocal images showing a phalloidin-treated cell (red) performing particle
Figure S15. a. Confocal images showing the protrusion of F-actin (red) on particle carpet
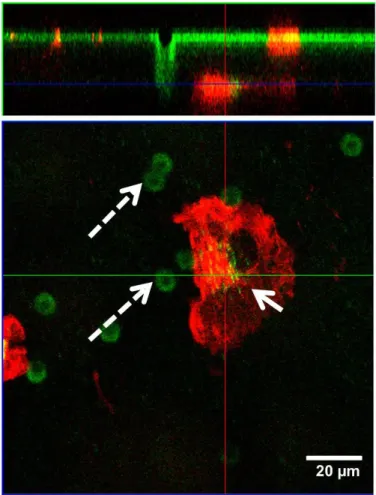
Figure S16. Orthogonal view of z-stack confocal micrographs. Single MDM after clearing
the particles on the apical side move and translocate to basal side (bottom). The solid arrow shows a pore in the insert whilst dashed arrows resemble intracellular particles in the basal side.
Supporting Video
Video S1. Time-lapse fluorescence (left) and bright-field (right) video showing particle
clearance by MDM. At early incubation time (0 min), MDM and particles (1.2 µm rhodamine B-labelled silica particles, green) separated by 20 µm, and over time the MDM migrates to
direction of particles and eventually uptakes the particles through its
filopodium/lamellipodium expansion (i.e. actin protrusion; white arrow; 100 mins). Particles (green) were spin coated on non-coated glass.
Video S2. Time-lapse fluorescence (left) and bright-field (right) video showing particle clearance by MDM. Particles (green) were spin coated on PLL-coated glass.
Video S3. Time-lapse fluorescence images showing the uptake and migration of MDMs (red) on 480 nm particle surface (green).
Video S4. Time-lapse bright field images showing the uptake and migration of A549 cells on
480 nm particle surface.
Reference