Publisher’s version / Version de l'éditeur:
Vous avez des questions? Nous pouvons vous aider. Pour communiquer directement avec un auteur, consultez la première page de la revue dans laquelle son article a été publié afin de trouver ses coordonnées. Si vous n’arrivez pas à les repérer, communiquez avec nous à PublicationsArchive-ArchivesPublications@nrc-cnrc.gc.ca.
Questions? Contact the NRC Publications Archive team at
PublicationsArchive-ArchivesPublications@nrc-cnrc.gc.ca. If you wish to email the authors directly, please see the first page of the publication for their contact information.
https://publications-cnrc.canada.ca/fra/droits
L’accès à ce site Web et l’utilisation de son contenu sont assujettis aux conditions présentées dans le site LISEZ CES CONDITIONS ATTENTIVEMENT AVANT D’UTILISER CE SITE WEB.
Canadian Journal of Earth Sciences, 2, pp. 15-31, 1965-02
READ THESE TERMS AND CONDITIONS CAREFULLY BEFORE USING THIS WEBSITE. https://nrc-publications.canada.ca/eng/copyright
NRC Publications Archive Record / Notice des Archives des publications du CNRC :
https://nrc-publications.canada.ca/eng/view/object/?id=83990133-6212-4797-a58c-42c79811818e https://publications-cnrc.canada.ca/fra/voir/objet/?id=83990133-6212-4797-a58c-42c79811818e
NRC Publications Archive
Archives des publications du CNRC
This publication could be one of several versions: author’s original, accepted manuscript or the publisher’s version. / La version de cette publication peut être l’une des suivantes : la version prépublication de l’auteur, la version acceptée du manuscrit ou la version de l’éditeur.
For the publisher’s version, please access the DOI link below./ Pour consulter la version de l’éditeur, utilisez le lien DOI ci-dessous.
https://doi.org/10.1139/e65-003
Access and use of this website and the material on it are subject to the Terms and Conditions set forth at
Some observations on the influence of climatic and terrain features on
permafrost at Norman Wells, N.W.T., Canada
SOME OBSERVATIONS ON THE INFLUENCE OF CLIMATIC AND TERRAIN FEATURES ON PERMAFROST AT NORMAN WELLS,
N.W.T., CANADA
R. J. E . BKOJVN*
Lliaision of Bzrilding Researclz, National Research Co~rncil, Ottau~a, Canada
Received August 3, 1964 ABSTRACT
During the summers of 1959 and 1060, field observations of the influence of some climatic and terrain features on permafrost were carried out a t Norman Wells, N.W.T. Five sites, all underlain by perennially frozen ground, were selected for investigation. One site was a Thornthwaite potential evapotrans- piration site with a vegetation cover of Kentucky bluegrass growing on clayey silt. T h e four remaining sites included the various types of vegetation growing naturally in the Korman Wells region. The tree growth was predominantly spruce with some tamarack. Spl~agnlrnt and other mosses, lichen, and sedge comprised the ground cover. T h e peat layer varied in thickness from 7 in. to 2 ft and the mineral soil was predominantly clayey silt. A t each site, measure- ments were taken of evaporation (including potential evapotrar~spiratior~), net radiation a t the ground surface, depth of thaw, and ground temperatures in the thawed layer and the permafrost. Although field conditions dictated the use of crude measuring devices, some quantitative information was obtained on the relative importance of these climatic and terrain features in the permafrost environment. Potential evapotranspiration was higher in the Kentucky bluegrass a t the l'hornth\\-aite site than in Sphagnzrrn and in other mosses, in lichen, and in sedge a t the other sites. Net radiation values appeared t o be slightly higher for moss than for lichen. The depth of thaw under moss and lichen was less than In areas supporting other types of plant growth. Ground temperatures in the thawed layer and in the permafrost showed the same characteristics, being lower in the moss and lichen areas.
Field observations were carried out during t h e summers of 1959 and 1960 a t Norman Wells t o obtain quantitative values of the influence of some climatic and terrain features on permafrost. Evaporation (including potential evapotranspiration) and net radiation were measured a t the ground surface. Depth of thaw measurenlents were carried out and ground teinperatures were ineasured in both the seasonally thawed and perennially frozen ground.
Norman Wells (65' 18' N., 126' 49' W.) is located on t h e right banli of the l/lacltenzie River, 240 f t above sea level, 90 miles south of t h e Arctic Circle and about 500 miles north of the southern limit of permafrost (Fig. I ) . T h e depth t o permafrost a t Norman Wells varies from 1 t o 2 ft in undisturbed moss- peat areas t o a maximum of 15 f t and more in areas disturbed by construction. I'errnafrost occurs everywhere under the ground surface and is about 200 ft thicli.
DESCRI P T I O S O F OBSEIIVr\TIOS S I T E S
Observations were taken a t five sites in the Norman Wells region. Site No. 1 \vas a Thornthwaite potential evapotrailspiration site; the other four were chosen t o include t h e various types of vegetation indigenous t o the Norinan Wells region.
"Northern Research Group, Soil Mechanics Section, Division of Building Research, National Research Council, Ottawa.
Canadian Journal of Earth Sciences. Volume 2 (1005) 15
C A N A D I h S JOURNAL O F EARTH SCIENCES. VOL. 2, 1005 4- MACKENZIE RIVER L E G E N D I S I T E I ( K E N T U C K Y BLUEGRASS) 4 S I T E 4 ( L I C H E N 1 \ 2 S I T E 2 ( S E D G E 1 5 S I T E 5 ( F O R E S T E D ) k 2 A S I T E 2 A (SEDGE.MOSS AND X M E T E O R O L O G I C A L S T A T I O N SPHAGNUM 1 3 S l T E 3 ( S P A R S E L Y F O R E S T E D SPHAGNUM 1 0 2000 4000 6000 8000 I 0 0 0 0 I I I , SCALE IN FEET
FIG. 1. Location o f test sites a t Norllla~l Wells, N . W . T .
Site 1
Vegetation: Kentucky bluegrass, 2 in. high (Fig. 2).
Soil: 0 in. to 4 in. Black deco~nposed organic matter and silt.
Below 4 in. Brown clayey silt, scattered stones, organic matter. Site 2
Vegetation: Grass-like sedge, 1 f t high with scattered dwarf ~villow and ground birch (Fig. 3).
Soil: 0 in. t o 7 in. Black decomposed organic matter (peat). 7 in. to 1 f t 8 in. Black organic silt.
Below 1 f t 8 in. Clayey sandy silt. Site 3
Vegetation: Scattered spruce and tamarack up to 6 f t high, dwarf ~villow and ground birch, 2 f t high with ground cover of Labrador tea and Sphagnum.
Soil: 0 in. to 5 in. Sphagnum (scattered patches exceeded 12 in.). 5 in. to 1 ft 11 in. Black decoinposed orgailic matter (peat). Below 1 f t 11 in. Grey clayey silt.
Site
4
Vegetation: Scattered spruce, tamarack, and birch up to 10 ft high, Labra- dor tea, Sphagnum, and lichen (Cladonia alpestris, Cetraria nivalis, Cetraria cucullata) (Fig. 4).
Soil : 0 in. t o 2 in. Lichen.
2 in. t o 4 in. Black decoinposed organic matter (peat). 4 in. to 2 f t 0 in. Brown deconlposed organic matter (peat). Below 2 f t 0 in. Grey clayey silt.
I 2 Site 1 ('Thornth\vaite installation) a t X o r ~ n a n \\.ells, S.\\..'1'. Grass-covered pans ivith tensior~~eters in [oreground. Supply tanks and overflow housing in background. .-Iugust 1956.
FIG. 3. Site 2 (sedge area).
I .4. Site 4 (lichen area) shotring installation of ther~nocol~ple cable in permafrost. Sep- tember 1960. FIG. 5. Site 5 (forested area). 29 August 1959.
BROWN: PERMAFROST AT NORMAN ~ V E L L S 17
Site 5
i'egetation: Dense spruce and tamarack up t o 20 ft high, I\-illolv a n d alder up t o 4 f t high with ground cover of Labrador tea, Sphagnz(m and other mosses (Ti~uidium abietinum, Plez~rozium sp.)
(Fig. 5 ) .
Soil: 0 in. t o 4 in. SpI~agnz(m and other moss.
4 in. t o 7 in. Blacl; decomposed organic matter (peat). Below 7 in. Brown clayey silt.
The I<entucky bluegrass a t site 1 is not native t o Norman Miells b u t is a
cover commonly used a t Thornthwaite installations in temperate non- permafrost regions (Thornthwaite 1948). A t this site, t h e depth t o permafrost
is between 3 and 10 ft. T h e depth t o permafrost a t site 2 is about (i f t and a t
the other sites it is less than 5 ft.
APPARATUS A N D OBSEI<VXTION M E T H O D S
EvaQoration (Including Evapotranspiratiort)
T h e purpose of the Thornth\\-aite installation a t site 1 was t o test the
validity of the Thornthwaite world climatic classification system, n-hich is
based on potential evapotranspiratioil (PE), for northern areas t h a t have long
days during t h e vegetative grouling season (Sanderson 1934). PE \\as measured
a t the other four sites t o observe quantitative differences in various vegetation types which grow naturally in the permafrost region a n d t o compare these with values obtained from t h e Thornthn-aite installation.
At all sites a snlaller evapotranspirometer was used; it consisted of half a
43-gal oil drum about 56 cnl in dianleter. On the bottoill of each drum was
\velded a threaded outlet from which a pipe led t o a n overflo~v container about
3 ft awaj-. JIeasurements were taken daily from 1 3 t o 31 August 1939 a n d
30 June t o 17 September 1960. After the overflon- was recorded, a measured quantity of water in excess of the anticipated I'E \\-as sprinkled ~111iformly over the surface.
Air temperatures and rainfall were measured daily a t each site. A t sites 2 to 3 , sonle perennially frozen soil had t o be excavclted t o accommodate the oil drums and overflow apparatus b u t t h e lon- soil telnperatures did not interfere with the evapotranspiration or overflon~.
T h e latent evaporability of the air nras measured wit11 a n Alundum disc
atn~orneter, loaned b y the Canadian Department of Agriculture. This atmo-
meter was installed in the southwest corner of site 1. In 1959, daily readings
were talien from t h e beginning of August until early September. I n 1960, daily
readings \\rere taken from 11 June until 17 September. T h e results of both
summers \\-ere compared I\-ith observations from t h e Thornthnraite installation.
I n 1960, a class A evaporation pan was supplied by the RIeteorological
Branch, Canada Department of Transport, to measure t h e evaporation froill the surface of water in a n open pan. This installatioll was located 15 f t n-est
CANADIAN JOURNAL O F EARTH SCIENCES. VOL. 2, 1005
PENMAN FORMULA, CENTIMETERS
FIG. 6. Comparison of observed potential evapotranspiration from Iientucky b l ~ ~ e g r a s s a t
site 1 (Thornthwaite installation) with Penman evaporation formula, for summer 1960.
17 September and the results compared with the observations from the Thorn- thwaite installation.
Net Radiation
I n 1959, \veeltly readings of net radiation were taken a t each site with a n
economic net radiometer (SUOIII~ a n d I i u h n 1958) t o obtain some estimate of
the relative importance of the various ground plant species on the heat exchange
between the atn~osphere and the ground.
Ground Tlzernzal Xeginze
I n the sunlmers of 1957 t o 1939 inclusive, weekly depth of tha~c- measure-
ments \\-ere made a t each site to determine quantitative variations under different types of vegetative cover and t o assess the relative importance of the individual species comprising t h e vegetative cover.
Ground temperatures were measured weeltly in t h e thawed layer above t h e permafrost and in the permafrost a t each site t o observe variations in t h e thermal regime under t h e different types of vegetation. Ther~nocouples of 20-gauge copper-constantan duplex \\ire were used to measure the tempera-
tures. I n the than-ed layer, thermocouples were placed a t intervals varying
fro111 3 to 12 in. t o the follo\ving depths: site 1, 70 in.; site 2, 60 in.; site 3,
22 in.; site 5, 14 in. \Veekly temperature readings \\-ere also taken on tn-o special
thermocouple strings installed in thick Splzagnz~m (site 3) and lichen (site 4).
Thermocouples on these strings \\-ere spaced a t 1-in. intervals from the ground surface t o the 12-in. depth t o obtain temperature gradients through the living plant cover t o determine \vhether i t \ \ a s uniform throughout or \vhether i t varied with depth, and to determine 11-11ether there nras any difference in t h e
BROWN: PERMAFROST AT NORMAN WELLS 19 cables were placed a t intervals varying from 1 to 1.5 ft to the folloiving depths: site 2, 19.5 f t ; site 3, 18.5 ft; site 4, 11.5 ft.
RESU1,'TS A N D DISCUSSION
Evaporation (Including Evapotranspiration)
The observed daily PE a t site 1 (Table I) mas coinpared with Thornthn-aite's (1948) formula in which he derived P E from the length of day and a heat index related to the number of degrees of the mean daily temperature above 32 O F .
T h e amount of precipitation was not considered because he assumed that the amount of water evaporated and transpired is determined by temperature and length of day. Using the formula, the computed P E for the 1959 and 1960 periods was 4.47 and 24.75 cm respectively compared with the observed P E of 3.28 and 19.41 cm respectively. In 1960 a t site 1, the observed P E \vas 22.90 cnl a t the oil drum, which is slightly higher than the Thornthwaite installation.
i\leasurements of the latent evaporability (LE) of the air obtained fro111 the Alundum disc atmometer were converted to P E using the formula suggested by the Canadian Department of Agriculture (Robertson 19.54):
(1) L E X 0.0034 X 2.54 = P E (cm).
Applying this formula, the colnputed P E for the 1959 and 1960 periods were 4.19 and 19.47 cnl respectively compared with the P E of 3.28 and 19.41 cill respectively observed a t site 1.
The evaporation of water in 1960 from the class A evaporation pan was colllpared with the I'E observed a t site 1. The former \vas considerably higher, being 25.63 cin conlpared with 19.41 crn for the latter (Table I).
TABLE I
Evaporation (including evapotranspiration) a t Norinan Wells test sites
--
D.O.T. Site 1, Site 2, Site 3, Site 4, Site 5, Station
1060 1960 1960 1960 1060 1960
Elevation above sea level, f t Mean daily air temperature,
"F
Mean daily max air temperature, O F Mean daily rnin air
temperature, "F Rainfall, cm P.E., cm Thornthwaite installation Oil drum Class A pan Atmo~neter Thornthwaite (computed) Penman 300 ft from site 348 344 340 5 a t same elevation Not measured 53.6 54.2 55.2 Not m e a s ~ ~ r e d 65.0 66.9 63.8
NOTE: 19.59 period = 15 t o 31 August inclusive (17 days).
20 CASADI-AN JOURNAL O F EARTH SCIENCES. VOL. '7, 19G5
In addition t o being compared with Thornth~vaite's formula, the P E observed a t site 1 was compared also with the forrrlula developed b y Penman (1956).
Penman's inass transfer formula is:
where
Eo = evaporation, crn;
eo - e, = vapor pressure difference bet\veen surface and air, 111111 of 1-1s;
U s = mean wind speed, miles per day.
I t was assumed t h a t the mean temperature of a saturated surface is approxi- mately equal to the mean air temperature. Wind velocity and air temperature records were obtained from the Department of Transport's RIeteorological Station a t Norman Wells. T h e wind factor \vas adjusted t o the '-meter level by assuming t h a t the wind velocity decreases lvith height according to t h e one-seventh po\ver la\v. T h e P e n n ~ a n totals for the 1939 and 1960 periods \\-ere 4.51 cm and 19.32 cm respectively coinpared with the observed P E of 3.28 and 19.41 cm respectively. A coinparison was made between the calculated Pennlan formula and observed PE for 10-day and monthly totals, resulting in good correlation (Fig. 6).
In 1960, the evaporation observed on the Alundum disc atmometer a n d coinputed by the Penman formula (Table I) gave the closest values to the P E measured a t the Thornthwaite installation (80-day observation period). None of the values measured in 1939 mas close to t h e PE measured on t h e Thorn- thwaite installation possibly because t h e observation period was so short (only 17 days).
T h e use of the Thornthwaite forinula to compute PE a t high latitudes has been criticized because the length of d a y factors and the heat index have been computed o n l ~ - north to 30' (Korman Wells lies a t 65' 18'). Farther north t h e days are longer during the evapotranspiration period b u t the amount of incoming solar radiation is less because of the lower angle of t h e sun. I t is not l;no\vn h o ~ v \\-ell these factors balance out.
T h e disregard b y the Thornth\vaite and latent evaporation formulae for different plant types would seen1 to be an objection particularly for northern areas where nlosses and lichens grow 11-idely. T h e mechanisms of moisture ~noveinent in these non-vascular plants are quite different from vascular plants. Splzagtzum and other lnosses are strongly hygroscopic and can lose
moisture rapidly and in large quantities. Lichens, however, have very d r y surfaces a t times, even when lower layers near the soil are very wet. I t is not certain ~vhether th e transfer of water vapor from t h e wet basal la)-er t o t h e atmosphere above t h e lichen t a l e s place b y evaporation or merely b y diffusion exhange. T h e area of vegetative surface per unit ground area of mosses and lichens may be very different fro111 t h a t for the higher plants. For these reasons, the quantity of moisture transfer (and resulting heat transfer) between the per~nafrost and the atmosphere m a y be quite different fro111 temperate areas where mosses and lichens are not predominant.
BROWN: PERMAFROST A T NORMAN WELLS 21 P E measurements in 1960 at sites 2 to 5, inclusive, are presented in Table I.
(Results from 1959 are not presented because they are so scattered probably because of the very short length of the observation period.) The PE a t these four sites is considerably less than a t site 1. Because of the uncertain accuracy of the oil drum method of measuring PE, it is inlpossible to give quantitative differences anlong sedge, moss, and lichen. Nevertheless PE fro111 these plant types was significantly less than from Kentucky bluegrass.
i\/Iean daily air temperatures were recorded a t four of the five sites but there was no apparent correlation with PE. Site 1 had the highest P E ; its mean temperature for the 80-day period of 54.6
OF
was higher than that of site 5 (which was shaded) and site 2 but lower than sites 3 and 4 near a small lake. The higher degree of exposure to wind of site 1 n~ould contribute to its having a higher PE, but sites 3 and 4 were also fairly exposed. These last two sites had P E values similar to site 5, which was sheltered.I t has been stated that meteorological factors play a prominent role in evapotranspiration rates where soil moisture is not the limiting factor. Kever- theless, it is possible that the physiological characteristics and radiation and thermal properties of plant materials such as moss and lichen, which lnailltain a high permafrost table, are significant factors in determining the contribution of evapotranspiration to the energy exchange of permafrost. One discrepancy that arises is the fact that the sedge does not maintain a high permafrost table, but has P E rates comparable to those for moss and lichen. This may be caused by its lower insulating qualities ~vhich permit a greater depth of than- during the summer.
Net Radiation
During the summer of 1959, weeltly net radiation measurements of various vegetative cover types in the Norman Wells area were taken using an economic net radiometer. T o obtain net radiation \\lit11 approximately 3 to 5% accuracy, the short expression for radiation in Langleys per minute was used:
(3) R, = 1 . 2 5 ~ ~ (T,4 - Tb4)
+
0.0025 (Tt - Tb)where
R , is net radiation, Langleys per minute;
a is the Stefan-Bolz constant; T, = temperature of top face, OC; Tb = temperature of bottom face, "C.
This expression considers incoming radiation positive and outgoing radiation negative.
The calculated net radiation results and air temperatures a t the time of reading are tabulated in Table 11. This table also includes the exact times a t which observations were talten and the percentage of sunlight recorded during the hour in which each reading was made. No continuous measurements of incoining solar radiation were made with which the observed net radiation values could be compared. I t was thus impossible to compare the differences of net radiation through different types of vegetative cover ~vith the incoming solar radiation a t the time of observation.
22 C A S A D I A N JOIJRNAL O F EARTH SCIENCI<S. VOL. 2, 1905
TABLE 11
S e t radiation values obtained from various types of vegetation a t Norman IVells, N.W.T. using economic net radiometer, 1959
. . -- -- -
Net radiation Time Air
Date Site g-cal/crn2 min P.S.T. temp., 'I: Sky conditions Au?; 28 Sep:; 7 Sep:; 11 Sept. 12 Sept. 11 Sept. 23 Sept. 24 Sept. 23 Sept. 24 Sep:; 30 Site 1 Site 2 Site 3 Site 4 Site 5 Site 1 Site 2 Site 3 Site 4 Site 5 Site 1 Site 2 Site 3 Site 4 Site 5 Site 1 Site 2 Site 8 Site 4 Site 5 Site 1 Site 2 Site 3 Site 4 Site 5 Clear Clear Clear Cloudy bright Clear Cloudy bright Overcast Overcast Cloudy bright Cloudy bright Clear Clear Clear Scattered cloud Clear Cloudy bright Cloudy bright Cloudy bright Cloudy bright Cloudy bright Overcast Overcast Overcast Overcast Overcast
Despite the q~~estionable validity of the observations, a general qualitative pattern is evident. For example, it was anticipated that the net radiation values for lichen would be the lowest because of this plant's light color and consequent high reflective properties. This was true on clear days b u t not on partly cloudy or overcast days when differences in net radiation from one plant type to another were small. On the other hand, net radiation values for the sedge, which is also a light-colored plant, were much higher than for lichen on clear days and higher than the darker-colored plants such as grass and moss. Net radiation values a t site 1 were the highest on some days but not on others. Net radiation through Sphagnum and other mosses was highest on clear days but not al\vays on overcast days.
Froin these crude measurements, it appears t h a t net radiation through moss is higher than through lichen. Nevertheless, these plants maintain the perma- frost table a t about the same level in a given area and near surface ground temperatures are similar under both plant types. Consequently, if lichen rejects a higher proportion of the net radiative flux than moss this may be con~pensated by the moss rejecting a higher proportion than the lichen of some other component of the energy exchange.
Ground Tlzermal Regime
Depth of thaw ineasureillents in various types of vegetative cover were plotted against Fahrenheit degree days for the summers of 1957, 1958, and
BROWN: PERMAFROST AT NOKMAN WELLS 23
1959. The use of degree days gives a more realistic cornparison than calendar dates because of the variation in air teiiiperature froiii one sumnier to another. For example, the depth of thaw in 1959 was considerably less than in the two previous summers because of the lower air temperatures. Nevertheless, a comparison of depth of thaw with degree days of thawing indicated a silnilar relationship for the three summers of observations. Average values of depth of thaw vs. degree days of thawing were obtained for each veget a t ' lon cover type and plotted (Fig. 7).
The greatest depth of thaw occurred a t site 2, sedge and no ~rloss cover over- lying 7 in. of peat. The next greatest depth of thaw ~ v a s observed in a forested area, probed only in 1957 and 1958. This site had a iiioss cover 4 in. thick overlying 3 in. of peat. Actually the 1958 depth of thaw was much greater than in 1957, a condition which inap be explained by the inadvertent disturbance of the site in 1957 resulting in an unnaturally deep thaw the next year. A treeless area having a ground cover of sedge (Scorpidiz~m sp.) and 3-in. thick cover of Sphagnum and other inosses (Fig. 1, site 2A) overlying 6 in. of peat experienced less depth of thaw than the previously mentioned area. The shal- lowest depth of thaw was observed a t site 3, sparsely forested area that had a 5 in. t o
>
12 in. SpIzagnum cover overlying about 18 in. of peat and site 5, forested area with 4 to 12 in. of Sphagnum and other inosses overlying several inches of peat.The depth of thaw is greatly influenced by the thickness of nioss and peat. The degree the depth of thaw is influenced by the shade of shrubs and trees is uncertain. This is probably a relatively minor factor compared with the influence of nioss and peat. This is supported by the air temperature observa- tions obtained a t the various sites during the sumnier of 1960. The iiieaii daily air temperature a t the sedge area (site 2) for the period of 30 June to 17 Sep- tember 1960, which includes a major portion of the thawing period, was 53.2 OF. The mean daily air temperature for the same period a t the forested area (site 5) was 54.2 O F although the depth of thaw \~ias several feet less. The
predominating influence of the moss and peat is demonstrated by comparing iilaxiinum depth of thaw a t locations \vith widely different thawing indices. At Aklavik, N.W.T. (68" N), the inean thawing index is about 2 300; a t Thompson, iVIanitoba (56"
N),
it is about 3 100. Nevertheless, the inaximuni depth of thaw in areas of thick nioss and peat accuiiiulation a t each settlement is similar.Precipitation also influences the depth of thaw and soil temperatures. No observations were made a t Nornlan Wells and there is little available informa- tion in the literature. Russian observations (Shvetsov and Zaporozhtseva 1963) indicate that the situation is complex and that txvo factors should be considered. First, the amount of inoisture in the soil immediately before it freezes in the autunin determines the ice content and depth of thaw the follo\v- ing summer. Second, the inoisture content of the soil surface and the infiltra- tion of atmospheric water influence the heat transfer to the frozen soil during the thaw period.
BROWN: PERMAFROST AT NORMAN WELLS 25
in the thawed layer above the perinafrost showed t h a t significant differences existed under different types of vegetation. The ground temperatures were the highest a t site 1 and progressively less a t site 2 ; in the treeless sedge area wit11 a cover of Sphagnunz and other mosses (site 2A); and a t site 3. In August, site 3 had lower temperatures than site 5 and site 4 had higher temperatures. There appeared to be a general decrease in temperature with increased illoss cover and peat thickness. Although the depth of thaw did not appear to be significantly less in areas shaded by trees, these areas experienced slightly lower temperatures in the thawed layer than treeless areas.
Ground temperatures were coinpared with degree days of thawing. T h e cooler nature of the 1959 sunlmer was confirmed by the fact that the cumula- tive total of degree days of thawing on 30 September totalled 2 513 compared with 2 954 on 23 September 1960. A plot of ground temperatures vs. degree days of thawing did not produce similar patterns, ho~vever, for the two sum- mers. For any given degree day total, the ground temperatures were much higher in the warmer suinmer of 1960. For example, in 1959, the temperature a t the 12-in. depth a t site 1 on 28 August was 46.6 O F , a t which time the
cumulative total of degree days of thawing was 2 232. Almost the saine degree daj7 total was reached on 5 August 1960 (2 202), a t which time the temperature a t the 12-in. depth was 54.5 OF.
klosses and lichen maintain a high perinafrost table. In suinmer, the air temperature frequently rises above 80 O F but the temperature beneath these
plants remains close to 32 O F . At site 3, the Sphagnzlnz exceeded 12 in. thickness
a t the location of the 12-in. ther~nocouple string so that its full length was in the S$hagnzlnz. At site 4 , the lichen was only 2 in. thick so that the 12-in. thernlocouple string extended 10 in. below the lichen.
In 1959 the temperature gradients for the two strings were higher in the top 8 in., and lower in the bottom 4 in. This ilieans that the gradient was unifornl t h r o ~ ~ g h o u t the lichen and the top few inches of the underlying peat, in contrast to the Sphagnzlm where the gradient changed in the Sphagnz~m itself.
In 1960 the same large differences between surface temperatures and tenlperatures a t the lower end of the thermocouple strings were evident. The chief difference between the two summers was t h a t temperature profiles in 1960 sho\ved changes in gradient a t about the 4- or %in. depth in contrast to the 8-in. depth in 1959. In all cases, the temperature observed a t the surface of the Sphagnunz and lichen was several degrees higher than the screen air tenlperature observed a t the time of the ground temperature readings.
In 1959, the teinperatures observed a t the 12-in. depth were the same in both the Sphagnzlm and lichen, but in 1960 the temperature a t t h e bottom of the tl~erinocouple string in the Sphagnzlm was consistently about 5 OF higher than in the lichen. I t is difficult to know whether temperatures a t the 12-in. depth actually varied by this amount between the two plant types or whether one of the thermocouple strings was faulty. I t is possible t h a t the thernlocouple string in the moss was defective because the 12-in. therinocouple gave unreliable readings and the 11-in. therinocouple was used instead. T h e readings on the
26 CANADIAN JOURNAL O F EARTH SCIENCES. VOL. 2, 1965
lichen were probably closer to reality but even they were about 4 O F higher
than teiiiperatures observed a t the 12-in. depth in the \vooded area.
Taking all the weekly readings froiii 28 August to 30 September 1959, which was the period when the depth of thaw reached its maxinium and the differences caused by variations in vegetative cover were most pronounced, the average temperature a t the 1-ft depth was calculated. I t was noted in the hourly readings talten a t site 1 (mentioned below) t h a t over a 24-hour period the temperature fluctuation a t the 1-ft depth was 1.5 O F . All the ground tempera-
ture readings a t the various sites were talien between 9.00 a.m. and 4.00 p.m. during which period the temperature fluctuation a t the 1-ft depth a t site 1 was 0.8 O F . (This \\~ould probably be as large a variation a s xvould ever occur
during the summer because it was measured through a day which \\-as clear with a large air teinperature fluctuation.) The inean air teinperature for this period was 41.2 O F . T h e mean ground teiiiperatures were a s follo\\rs:
Site 1 (Kentucky bluegrass) 40.0 O F Site 3 (thick Sphagnzlnz) 32.5 O F
Site 2 (sedge) 36.5 O F Site 4 (lichen) 32.6 O F
Site 2A (sedge, moss, Site 5 (forested) 32.8 O F
Sphagnum) 35.0 O F
Site 3 (sparsely forested
Sphagnum) 33.7 O F
The lichen and Sphagnzcnz had approxiniately the same average temperature over this period although the lichen was only 2 in. thick in contrast to the 12 in. of Sphagnum, both overlying similar thicknesses of peat.
Means of the weekly temperatures a t the various depths for different time periods were calculated for 1960. i\/Iean ground temperatures and ground teinperature fluctuations for the period of 15 July to 16 Septeiiiber are plotted in Fig. 8 shou~ing. them to be iiiuch higher a t sites 1 and 2 than under the S$lzagnz~m and other mosses a t site 5. Differences between the mean air and mean ground temperatures a t the 12-in. depth a t the various sites for the period of 28 August to 30 September 1959 were compared \\-ith the differences for the period of 15 July to 16 September 1960. T h e differences were:
Site 1 (Kentucky bluegrass) 1.2 O F (1959), 3.3 O F (1960)
Site 2 (sedge) 4.7 O F (1959), 5.6 O F (1960)
Site 3 (thick Sphagnz~m) 8.7 O F (1959), about 12 O F (1960)
Site 4 (lichen) 8.6 O F (1959), about 17 O F (1960)
Site 5 (forested) 8.4 O F (1959), 19.8 O F (1960)
This appears to confirm the thermal resistance of the inoss and lichen because the niuch higher air temperature means in 1960 did not cause ground tempera- tures t h a t were niuch higher than those recorded in 1959.
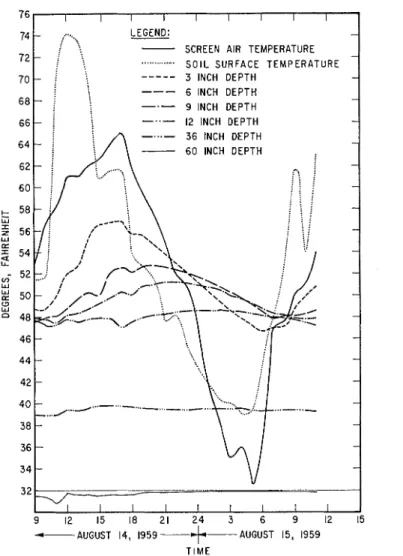
In 1959, a series of 27 consecutive hourly observations of screen air tenipera- ture, ground surface temperature, and tenlperatures a t depths of 3, 6, 0, 12, 36, and 60 in. were taken a t site 1 froin 9.00 a.m. 14 August to 11.00 a.m. 15 August. A plot of these observations sho\ved that the largest temperature
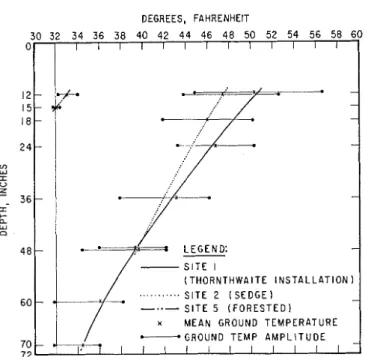
BROWN: PERMAFROST AT NORMAN WELLS 27 DEGREES, FAHRENHEIT 3 0 3 2 3 4 3 6 3 8 4 0 4 2 4 4 4 6 4 8 5 0 52 5 4 5 6 5 8 6 0 0 I l l l l l l l ~ l l ~ l - 1 8 - - 2 4 - - - - (THORNTHWAITE I N S T A L L A T I O N ) S I T E 2 ( S E D G E ) - S l T E 5 ( F O R E S T E D )
x MEAN GROUND TEMPERATURE -GROUND TEMP A M P L I T U D E
FIG. 8. Mean ground temperatures and ground te~nperature fluctuations (15 July t o 16 September 1960).
fluctuations occurred in the air and a t the soil surface; fluctuations decreased progressively with soil depth. T h e lag in maximum and mininlum teinperatures also increased with depth (Fig. 9).
Mean temperatures for the 24-hour period from 9.00 a.m. 14 August t o 9.00 a.m. 13 August were calculated for the 3-, 6-, 9-, 12-, 36-, and 60-in. depths, the soil surface, and the screen air temperature (Fig. 10). A plot of the Ineans on a graph indicates a linear decrease with depth from the surface to the frost table a t the 60-in. depth and a decrease of amplitude. T h e highest mean temperature for the period occurred a t the soil surface (52.9 OF) and the mean air tempera- ture in the screen (51.7 OF) was almost the same a s the ground temperature a t the 3-in. depth (51.5 OF).
Weekly readings were talren in 1960 on the three thern~ocouple strings in permafrost from the end of July to 23 September. T h e means and fluctuations of the seven \veekly sets of ground temperature readings taken in August and September 1960 are shown in Fig. 11. T h e lower summer ground temperatures under the lnoss and lichen a s compared with the sedge are immediately evident. In addition, the temperature fluctuation in the top few feet is much greater under the sedge than under the moss or lichen.
I CONCLUSIONS
1. T h e P E values computed from the evaporation recorded on the Alundum disc atmoineter and from the Penman mass transfer formula compared favor- ably with the PE measured a t the Thornthwaite installation during the 80-day
CANADIAN JOURNAL O F EARTH SCIENCES. VOL. 2. 1065
period in 1960. There was not the same good correspondence in 1959 possibly because of the short observation period, only 17 days. The P E measured a t the oil drum evapotranspirometer, and the P E computed froin the Thornthwaite formula and from the evaporation recorded a t the class A pan, were con- siderably higher than the P E ineasured a t the Thornthwaite installatioil in
1959 and 1960.
2. T h e measurement of P E by adding water t o the surface of a small plot of vegetation and recording the overflow is questionable because the daily addition of water actually changes the climate of the vegetation under test. In addition, the results do not give a true representation of the natural moisture regime. 7 6 7 4 - 7 2 - 7 0 6 8 - I I I 1 I I I I I /,. ..,> LEGEND: - : .
: .
-
SCREEN AIR TEMPERATURE/ ':: - . . . . , . . . , . . . .
-
. . . . . S O I L SURFACE T E M P E R A T U R E - i---
3 INCH DEPTH-
---
6 INCH D E P T H;
9 INCH DEPTH - 6 6 - j 12 INCH DEPTH - 3 6 INCH DEPTH - . . . . . . :: i i : . . . . . . . . : : : - : : : . . . . : . . . i : . . . . : : - ! . . . . . : :: . .. 4 2 - - 9 12 15 18 2 1 2 4 3 6 9 12 15 -AUGUST 14, 1959----+----AUGUST 15, 1959 T I M EFIG. 9. Ground temperatures a t site 1 (Thornthwaite installation) (hourly readings from 0000 on 1 4 August 1959 t o 1100 on 15 August 1959).
BROWN: PERMAFROST AT NORMAN WELLS
DEGREES, FAHRENHEIT
FIG. 10. Mean temperature of 24-hour period vs. depth a t site 1 (Thornthwaite installa- tion). (Hourly readings 0900, 14 August 1959, to 0900, 15 August 1959). Mean air temperature for this period +51.7 "F with fluctuations from 65.0 "F to 32.5 OF.
3. The use of very small test plots such a s oil drums for measuring P E is questionable because the edge effect is so pronounced that it probably changes the evapotranspiration.
4. Despite the difficulties of measuring evaporation (including P E ) , it appears that the grass-like sedge, moss, and lichen a t Norman IVells gave significantly lower P E results than the Kentucky bluegrass.
5. The economic net radiometer is a crude instrument capable only of spot measurements. A continuous recording net radiometer is required to measure the thermal energy entering the ground through the vegetative cover. I'ever- theless, from the observations taken with the economic net radiometer, it appears t h a t values are somewhat higher for Sphagnum and other mosses than for lichen. Because the ther~nal regime of the ground under moss and lichen appears to be similar, as manifested by similar depth of thaw and ground temperature regime, differences between the two plant types must occur in some other component of the energy regime which was not studied.
6. The depth of thaw under moss and lichen growing on peat was less than in areas supporting other types of plant growth.
CANADIAN JOURNAL O F EARTH SCIENCES. VOL. 2, 1965
DEGREES, FAHRENHEIT
FIG. 11. Meall ground temperatures and ground temperature fluctuations (12 August t o 23 September 1060).
7. Ground temperature observations in the thawed layer and in the peren- nially frozen ground showed that temperatures were lower in areas covered by moss and lichen than in areas supporting other types of plant growth.
The influence of climatic and terrain features is so complex and the features so closely interrelated that it is difficult to isolate each one or measure them accurately. T h e measurements a t Norman Wells, described above, were carried out t o provide some preliminary quantitative information on the relative importance of these features in the permafrost environment. More sophisti- cated instrumentation and a more comprehensive study program is required to obtain a coinplete picture of the permafrost regime and the role of the various features influencing it.
ACKNOWLEDGhIENTS
T h e author gratefully acknowledges the assistance of J. C. Plunkett, C. J.
English, and R. G. Clark in taking the daily readings. This paper is a contri- bution from the Division of Building Research, National Research Council, Canada, and is published with the approval of the Director of the Division.
BROWN: PERMAFROST AT NORMAN WELLS 31 REFERENCES
PENJIAN, H. L. 1956. Evaporation: An introductory survey. Netherlands J . Agr. Sci. 4(1). ROBERTSON, G. W. 1954. Latent evaporation: its concept, measurement and application. Paper presented 29 January 1054 a t the regular weelily seminar of the Field Ilusbandry, Soils Agr. Eng. Div., Exptl. 1;arms Serv., Dept. Agr., Ottawa.
SASDBRSON, M. 1954. RiIeasuring potential evapotranspiration a t Nor~nan Wells, Northwest Territories, Canada, 1040, 1950. I n The measurement of potential evapotranspiration,
edited by J. I<. Mather (P~tblications in Climatology, The Johns Hoplcins University, Laboratory of Climatology, Seabrooli, N.J.), Vol. VII, No. 1, pp. 84-00.
SHVETSOV, 1'. Ti. and % . ~ P O R O ~ I - I T S E V A , I. V. 1963. Povtoryayemost' i inzhenerno-geokrio- logicheskoye znacheniye dvukh-trelihlet~~ilch povysheniy t e ~ n p e r a t ~ ~ r y gruntov v sub- arktike (?'he,recurrent nature and permafrost engineering significance of 2-3 year soil temperature increases in the subarctic). Problenly Severa (Problems of the North), No. 7, pp. 2'245.
SUOMI, V. E. and KUHN, P. M. 1958. An economical net radiometer. Tellus, 10(1), 160. ~'IIORNTHWAITE, C. W. 1048. An approach toward a rational classification of climate. Geo-