by
JAN ADAM NORRIS II B.S., University of Colorado
(1977)
SUBMITTED IN PARTIAL FULFILLMENT OF THE REQUIREMENT OF THE
DEGREE OF MASTER OF SCIENCE IN
MECHANICAL ENGINEERING
at the
MASSACHUSETTS INSTITUTE OF TECHNOLOGY
June 1980
D Jan Adam Norris II 1980
The author hereby grants to M.I.T. permission to reproduce and to distribute
copies of this thesis document in whole or in part. Signature of Author
liepartmeit of Mechanical Engineering, March 28, 1980
Certified by_
Thesis-Supervisor, Accepted by
Chairman, Department Committee on Graduate Students
ARCHIVES MASSACHUSETTS INSTITUTE
OFM TECHNQLGY
JUL 29 1980
LIBRARIESCRITICAL DEPOSIT VELOCITY CORRELATIONS FOR A TURBULENT HETEROGENEOUS SLURRY
by
Jan Adam Norris II
Submitted to the Department of Mechanical Engineering on March 28, 1980 in partial fulfillment of the requirements for the Degree of Master of Science in
Mechanical Engineering ABSTRACT
Correlations for the prediction of the critical deposit velocity for a turbulent heterogeneous slurry in a round, horizontal pipe were quantitatively assessed against experimental data collected from the literature. A new correlation which is more accurate and valid over a wider range of variables than the previous correlations was developed.
Thesis Supervisor: Peter Huber
TABLE OF CONTENTS Page ABSTRACT----... 2 ACKNOWLEDGEMENTS....,... 4 LIST OF FIGURES... 5 LIST OF TABLES....,... ... 6 LIST OF SYMBOLS...,... ... ... 7 INTRODUCTION... 9 DATA BASE... 10 PREVIOUS CORRELATIONS... 15 CORRELATION OF DATA... 23 DISCUSSION... ... ... 29 CONCLUSION... 35 REFERENCES... 36 APPENDIX A... ... 39 APPENDIX B...,...,,.., 66
ACKNOWLEDGEMENTS
The author wishes to thank his thesis advisor, Peter Huber, for
the generosity of his time, as well as his helpful suggestions during
the course of this study. In addition, the author thanks Helene George for her typing efforts. Most of all, the author is indebted to his wife and family without whose understanding, patience, support, and encourage-ment, this study would not have been possible,
LIST OF FIGURES
1. Condolios and Chapus' correlation for data with d > 0.44 mm...
2. Durand's correlation for nominal C v of Spell's c Wicks' cc Fr versus Fr/g(C ) Fr versus Condolios d > 0.44 Condolios Durand's Durand's Durand's Ii orrelation. rrelation.. C ... versus d85/D.... mm...
and Chapus' coi IM...
and Chapus' coi correlation for correlation for correlation for ~fl B.6. Hughmark's correlation.,, Newitt's correlation... Zandi and Govatos' correl
10%... ...
sand-water data with ... . . . . no restrictions.... .2%... ... 5% ... 15%... ... .. . - . . . - .. 5%...,., Page 18 3. 4. 5. 6. 7. B.1. B.2. B.3. B.4. B.5. 19 20 21 27 27 28 B.7. B.8. relation for relation with nominal C, o nominal Cv ol nominal Cv ol ation... 74 75 76 77 78 79 80 81
LIST OF TABLES
Page
1. Overview of Data Base...''''' 13
2. Results of CDV Correlations... 22
3. Approximate Limiting Values of Vc/vgd85 ''''''''''''''''''''''''' . 30 A.1 List of Computer Variables... 40
A.2 SLYC Values... 41
A.3 VELC Values... 42
A.4 PMAT Values... 44
A.5 SORC Values... ... .9- . 45 A.6 Proposed Correlation Data...,... 47
LIST OF SYMBOLS
CDV critical deposit velocity
CD particle coefficient of drag
C, v concentration by volume percent
d nominal particle diameter
d8 5 particle diameter such that 85% of particles are smaller
D pipe diameter
Fr Froude number, Vc//gd85 g acceleration due to gravity J head loss gradient for a slurry J w head loss gradient for water
Re particle Reynolds number, d85v'gd85v
ReD pipe Reynolds number at deposit conditions, Vc D/v
v average fluid velocity a distance y from pipe wall at deposit conditions
V average flow velocity in pipe V c critical deposit velocity
x relative error between predicted and measured V ,
Cpredicted Vc - measured V c)/measured V c
x mean of x
S standard deviation of x
A Darcy friction factor
v kinematic viscosity of fluid
T 3.142...
Pf fluid density
Ap s "
Pf
T wall shear stress w
INTRODUCTION
The conveyance of solid particles in a liquid is an established application of two phase flows with particular relevance to chemical, lumber and mining industries. There is not, as of yet, a unified theory at the engineers' disposal that can fully describe the two phase flows
involved. Most of the information required for slurry pipeline design
is obtained from empirical or semi-empirical results. Available
empirical correlations for key design quantities such as head loss and deposit velocities show considerable discrepancies.
When solid particles in a slurry are large enough or have a high
enough density, turbulent flow will fail to keep the particles homogeneously distributed in a horizontal pipe. The result is a heterogeneous flow in which there is a radial density or concentration gradient across the pipe. Under certain flow conditions, the solid particles will settle out of the
flow altogether. These particles can skip (saltate), roll or form
stationary bed deposits. The average pipe velocities for which the three deposit modes occur are different, but the generic term "critical deposit
velocity" or CDV (also denoted V c), has been applied collectively to these velocities.
This study is focused on critical deposit velocity prediction, based on empirical correlations, for turbulent, heterogeneous slurry flows in
horizontal, round pipes. Selected existing correlations are quantitatively reviewed and a new correlation is developed for CDV prediction.
DATA BASE
From the literature, we collected a comprehensive body of CDV data. The data was available from two basic types of sources. First, works in which the express purpose was to investigate the CDV, generally offered explicit CDV values. In addition, experimental works on the more general problem of head loss in slurry flow indirectly generated CDV data.
Specifically, when the head loss for a heterogeneous slurry is plotted against the mean flow velocity, V, a minimum head loss value can often be identified. As noted by several authors, (2,5,7,8,11,18,21) the
transition from flow with deposits to flow without deposits occurs in the vicinity of this minimum.
There are basically three different characteristic velocities in the literature which have been loosely termed "critical velocity." They are the transition velocity from laminar to turbulent flow, the critical deposit velocity, and the "standard velocity." The latter is defined by Spells(23) as "the mean velocity of flow at which the pressure gradients for the slurry and its equivalent true fluid become identical," where the true fluid has a "density equal to that of the slurry and viscosity equal
to that of water, flowing under the same conditions."
The criteria for CDV used by various authors, who actually reported
CDV values, differ in detail. For example, some definitions for the CDV are very specific: the transition velocity from flow with a stationary bed to flow with a saltating or thin sliding bed (thin whisps of moving material on the pipe floor), (3,20,24) or the transition velocity from flow with a sliding or saltating bed to flow with no deposits of any
velocities, (4,14,16,19) there was, for the most part, only a slight difference between the two values. In this case, we used the velocity associated with the transition from the stationary deposit mode to the sliding or saltating mode. More often, though, CDV was simply defined
by researchers as the transition velocity from flow with deposits to flow
without deposits. (6,7,8,10,22,25) Several researchers reported or implied that the flow can pass from the deposit mode to the non-deposit mode with negligible sliding bed or saltation modes occuring.(2,4) For the CDV data inferred from head loss curves, (2,5,9,11,12,17,18,21,29) it was not
possible to differentiate between the stationary bed, sliding bed and no deposit flow regimes.
The second major problem we encountered in collecting data was deter-mining an appropriate value for the particle diameters used in various works. Most test particles were irregular in shape and the authors pro-vided only a loosely defined "average diameter." In addition, authors generally reported only a nominal value for d which we used directly.
Some authors, though, described the size distributions of the particles.(3, 4,12,14,15,17,18,20,21,22) In such cases, the diameter, d, for which, cumulatively, 85% of the particles are smaller (denoted d85) was chosen
as characteristic. This bias toward larger particles seemed appropriate because it is the larger particles which settle out of a slurry first. When only sieve sizes were reported, it was still possible to arrive at a reasonable estimate for d85' (2,5,9,16,19) For some materials, such
as coal, the problem of particle degradation as a result of impingement upon the pipe wall is well known. Most of the workers who used degradable materials gave no indication as to the extent of degradation that occurred during their experiments. For the few authors that did supply such
information, (4,20) d8 5 values from before and after the experiments were
used to calculate an average d8 5'
Other pertinent physical properties of the particles, fluid and pipe, as well as the slurry concentration by volume percent, Cv, were also collected.
Table 1 is a condensed overview of the data collected. Listed by author, is information on pipe material and diameter, CDV definition and
range, and the range of physical properties of the solids and liquids
tested. Appendix A contains information on how the collected data were
stored in computer files as well as the digitized codes used for identify-ing the slurry combinations, CDV definitions, pipe materials and references
associated with the data points.
Questionable, incomplete, or duplicate data points were not included in the final set of data. If the value of any of the key variables
identified later was not reported, the datum was discarded. Data presented in dimensionless terms that could not be redimensionalized were also
rejected. In all cases, we attempted to derive data from original sources rather than secondary sources. In all, we collected 380 useable data points from 29 authors who had tested 14 different slurry combinations.
TABLE 1. Overview of Data Base
NUFER Ranne of Variabl
s (Low and Hinh)
REFERENCE SLURRY CDV PIPE POINTS C P p d D V
COMBINATION DEFINITION 1ATERIAL USED V S _, f _ 3 D- CO'flENTS _______ _______(vol.9) (kn -m3) (k - m ) (in) (mn) (in- s )
Spels Lime-Water Suspension Unknown 2 5.3 .0 x10 x 10 3 .0 x 10- 9 4 x Ir-2 0.28
not maintained 10 1.6 x 10~ 1. x 10~1 0.41
Sand-Water Suspension Unknown 13 2.0 2.6 x 10³ 1.0 x 10³ 2.5 x 10~ 7.6 x 10⁻² 0.82
not maintained 50 3.2 x 10~ 3.0 x 10~1 2.7
W(c Sand-Water No deposits ?lexiglas 2 1.0 !.6 x 103 1. x 2.5 x 10~ i 7 x i 2 046
1.4 x 10~ 0.79 Sand-Kerosene No deposits 3lexiglas 1 1.0 2.6 x 10³ .. 6 x 10² 2.5 x 10~4 2.7 x 10⁻² 0.61
Sand-Oil No deposits 3lexiglas 4 1.0 ?.6 x 103 2x 2.5 x 10~4 2.7 x 10¹² 1.56
1.4 x 10~1 1.4
3 3 4 1Quote from
Yotsukura Sand-9ater No Stationary Unknown 13 5.0 ?.6 x 10 1.0 x 10 2.3 x lo 1.1 x 1ol 1.8 4asn et al.
(24) Bed 25 1.2 x 10 3.0 (24)
Sinclair Sand-Water Few Stationary Brass 9 2.5 2.6 x 10³ 1.0 x 10³ 4.6 x 10~4 1.9 x 10⁻² 1.1
(20) Particles 15 1.2
Iron-Kerosene Few Stationary Brass 14 0.3 7.5 x 10³ 7.8 x 10² 1.4 x 9-4 1.9 x 1-2 1.85
Particles 18 1.6
Newitt el al. Sand-Hater H.L. Min. Brass 17 5.0 2.5 x 10³ 1.0 x .03 2.1 x 10- 2.5 x 10² 79
35 2.6 x 10³ .8 10 _ _ 1.4
Durand Sand-ater No deposits Unknown 7 2.5 2.6 x 10³ 3 A.2 x 103 1.5 x 10~ 2.7
(8) 15 2.0 x 10 3.1
3 Ouote from
Wi son Nylon-Water No deposits Plastic 3 5.0 1.1 x 10³ 1.0 x 10³ 3.9 x 1 8.8 x 10⁻² 0.53 Graf et al
(10) 10 (10)
Worster and
Denney Coal-4ater H.L. Min. Steel 7 5.0 1.5 x 10³ in 1.3 3.x x Io-2 7.6 x 10~2 0.75
(29) 20 3.8 x 10⁻² 1.5 x 10~1 1.4
eeber Sand-Water No deposits Steel 80 5.0 2.6 x 10³ 1.0 x 13 2.8 x 10~ 4.2 x 10⁻² 0.60
et5)20 3.9 x 10~3 2.1 x 10 3.2
Plastic-Water No deposits Steel 4 5.0 1.1 x 10³ 1.0 x 10³ 2.5 x 10~ A.2 x 10-2 0.25
25
Coal-Water No deposits Steel 8 5.0 1.5 x 10³ 1.0 x 10³ 2.0 x 10³ .2 x 102 .50
1.
x0 2 '. a 11 .5 25 1.3 x 1 7 2.1 x 10 2.7
Iron-Water No deposits Steel 6 5.0 1.6 x 10³ 1.0 x 10³ 2.2 x 4.2 x I 2.9
25
Blatch Sand-later H.L. Min. Brass 8 5.0 2.6 x 10 1.0 10 1.8 10 .7 x 10-2 0.03
(2) 25 5.9 x 10 1.3
Smith Sand-Water No Settling Steel 45 0.25 2.6 x 1 3 1.0 x 10 2.5 x 10 5.1 x 10⁻² 0.69
(22) 33 2.0 x 10 7.6 x 1f-2 1.8
Bruhl and Sand-Water No Stationary Unknown 7 6.0 2.6 x 10.3 10 - 4.7 x lo 1.0 x 10⁻¹ 1.7
Kazanskij . Bed 30 1.0 x 10 2.0
-(3)1 I
Kenchington Sand-Water No Stationary Perspex 3 4.0 2.6 x 10³ 1.0 x 10³ 7.5 x 10⁴ 1.3 x 10~ 0. 53
(16) Bed 6.2 5.1 x 10⁻² 1.2
Prettin and Coal-Water H.L. Min. Unknown 14 5.0 1.A x 103 1.0 x 10³ 4.6 x 10 .4 x 10' 0.17
Raessler 50 1.6 x 10 1.0 x 10 .0x 10~ .4 2.9
(18)1.x1030x1
29
ilson and Sand-Water No Sliding Perspex 5 1.0 2.7 x 10³ 1.0 x 10³ 6.9 x 1 A .8 x 10-2 1.6
rebner Bed 15 1.8
(27) 1
hiu nd Glass-Water No Deposit Plexinlas 2 1.7 ?.9 x 1n3 1.0 x 10³ 1.4 x 10⁻³ .1 x 10-2 4.3
eman, 4.9
(6) 1 1
'azanskij Sand-'later No Slidino Unknown 0 4.6 ?.6 x 103 1.0 x 10³ A.7 x 10-4 1.0 x 10~1 2.1
?t al. Bed 26 1.0 x 10~ _ 2.q
addick Coal-Water H. L. Min. Steel 2 41 .3 x 103 1.0 x 10 6.7 x 10⁻³ 1.6 x 10⁻¹ 1.6
t al. 53
TABLE 1. (Continued)
NU11BER Panne of Variables (Low ard Hiah)
OF
REFERENCE SLURRY CDV PIPE POINTS v sd V
COMBINATION DEFINITION fiATERIAL USED (vol. B) (kn -m~') (kg -m~ ) (m) (m) (m . s~'l Hayden aid Sand-Water H.L. Min. Unknown 12 4.0 2.6 x 10³ 1.0 x 1 8 2.5 10~ 0.90
Stelson 29 2.7 x 10 3.7 x 10³ 5.1 x 10~2 1.7
(11) ____________ 1_______ -__________
1.Ox Dx 3 ~~.Ox 1 uote from
FUhrbdter Sand-Water No deposits Metal 11 5.0 2.6 x 10³ 1.0 x 10³ 1.9 x 10 3.0 x I1raf et al.
(10) 15 3.3 x 10 4.2 (10)
Sassoli Sand-Water No deposits Steel & 12 5.0 2.6 x 10³ 1.0 x 10³ 2.3 x 10 5.1 x 10~ 1.2 Draf et al.
(10) Plastic 15 8.3 x 10⁴ 8.0 x 10~2 2.0 (10)
Condolios and Sand-Water No deposits Unknown 11 2.5 2.6 x 10³ 1.0 x 1 4. a3 x 10 .5 x 101 2.2
Chapus 15 2.n x 10 2.6
_(7)1 -3
Singh and Sand-Water H.L. Min. Lucite 2 15 2.6 x 10³ 1.0 x 10³ 2.6 x 10- 4.8 x 10⁻² 1.4
Charles 5.1 x 10 1.8
(21)________________
Charles Sand-Water H.L. Min. Lucite 4 5.0 2.6 x 10³ 1.0 x 10 2.6 x 10f- 5.1 x l-2 0.80
et al. 1 5.1 x 10 1.5
(5)
Cairns Talc-Water No Stationary Dicon 4 3.5 2.7 x 10³ 1.0 x 10³ 3.0 x 10⁻⁵ 1.9 x 10~2 0.36
et al. Bed 5.1 x 10 2 0.42
(4) 1-
-Barium No Stationary Dicon 4 2.6 4.5 x .1 x 10-6 1.9 x 10² 0.42
Sulfate- Bed 5.1 x 10 0.53
1.9 x 10² 0.53
Lead-Water No Stationary Dicon 4 1.4 9.1 x 10³ 1.0 x 10³ .4 x 10-6 5.1 x 10⁻² 0.74
Bed Tungsten-Water Iron-Water Sand-4ater Sand-Water No Stationary Bed No Stationary Bed No Stationary Bed H.L. Min. Dicon Unknown 5 12 I I II Unknown Unknown 7 0.51 5.3 38 5.0 42 5.2 x 10³ 1.0 x 10³ 1.5 x 10- 5.3 x 10 5.2x0 3.2xx 10 2.6 x 10³ 1.0 x 10³ .3 x 10-A 8 10 2.6 x 10 3 1.0 x 10 3 1 30 1 380 0.25 53 1.1 x 10⁴ 1.9 x 10 7.8 x 10³ 1.0 x 10 5.2 x 10⁻² 0.77 0.94 0.79 2.3 1.2 1.4 ?.6 x 104 1.0 x 10 1 1.7 1.3 x 10 2.9 1.4 x 10 3.8 x 10 2 1.3 x 10 3.2 x 101 0.174.3 Husband et Shook (19) Howard (12) Total i 1 i I I I 1.9 x 10⁴ 1 .0 x 103 7.9 x 10⁻⁶ 51 x 10 2
PREVIOUS CORRELATIONS
Certain correlations for CDV prediction are most widely cited in the field. Seven of these have been assessed against the data base we have assembled. We present here some sample graphical comparisons and our quantitative appraisal of each of these correlations.
Condolios and Chapus() presented a graphical correlation for determining Vc for sand-water slurries which can be accurately approxi-mated by a logarithmic curve. Their original correlation included no
solid or liquid density dependence. We have modified it by introducing a Ap/pf dependence of the most commonly used form, resulting in
Vc p/p = (1.13 + 0.228 kn Cv) (d/D)6V2
for d > 4.4 x 10~4m. Figures la and lb compare experiment and prediction based on this correlation. The first figure includes only the authors' data, while the second includes our entire data set.
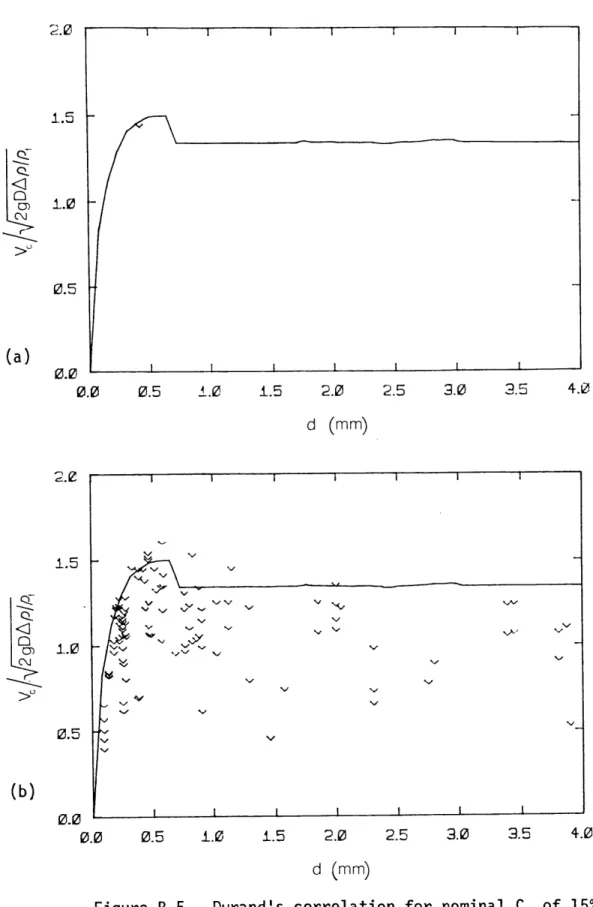
Durand(8) proposed a correlation that graphically relates a modified Froude number, V //2gD Ap/pf , to particle diameter, d, with concentration,
cf
Cv, as a parameter. For d > 1 mm, Durand suggested that Vc//2gD Ap/p =1.34. We have approximated his curves, piecewise, with simple power, exponential, and logarithmic functions. Figures 2a and 2b illustrate his prediction versus the experimental data for a nominal concentration of 10%.
Spells(23) collected data from other workers and gave the correlation
tog(Vc2/(gd Ap/pf)) = 0.775 tog(VcDp'/vpf)- 1.6 (2)
where p' equals the average slurry density, (Cvps +(100 - C v )p )/100.
Wicks (26) proposed a correlation that can be reduced to
PfdVc 2gvAp = 0.1((DVc/v)(d/D)2P)3 (3a)
for (DV c/v)(d/D)1 < 40 and
Pf dVc 2gvAp = 100((DV c/v)(d/D)/) 3V2 (3b)
for (DV c/v)(d/D)213 > 400. Figures 4a and 4b compare prediction and experiment.
Other correlations that we have examined are those of Newitt et al.(17) Zandi and Govatos(30) and Hughmark.(13) The graphical comparisons of
experiment and prediction for these workers are presented in Appendix B. Newitt et al. suggested that
V = 17W (4)
where W is the particle's settling velocity.
Zandi and Govatos collected data from other sources and suggested that Vc be predicted from
Vc2
v//(CvgDAp/pf) - 0.4 (5)
where CD is the particle's drag coefficient.
Hughmark assembled standard velocity, Vs, data from the literature and presented a graphical correlation which is included here since it is often cited as a CDV correlation. It can be approximated as
Vs//#U = 1.04(CvFd AP/Pf)0 ''4 7 (6a)
for CvFd AP/Pf 5 1, and
V s/lY= 1.07 + 7.85 x 10⁻²(CvFd AP/Pf) - 1.06 x 10⁻³(CvFd AP/Pf)2
for C Fd AP/Pf > 1, where
Fd = 2715d for d < 3.68 x 10~4 m and
Fd
1
for d > 3.68 x 10~4 m. We note, however, that the standard velocity has a definition quite different from the critical deposit velocity and
according to the data presented by Spells, is typically 100 to 150% higher than VC'
To quantify the accuracy of the various proposed correlating
equations, we have evaluated the mean, x, and standard deviation, S, , of the relative errors between the measured and predicted Vc, where
x = (predicted Vc -measured Vc )/measured Vc' Table 2 summarizes these
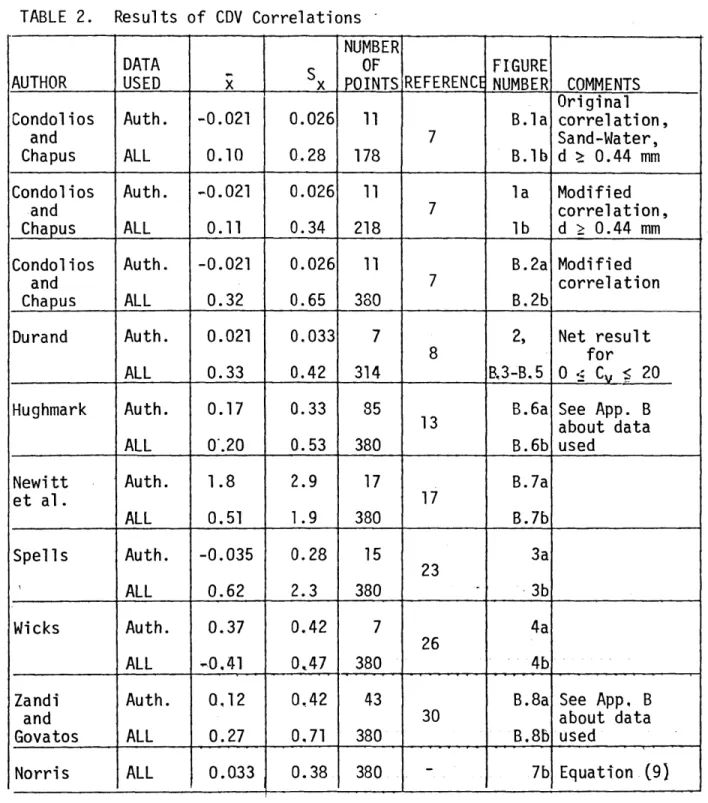
results for the seven correlations reviewed. Also included are the corresponding figures and number of data points. The correlations over-predict Vc, typically by about 20 to 30%, with a high of 60%. The
standard deviations of the relative errors range from 30% up to 230%, with the majority being above 40%.
II
I I I I I I I I
(1.13 + 0.228 In C) (d/D)"2
(1.13+ 0.228 In C) (d/D)Y/2
Condolios and Chapus' correlation for data with d > 0.44 mm: (a) Condolios and Chapus'
data; (b) Entire data set. 0~ -o 0) >0 10, (a) 0) >P I-0, (b) Figure 1.
0.5 1.0 1.5 2.0 2.5 3.0 3.5 4.0 d (mm)
0.0 - I I
0.0 0.5 1.0 1.5 2.0 2.5 3.0 3.5 4.0
d (mm)
Durand's correlation for nominal C of 10%: (a) Durand's data; (b) Entire data set.
2.0 1.5 1.0 0.5 C. (a) 0.0 0.0 2.0 1.5 1.0 > 0.5 (b) Figure 2.
.4 10 -o C3> (a) 4 10 i-00 4 10 15 V D P'vP,
correlation: (a) Data
(b) Entire data set.
collected by .10
I 1111 l I 1 1 1 1111 I 11I I fill I III I
vD/o
.4
CE -o 40 101 (b) Figure 3, Spells' Spells; 10710 1010 CD >0 QC - 1111111 11111 I 1 1111 il i ii11| I* KL 4L 10 -10, 10 105 (d/Dy3 DV/ v 1010 >0 4 10 (b) 103 lt 0 103 104 (d/D'3 D\/ v
Figure 4. Wicks' correlation: (a) Wicks' data; (b) Entire data set.
(a)
TABLE 2. Results of CDV Correlations
NUMBER
DATA S OF FIGURE
AUTHOR USED x x POINTS REFERENCE NUMBER COMMENTS
Original Condolios Auth. -0.021 0.026 11 B.la correlation,
and 7 Sand-Water,
Chapus ALL 0.10 0.28 178 B.lb d 0.44 mm
Condolios Auth. -0.021 0.026 11 la Modified
and 7 correlation,
Chapus ALL 0.11 0.34 218 lb d 2 0.44 mm
Condolios Auth. -0.021 0.026 11 B.2a Modified
and 7 correlation
Chapus ALL 0.32 0.65 380 B.2b
Durand Auth. 0.021 0.033 7 2, Net result
8 for
ALL 0.33 0.42 314 B.3-B.5 0 _
C,,
5 20Hughmark Auth. 0.17 0.33 85 B.6a See App. B
13 about data
ALL 0'.20 0.53 380 B.6b used
Newitt Auth. 1.8 2.9 17 B.7a
et al. 17 ALL 0.51 1.9 380 B.7b Spells Auth. -0.035 0.28 15 3a 23 ALL 0.62 2.3 380 3b Wicks Auth. 0.37 0.42 7 4a 26 ALL -0.41 0,47 380 4b
Zandi Auth. 0.12 0.42 43 B.8a See App, B
and 30 about data
Govatos ALL 0.27 0.71 380 B.8b used
CORRELATION OF DATA
In general, heterogeneous slurry flow in a horizontal, round pipe might
be characterized by ten variables. Pipe parameters include the pipe dia-meter, D, and the pipe material. None of the previous correlations that we studied included the latter as an important independent variable.
Although we did record pipe material in our data files, we could find no effect on CDV and therefore, it does not appear in the correlation we
propose. The carrying fluid is characterized by its density, pf, and
viscosity, v. While assembling our data, we did record values of v but
ultimately found no dependence of CDV on this variable. Solid parameters
consist of density, ps, and particle diameter, characterized by d8 5. We made no attempt to account for either particle shape or the width of the
size distribution. Operating parameters include the average flow velocity in the pipe, V, the amount of solids in the slurry, measured here by Cv, and the acceleration due to gravity, g. Thus, we had six independent
variables with which to determine the critical deposit velocity, Vc, namely
C, p , ps, d8 5, D, and g. Replacing ps with Ap = ps - Pf, a definition suggested by buoyancy considerations, and non-dimensionalizing results in three dimensionless independent variables which we define as
Fr = Vc//gd85 = F(Cvqd8 5/D, Ap/pf)
The variable v was originally included in a dimensionless independent variable defined as Re = d85/d85g/v. However, we could establish no dependence of Fr upon Re.
For the data we collected, the ranges of all the variables are
2.5 x 10~'< C < 5.3 x 101
8.7 x 10~5 < d8 5/D < 3.0 x 101
1.0 x 10⁻¹ <Ap/pf < 1.8 x 101
2.9 x 10~ < Re < 2.3 x 10'.
To examine the effect of C , upon Fr, we plotted kn Fr against kn Cv with the remaining independent variables held constant. The result was similar to Figure 5. The curves were basically of the same shape, but were shifted as a function of the values of the remaining independent variables.
On this basis, we arrived at the functional form
Fr = g(C )-f (A/p , d85/D) where
g(C) exp(b 9n C, - b2(9n Cv )2)
Obtaining estimates of b and b2, using sample curve fits, resulted in
b 1 =0.3 and b2 : 0.06.
At this point, kn(Fr/g(C )) was plotted against kn(d8 5/D), resulting
in a graph similar to Figure 6. Three basic groups of points were pro-minent, each corresponding to one of the three main slurry combinations in
our data bank, namely, coal-water, sand-water, and higher density difference combinations such as iron-kerosene, and iron-water. Although the domains of d8 5/D for the three groups were not the same, it appeared that the
points fell on different portions of the same family of curves. These
curves can be reasonably approximated by g(C )/Fr = C1 + C2(d85/D).
it is Ap/pf which determines C, and C2. Estimates of C1 and C2 for different values of Ap/p indicated that
C1 = b3(AP/Pf)b 4
and
C2 = b5(AP/Pf)b 6
where b3 s 0.03, b4 ~ 0.04, b5 ~ 7 and b6 1.
Performing an iterative least squares regression on
Fr = exp(b In Cv - b2 (9n C)2) () b3(Ap/Pf) b4 + b5 (AP/Pf) b6 (d85/D)
using the initial estimates listed for b through b6, resulted in
Fr = exp(0.316 En C - 0.0637 (9,n C )2) (8)
0.0262 (Ap/pf) 0.0 353 + 6.86 (Ap/pf)10'7 (d
85/D)
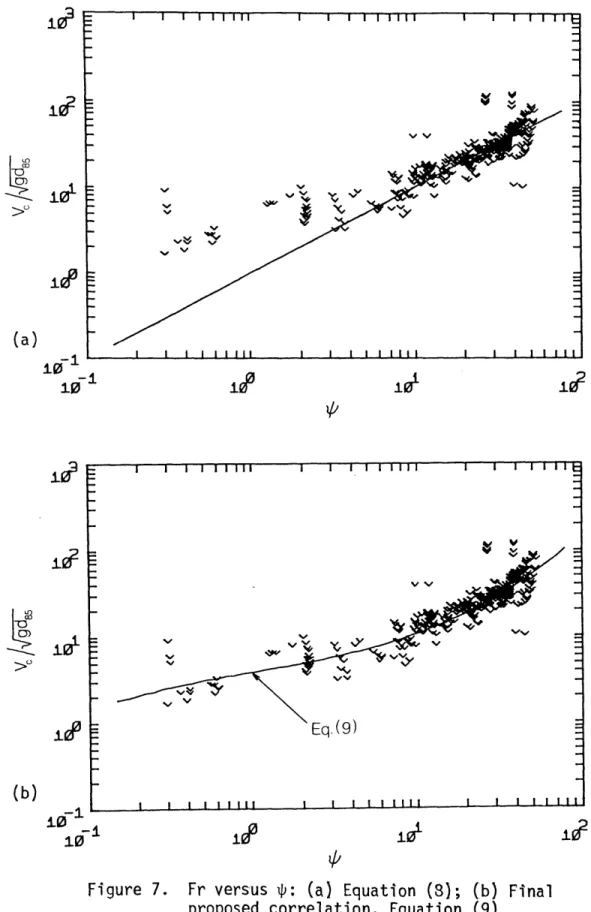
The right-hand side of equation (8) will henceforth be denoted as IP. Figure 7a illustrates equation (8) plotted against our data base.
Due to the large number of points at higher Fr values, the constants in equation (8) were biased in favor of those same points. As a result, equation (8) correlates the data better than it predicts the data. Using
p as a variable, a simple correction was made resulting in a more accurate predicting equation, specifically
kn Fr = 1.36 + 0.314Zn i + 0.0227kn3 ip (9)
Figure 7b compares equation (9) to our data base.
The values of x and S for equation (9) are x= 0.033 and S = 0.38
and have been included in Table 2. These values, when compared with the others in Table 2 (those evaluated with all 380 points), are seen
to be the smallest. The next closest values are 0.20 (Hughmark (13)) for R and 0.47 (Wicks (26)) for S . Note that Condolios and Chapus' (7) correlation yields x = 0.10 and S = 0.28, but these values are for
In C, Figure 5. Fr versus C . decreasing Ap/p In (d,/D) Fr/g(C ) versus d 85D. Figure 6.
J-03 I I I 111111 V V V V ~ %*v ~ I I I I I I I I I I I 11111 I I I I I11111 1t 70 0 (b)
-JO-1 10
Figure 7. Fr versus $: (a) Equation (8); proposed correlation, Equation
>0 10 (a) 10 10 J02 .40 I I I I11I1 -vv Eq. (9) I 11 I I 11 I I I 111 i 1 I I I 1 .11 (b) Final (9). I ll~E]~T1T V %, %d%.~ V
DISCUSSION
Equation (9) can be simplified somewhat for various limits of the independent variables. Examination of the denominator of $ indicates that for the d8 5/D term to be dominant,
d85/D > (3.8 x 10⁻³ (p/pf)1.
This condition will be referred to as "large d8 5/D" and similarly,
d8 5/D < (3.8 x 10~' ) will be referred to as "small d85/D.1"
(AP/Pf) 1-1 Thus
*+g (CvA/pf)I'"'(d 85 /D) /6.86
for large d8 5/D and
1 - g(C)(AP/P)-0.0 3 5 3/0.0262
for small d8 5/D. The numerator of $ can also be simplified depending
upon the value of C,. Specifically,
g(C
v)
z (C )0.316for 0.25 < C < 3 and g(C ) ~ 1.46
for 6 < C < 25. To make the limiting values of equation (9) more obvious,
it is convenient to approximate it as Fr ~~ 1 .18($ )0-5 for ib < 30 and Fr z 0.16($)1-5 for iP > 30. (1Oa) (1Ob) (lla) (llb) (12a) (12b)
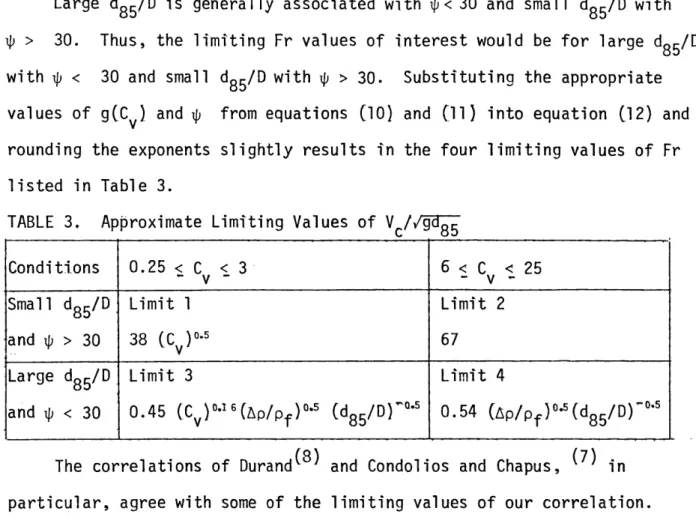
Large d8 5/D is generally associated with p< 30 and small d85/D with
> 30. Thus, the limiting Fr values of interest would be for large d85/D
with
p
< 30 and small d8 5/D with i > 30. Substituting the appropriatevalues of g(C ) and p from equations (10) and (11) into equation (12) and
rounding the exponents slightly results in the four limiting values of Fr listed in Table 3.
TABLE 3. Approximate Limiting Values of Vc /T 8 5
Conditions 0.25 < C < 3 6 < C < 25
Small d8 5/D Limit 1 Limit 2
and p > 30 38 (C )0-5 67
V
Large d8 5/D Limit 3 Limit 4
and i < 30 0.45 (Cv )0.16 (AP/Pf )M'. (d8 5/D)E0' 0.54 (Ap/pf)0-5(d85/D)'"
The correlations of Durand(8) and Condolios and Chapus, in particular, agree with some of the limiting values of our correlation. Durand's correlation of VPf = 1.34, for d > 1 mm, is equivalent to
V c//yT = 1.9(Ap/pf)-s (d/D)~- 5 .
Except for a multiplicative constant, this is identical to limit number 4 for our correlation. In his paper, Durand reported that his work had been conducted with Ap/pf values ranging from 0.5 to 2.95 and pipe diameters ranging from 40 mm to 700 mm. Substitution of these values into 1p will show that ip < 30 if d8 5/D > 0.01 for any C . Thus, the most stringent condition on d85 is that d85 > (0.01) 700 mm = 7 mm, which is in order of magnitude agreement with Durand's condition that d > 1 mm. Note that the
In Condolios and Chapus' correlation, equation (1), the term
1.13 + 0.2289.n C can be well approximated by 1.12(C )o.2 for 0.25 < C < 3
and 1.22(C )013 for 6 < C < 25. As a result, their correlation could be
V V.
written as
Vc/Vgif = 1.12(C ).2 (AP/pf)0o (d/D) 0 5
for 0.25 < Cv < 3 and
Vc//gd
= 1.22(C )O.13 (Ap/Pf)-5 (d/D)' 5for 6 < CV < 25. Again, these are similar in form to limits number 3 and
4 in Table 3. Having worked with the same variable ranges for Ap/pf, d and D as Durand did, the requirement for i < 30 is again d85 > 7 mm compared
to d > 0.44 mm given by Condolios and Chapus.
It is possible through rather simple considerations to arrive at a crude model for the CDV. This model, though not useful for quantitative predictions, provides some insight into the problem and allows for order of magnitude estimates.
A particle of diameter d, sitting on the floor of a pipe -of diameter D, has zero velocity at its point of contact and a higher velocity at its
top than the local average velocity, v. The pressure difference between the bottom and top goes roughly as
(pbot - Ptop) - c1Pfv2/2
where c1 is a constant of order one. Summing the pressure, buoyant and gravitational forces and assuming that the pressure forces can be approxi-mated as pir(d/2) 2 results in
v//yif = c2VAP/Pf (13)
A simple correction can be made to relate the local velocity near
the particle, v, to the average pipe flow velocity, Vc, depending upon whether or not the particle is submerged in the laminar sublayer. The particle will be submerged in the laminar sublayer if
dwr f/v < 5
and protruding into the logarithmic overlap layer if dhTpf/v > 30
where Tw is the wall shear stress. These conditions reduce to d/D<25ReD7/8 and d/D > 150ReD718 respectively upon using the Blasius approximation for
the friction factor A = 8Tw pf
V
2= 0.316ReD
where ReD = VcD/v. Calculations of ReD from our data bank indicate that, for the most part, 10' < ReD< 106 at critical deposit conditions. Since the Blasius equation is only about 15% low at the upper limit of ReD = l '6 it should suffice for the purposes here. Substitution of typical Re D values yields the rough estimates of d/D < 10-3 for the particle to be in the laminar sublayer and d/D > 102 for the particle to protrude out of the
laminar sublayer.
Now, assuming the particle is submerged in the laminar sublayer, the average local velocity that the particle is subject to is
v ~ yV c2 A/8v
where y ad/2 and A 0.316Re . Substituting these into equation (13) and noting that ReD FrReCd/D)V results in
Fr = c3(Ap/Pf)2 (d/D)"' (Re)Y3 (14) where constant c3 is of order ten.
Similarly, if the particle is out of the laminar sublayer, then the
velocity profile might be approximated by the power law v = 1.22V c(2y/D)P .
Substitution into equation (13) yields
Fr = c4(Ap/pf)/(d/D)'? (15)
with constant c4 of order one.
Evaluation of equations (14) and (15) with typical values of Ap/pf,
Re and d/D, with appropriate restrictions on the latter variable, shows that equation (14) generally indicates Fr values of order ten while
equation (15) yields a Fr of order one. These order of magnitude results are consistent with our data and therefore also with the limiting forms
of our correlation in Table 3.
The dependence of Fr upon the independent variables in Equations (14) and (15) shows both similarities and differences compared to our correlation.
Equation (15), for particles protruding into the logarithmic overlap
(associated with large d8 5/D), indicates a dependence upon (Ap/pf)l/ as do
limits 3 and 4 for our correlation. Similarly, equation (14), for particles in the laminar sublayer (associated with small d85/D), shows a reduced
dependence on Ap/pf while limits 1 and 2 indicate negligible Ap/pf
dependence. The d/D dependence in equations (14) and (15) differs from
our correlation. In both equations (14) and (15), d/D appears as (d/D)~/, whereas our correlation indicates no d8 5/D dependence for small d8 5/D,
and a (d8 5/D)V/ dependence for large d8 5/D. The exponent of -1/7 for
d/D is, however, between the exponent values of 0 and -1/2 given in Table 3. One interesting, though not surprising result in equation (14), is
sublayer, ie.,when d/D < 10. It was noted that we could find no significant Re dependence when developing our correlation. This may be due to the fact that less than ten percent of our data had d8 5/D < 10-3
Had there been significantly more data for d85/D < 10-3, a Re dependence
might have been observed.
Examining, in physical terms, how CDV should behave for various limits of the independent variables is not only instructive in itself, but reveals further peculiarities in our correlation. Considering, first, Cv, it is reasonable to expect V c to become independent of concentration for very
low concentration values. As C approaches zero, Vc should approach the critical deposit velocity required to keep a single particle in suspension (assuming that d/D is finite). Examination of our correlation, equation
(9), indicates that Fr approaches zero as Cv approaches zero.
As Ap/pf approaches zero, one has the limiting case of a neutrally
buoyant particle for which the CDV has value of zero. Equation (9) pre-dicts a Fr of zero for this case.
One final limiting case of interest is that of d/D approaching zero. As d/D approaches zero, the pipe, as far as the particle is concerned, appears to be a flat plate, in which case Vc should become independent of the pipe diameter, D. In turn, one would expect an added dependence upon v. Specifically Fr would become a function of Re. Our correlation, though not indicating a Re dependence, does predict that Fr becomes
independent of d85/D as d8 5/D becomes small.
Equation (9) does not give results that might be expected from a physical viewpoint for all the extreme variable limits, It is an empirical correlation valid only for the variable ranges imposed by the data from which it was derived.
CONCLUSION
With 380 critical deposit velocity data points collected from literature, we have quantitatively reviewed the CDV correlations of seven authors. Also presented, were graphical comparisons of the correlations using, first, the authors' own data and then our entire data bank.
The results of this study have verified the dependence of Froude number, Vc vg 85, upon the concentration, Cv, the relative density
difference between the solid and liquid, Ap/pf, and the ratio of particle to pipe diameter, d8 5/D. Analysis of our collected data yielded a new
empirical correlation, equation (9), for the prediction of the critical deposit velocity for turbulent, heterogeneous slurry flow in a round, horizontal pipe. This correlation is more accurate and valid over a wider range of independent variables than the previously developed correlations.
REFERENCES
1. Babcock, H.A., "Heterogeneous Flow of Heterogeneous Solids," Advances in Solid-Liquid Flow in Pipes and Its Applications, I. Zandi, ed.,
Prgamon Press, Oxford, England,197, pp. 125-148.
2. Blatch, M., "Discussion: Water Filtration at Washington, D.C.,
Transactions, American Society of Civil Engineers, Vol. 52, 1906,
pp. 400-408.
3. Bruhl, H., and Kazanskij, I., "New Results Concerning the Influence of
Fine Particles on Sand-Water Flows in Pipes," Proceedings of
Hydrotransport IV, Fourth International Conference on the fydraulic Transport in Pipes, BHRA Fluid Engineering, May, 1976, pp. B2-19-28. 4. Cairns, R.C., Lawther, K.R., and Turner, K.S., "Flow Characteristics of Dilute Small Particle Suspensions," British Chemical Engineering,
Vol. 5, Dec., 1960, pp. 849-856.
5. Charles, M.E., Chen, C.H-S., and Chu L., "The Flow of "Settling"
Slurries in Tubes with Internal Spiral Ribs," Canadian Journal of
Chemical Engineering, Vol. 49, 1971, pp. 737-741.
6. Chiu, C-L., and Seman, J.J,, "Head Loss in Spiral Solid-Liquid Flow
in Pipes," Advances in Solid-Liquid Flow in Pipes and Its A lications, I. Zandi, ed., Pergamon Press, Oxford, Engiand, 19717 ~p 227-235.
7. Condolios, E., and Chapus, E.E., "Solids Pipelines: Transporting Solid
Materials in Pipelines," Chemical Engineering, Vol. 70, No. 13, June,
1963, pp. 93-98.
8. Durand, R., "Basic Relationships of the Transportation of Solids in
Pipes-Experimental Research," Proceedings, Minnesota International Hydraulics Convention, September, 1953, pp. 89-103.
9. Faddick, R.R., et al., "Application of Slurry Pipelining Technology to
the Maritime Industry," Proceedings of Hydrotransport IV, Fourth International Conference on the Hydraulic Transport in Pipes, BHRA Fluid Engineering, May,1976, pp. E3-37-48.
10. Graf, W.H., Robinson, M., and Yucel, 0., "The Critical Deposit Velocity
for Solid-Liquid Mixtures," Proceedings of Hydrotransport I, First International Conference on the Hydraulic Transport in Pipes, BHRA Fluid Engineering, Sept., 1970, pp. H5-77-88.
11. Hayden, J.W., and Stelson, T.E., "Hydraulic Conveyance of Solids in Pipes," Advances in Solid-Li uid Flow in Pipes and Its Applications,
12. Howard, G.W., "Transportation of Sand and Gravel in a Four-Inch Pipe," Transactions, American Society of Civil Engineers, Vol. 104, 1939,
pp. 1335-1348.
13. Hughmark, G.A., "Aqueous Transport of Settling Slurries," Industrial
and Engineering Chemistry, Vol. 53, May, 1961, pp. 389-390.
14. Husband, W.H., et al., "tExperimental Study of Iron Ore Concentrate Slurries in Pipelines," Canadian Institute of Mining Bulletin, Jan., 1976, pp. 106-108.
15. Kazanskij, I., et al., "Influence of Added Fine Particles on the Flow Structure and the Pressure Losses in Sand-Water-Mixture,"' Proceedings of Hydrotransport III, Third International Conference on the Hydraulic Transport in Pipes, BHRA Fluid Engineering, May, 1974, pp. 02-11-21.
16. Kenchington, J.M., "Prediction of Critical Conditions for Pipeline
Flow of Settling Particles in a Heavy Medium," Proceedinqs of Hydrotransport IV, Fourth International Conference on the Hydraulic Transport in Pipes, BHRA Fluid Engineering, May, 1976, pp. D3-31-48.
17. Newitt, D.M., et al., "Hydraulic Conveying of Solids in Horizontal
Pipes," Transactions, Institute of Chemical Engineers, London, England, Vol. 33, 1955, pp. 93-113.
18. Prettin, W., and Gaessler, H., "Bases of Calculation and Planning for
the Hydraulic Transport of Run-of-Mine Coal in Pipelines According
to the Results of the Hydraulic Plants of the Ruhrkohle AG," Proceedings
of Hydrotransport IV, Fourth International Conference on the Hydraulic Transport in Pipes, BHRA Fluid Engineering, May, 1976, pp. E2-13-36.
19. Shook, C.A., "Developments in Hydrotransport," Canadian Journal of
Chemical Engineering, Vol. 54, Feb./Apr., 1976, pp, 13-25.
20. Sinclair, C.G., "The Limit Deposit-Velocity of Heterogeneous Suspensions," Proceedings of the Symposium on Interaction between Fluids and Particles, Institute of Chemical Engineers, June 1962, pp. 78-86.
21. Singh, V.P., and Charles, M.E., "The Flow of Sand/Water Slurries in
Horizontal Pipes with Internal Spiral Ribs-Effect of Rib Height," Canadian Journal of Chemical Engineering, Vol. 54, Aug., 1976,
pp. 249-254.
22. Smith, R.A., "Experiments on the Flow of Sand-Water Slurries in Horizontal Pipes," Transactions, Institute of Chemical Engineers,
London, England, Vol. 33, 1955, pp. 85-92.
23. Spells, K.E., "Correlations for Use in Transport of Aqueous Suspensions
of Fine Solids Through Pipes," Transactions, Institute of Chemical Engineers, London, England, Vol. 33, 1955, pp. 79-84.
24. Wasp, E.J., et al., "Deposition Velocities, Transition Velocities, and Spatial Distribution of Solids in Slurry Pipelines," Proceedings of Hydrotransport I_, First International Conference on the Hydraulic Transport in Pipes, BHRA Fluid Engineering, Sept., 1970, pp. H4-53-76.
25. Weber, M., et al., "Critical Velocity as Optimum Operating Velocity in
Solids Pipelining," Proceedings of Hydrotransport IV, Fourth Inter-national Conference on the Hydraulic Transport in Pipes, BHRA Fluid
Engineering, May, 1976, pp. D2-17-30.
26. Wicks, M., "Transport of Solids at Low Concentration in Horizontal
Pipes," Advances in Solid-Liquid Flow in Pipes and Its Applications,
I. Zandi, ed., Pergamon Press, Oxford, EnglandT7T ~pp. 101-124.
27. Wilson, K.C., and Brebner, A., "On Two-Phase Pressurized and Unpressurized
Flow: Behaviour Near Deposition Points," Advances in Solid-Liquid Flow in Pipes and Its Applications, I. Zandi, ed., Pergamon Press, Oxford,
England, 1971, pp. 175-186.
28. Worster, R.C., "The Hydraulic Transport of Solids," Proceedings of a
Colloquium on the Hydraulic Transport of Coal, National Coal Board,
1953, pp. 5-20.
29. Worster, R.C., and Denny, D., "Hydraulic Transport of Solid Material in Pipes," Proceedings of the Institution of Mechanical Engineers, Vol. 169, 1955, pp. 563-586.
30. Zandi, I., and Govatos, G., "Heterogeneous Flow of Solids in Pipelines," Journal of the Hydraulics Division, ASCE, Vol. 93, May, 1967, pp.
APPENDIX A
The programs and 380 data points used in this work were stored in computer files at the Joint Computer Facility at M.I.T, Listed in Table A.l are the variables associated with each data point. Also
included are explanations of the variables used in Table A.6, which
is a computer print out for the correlation proposed in this work.
Tables A.2, A.3, A.4, and A,5 contain explanations of the four digitized
codes used for identifying the slurry combination, CDV definition,
TABLE A.1
List of Computer Variables
Variable Definition
n identification number of data point
Cv slurry concentration by volume percent
ps solid particle density, (kg - m~f)
Pf fluid density, (kg - m-3)
kinematic viscosity, (m2 - s-)
d85 solid particle characteristic diameter, (m) D inside pipe diameter, (m)
Vc critical deposit velocity, (m - s')
SLYC digitized code for slurry combination
VELC digitized code for CDV definition
PMAT digitized code for pipe material SORC digitized code for reference
value of right-hand side of equation (8) and abscissa of Figure (7b)
Fr Froude number Vc/vgd85 and ordinate of Figure (7b)
Vc predicted Vc from proposed correlation, equation (9)
Vc'/Vc predicted Vc'/measured Vc
Eror percent error, (Vcc Vc)l00/Vc
N total number of points
Ex sum of relative errors where x = (Vc c c
TABLE A.2 SLYC Values
SLYC Slurry Combination
1 sand-water 2 sand-diesel oil 3 sand-kerosene 4 lime-water 5 coal-water 6 iron-kerosene 7 nylon-water 8 iron ore-water 9 plastic-water 10 glass-water 11 talc-water 12 barium sulfate-water 13 red lead-water 14 tungsten-water
TABLE A.3
VELC Values
VELC Vc Definition
1 unknown or not well defined
2 average flow velocity above sand deposit (in pipe) with zero deposit height on floor
3 few particles remain stationary on bottom of pipe 4 minimum in head loss curve
5 turbulence not sufficientetomaintain all particles in suspension
6 point when transversal velocity oscillations are not sufficient to keep the solids suspended. Vc was usually obtained by measuring deposit heights of settled particles and extrapolating on a graph of V versus deposit height to the point at which bed height equals zero.
7 highest velocity at which settling was observed
8 maximum mean velocity at which a stationary bed was observed
9 transition from sliding bed to heterogeneous flow or sliding deposit to no deposition
10 minimum velocity required to keep solids in suspension without deposits
11 velocity which separates deposit free regime from deposit regime
12 minimum mean velocity for which no stationary deposits exist, i.e.,, velocity was decreased until a stationary deposit
VELC V Definition
TABLE A.4 PMAT Values
PMAT Pipe Material
1 unknown 2 plexiglas 3 brass 4 lucite 5 steel 6 plastic 7 metal
8 steel or plastic - which is unknown
9 steel with perspex viewing sections
10 perspex
SORC 1 2 4 8 11 12 15 18 19 20 21 22 23 24 25 26 27 28 29 30 31 32 33 34 TABLE A,5 SORC Values Reference Number 23 26 24 20 17 8 10 29 25 2 22 3 16 18 9 11 27 6 15 10 10 7 21 5 Researchers' Name Spells Wicks
Yotsukura from Wasp Sinclair
Newitt et al. Durand
Wilson from Graf
Worster and Denney Weber and Godde
Blatch Smith
Bruhl and Kazanskij
Kenchington
Prettin and Gaessler Faddick et al,
Hayden and Stelson Wilson and Brebner Chiu and Seman Kazanskij et al, FUhrboter from Graf Sassoli from Graf Condolios and Chapus Singh and Charles Charles et al,
SORC Values Reference Number 4 14 19, 12 Researchers' Name Cairns et al. Husband et al. Shook Howard SORC 35 36 37 38
2.7500E-01 4 5 1 1 4.0600E-01 8.2400E-01 4 5 1 1 1 5 1 1 1 5.26 4.4952E+01 2 10.37 3.9363E+01 3 C.78 2.2619C+01 4 2.98 3.2128E+01 5 7.16 3.5712E+01 6 16.11 3.6096E+01 7 7.30 2.4356C+01 8 I.78 2.9974E+01 9 0.78 3.066CE+21 13 .89 Ae8007E+31 11 16.11 4.7834E+01, 12 16.11 4.8929E+01 13 1.90 3.7414r+01 14 3.71 4.3727101 15 27.78 4.5557E+1 C lb 1.00 2.0245E*11 17 1.00 2.2075E+01 18 1.00 2.2421+01 19 1.00 3.2300E+01 20 1.00 3.2974E+01 21 1.00 2.00 Cr*E33 9.8164E00 2.0000+03 1.0248E+01 2.6000E+03 1.6316E+01 2.600E+03 2.4157E+01 2.60C0.+03 2.7127E*01 2.6000E403 2.7127E1 Cl 2.6000F+3 3 2.5533E+C1 2.6IC0r+03 2.4231E+01 2.60 0UE03 2.827E+01 2.603.'+03 3.0289E+01 2.60 0E+03 3.4328 +01 2.600OE+03 4.03FfE* 1 2.60 00E+03 2.231 0E+01 2.60CE+0,3 2.85b7E+01 2.66001E+03 4.819.401 2.63 :0L3 1.191"E+01 2.63C00E+3 1.462f E+ I 2.630CE+03 1.59C2E+01 2.6300E+03 2.0646E+1. 2.63CE+03 3.6491E1. 2.63 001E,3 9.9850E+02 2.750CE-01 9.8630102 4.160CE-01 9.9800E+02 8.240CE-01 9.9800L+02 1.220.0E+0 9.9800E+02 1.370"E+00 9.9800E02 1.371E+010 9.9800E+02 2.2900E0 C 9.980'E?02 1.20101F00 9.9801+0? 1.4CcOE+00 9.005c+02 1.5000E+00 9.9800E+02 1.7000F+0l 9.98 0012 2.000E+00 9.98031.0E 1.?500E+00 9.980 +02 1.6000E+00 9.9800E+02 2.7000E+00 9.9800E+02 4.5723E-01 8.110.02F+0 5.6100E-01 8.590E+02 6.100 CE-01 9.98C00+02 7.9?00E-01 8.8100E+02 1.4000E+00 8.8100E+02 1.000E-06 1.2540E+00 t.1360E-07 1.4992E18 1.COOE-06 1.13861+00 1.. 000E-06 1.5131+00 1.CC0E-c6 1.69911+.0 1.c00001-0 1.72C81+00 1.r00E-06 1.9850E*0 I . c 000E-06 1.36401+00 1.0000E-06 1.3986E+00 1.0000E-06 2.4174E100 1.000E-06 ;.4058E+00 1.0OC0E-6 2.4798E+CO0 1.C 00E-16 1.9928E+00 1.00(0E-06 2.4212 +00 1.0000E-06 2.5522E+C0 9.c180r-r7 7. 982E-01 1.135CE-05 7.70511-Cl 2.7948E-16 7.8220E-01 1.5030E-06 1.1486E+00 2.0430E-05 1.1760E+00 3.0650E-05 8.00CE-C5 4.56C21.00 1.6000E-04 3.6926E+00 2.60COE-04 1.2615E+C0 2.60 01-4 1.2321E+00 2.6000E-04 1.24C2E00 2.6000E-04 1.2560E+00 8.20 C0E-04 8.6680E-01 2.5000E-4 1.1367E+00 2.5007F-04 9.989E-01 2.500E-04 1.61161+00 2.500E-04 1.4152E+00 2.5000E-04 1.2399E+08 3.20001-04 1.5943E+00 3.2000E-14 1.5126E+00 3.2000E-04 9.4527E-01 1.50001-04 1.5525E+00 1.5000E-04 1.3734E+00 1.5000E-04 1.28231+00 1.5000E-04 1.4503E+00 1.5000E-04 8.40 02E-01 1.500E-04 1.0200E-01 3.5602E+02 9.4000E-02 2.6926E+02 7.6000E-02 2.6049E+01 7.6000E-02 2.3208E+01 7.6000E-02 2.4021E+01 7.6000E-02 2.5605E+01 1.0200E-01 -1.3520E+01 2.5000E-01 1.3666E+01 3.0000E-01 -1.C11E-01 2.5000E-01 6.1158E+31 2.5000E-01 4.1517E+01 3.0000E-01 2.3990E+01 2.5000E-01 5.9426E+01 3.0000E-01 5.12601 3.0000E-01 -5.4734E+00 2.6640E-02 5.5255E+01 2.6640E-02 3.7343E+01 2.6640E-02 2.8229E01 1.3970E-01 4.5030E+01 1.3970E-01 -1.5998E+01 1.3970E-01 1 5 1 1 1 5 1 1 1 5 1 1 1.250E+00 1 5 1 1 1.6000E+00 1 5 1 1 2.7000E+00 1 5 1 1 4.5720E-01 1 2 2 2 5.6100E-01 2 2 2 2 6.1000E-01 3 2 2 2 7.9200E-01 1 2 2 2 1.4000E00 2 2 2 2 1.0700E00 2 2 2 2 1.2200E.00 1 5 1 1 1.3700E+00 1 5 1 1 1.37001+00 1 5 1 1 2.2900E+00 1 5 1 1 1.2000E+00 1 5 1 1 1.4000E+00 1 5 1 1 1.5000E.00 1.7000E+00 2.0000E+00 1 4 h
30 5.00 3.9993E+01 31 10.00 4.1877E+01 32 15.00 4 .1817E+01 33 20.00 4.1248E+01 34 25.00 4.0516E+01 35 5.00 2.9034E+01 36 10.00 3.0402E+01 37 15.00 3.0359E+01 38 20.00 2.9945E+01 39 25.00 2.9414E+.31 40 5.00 2.0217E+01 41 10.00 2.1170E+01 42 15.00 2.1139E+01 48 2.50 1 . 0027E# 01 49 3.50 1.0644E+01 50 7.25 1.1528E+01 51 7.50 1.1552E+01 52 8.25 1.1610E+01 53 10.50 1.1699E001 1.8300E+00 1 12 1 4 1.9400E00 1 12 1 4 2.0800E+00 1 12 1 4 2.3500E+00 1 12 1 4 2.4400E+00 1 12 1 4 1.9900E00 1 12 1 4 2.1200E+00 1 12 1 4 2.2200E+00 1 12 1 4 2.9600E+00 1 12 1 4 2.63C00E+C3 3.8526E+01 2.63 00E+03 4.0842E+01 2.63C0E+03 4.3789E+01 2.6300E+03 4.9473E+01 2.6300E+03 5.1368E+01 2.63CCE+03 2.6269E+01 2.63COE+C3 2.7985E+01 2.63COE+03 2.9305E+01 2.6300E+03 3.9073E+01 2.6300E+03 3.9601E+01 2.630OE+03 2.3726E+01 2.63COE+03 2.1843E+01 2.6300E+C3 2.5138E0C1 2.61C0+03 1.5842E+01 2.61 C0E03 1.6879E+.01 2.61COE+C3 1.6435E+01 2.6100E+03 1 .7767E+01 2.6100E+03 1.76 19E+01 2.61 OCE+C3 1.6731E+01 9.9800E+02 1.8300E+00 9.9800E+02 1.9400E+0 9 9.98CE+02 2.0800E+0O 9.9800E+02 2.350 00 0 9.9800E032 2.4400E00 0 9.9800E+02 1.9900E+00 9.9800E+02 2.1200E+00 9.9800.E02 2.2200E+00 9.9800E+02 2.9600E+00 9.900E+02 3.0000E+00 9.900E+02 2.5200E+00 9.9800E+02 2.3200E+00 9.9800E+02 2.67000.0 0 9.9700E+02 1.0700E+00 9.9700E+02 1.1400E+00 9.9700E+02 1.1100E+00 9.9700E02 1.2000E+00 9.9700E+02 1.1900E0O0 9.970OE02 1.1300E+00 1.000OE-06 1.8331E+00 1.0000E-06 1.9418E+00 1.00 00E-C6 1.9383E+00 1.0000E-06 1.9051E+00 1.0000E-06 1.P629E+00 1.0000E-06 2.0151E+.00 1.0000E-06 2.1195E+ CC 1.00COE-06 2.1161E+00 1.C000E-06 2.r0430.0 1.OOOE-06 2.0438E+00 1. 0O00-06 1.9629E+00 1.COCCE-06 2.0496t+00 1.0000E-06 2.0468E+00 0.9670E-07 7.1388E-01 E.9673E-07 7.4368E-01 8.9670E-07 7.8688E-01 8.9670E-07 7.8806E-01 F.9670E-07 7.9093E-01 8.9670E-07 7.9529E-01 2.3000E-04 1.0800E-01 1.0017E+00 1.677CE-01 2.30C0E-04 1.0800E-01 1.0009E+00 9.3223E-02 2.3000E-04 1.080CE-01 9.3187E-01 -6.8128E+00 2.3000E-04 1.0800E-01 9.1068E-01 -1.8932E+01 2.30C0E-04 1.8OO0E-01 7.6349E-01 -2.3651E+01 5.8500E-04 1.0400E-01 1.0126E+00 1.2603E00C 5.8500E-04 1.080CE-01 9.9974E-01 -2.5934E-02 5.85COE-04 1.0800E-01 9.5319E-01 -4.6807E+C0 5.8500E-04 1.0800E-01 7.0415r-01 -2.9585E01 5.8500E-04 1.0800E-01 6.8127E-01 -3.1873E+01 1.15000-03 1.0800E-01 7.7894E-01 -2.2106E+1 1.150CE-03 1.0800E-01 8.8345E-01 -1.1655E+01 1.1500E-03 1.0800E-01 7.6660-01 -2.3340E0.1 4.6500E-04 1.9100E-02 6.6718E-01 -3.3282E+01 4.6500E-04 1.9100E-92 6.5235E-01 -3.4765E+01 4.650CE-04 1.9100E-02 7.089CE-Cl -2.9110E01 4.6500E-04 1.9100E-02 6.5672E-01 -3.4328E+01 4.6500E-04 1.9100E-02 6.6465E-01 -3.3535E+01 4.6500E-04 1.9100E-02 7.0379E-01 -2.9621E+01 1 3 3 8 1 3 3 8 1.1300E+00 1 3 3 8 3.0000E+00 2.5200E+00 2.3200E+00 12 12 12 2.6700E+00 1 12 1 4 1.0700E+00 1 3 3 8 1.1400E+00 1 3 3 a 1.1100E+00 1 3 3 a 1.2000E00 1.1900E+00 I 4 :b 00 I