HAL Id: inserm-02180852
https://www.hal.inserm.fr/inserm-02180852
Submitted on 11 Jul 2019HAL is a multi-disciplinary open access archive for the deposit and dissemination of sci-entific research documents, whether they are pub-lished or not. The documents may come from teaching and research institutions in France or abroad, or from public or private research centers.
L’archive ouverte pluridisciplinaire HAL, est destinée au dépôt et à la diffusion de documents scientifiques de niveau recherche, publiés ou non, émanant des établissements d’enseignement et de recherche français ou étrangers, des laboratoires publics ou privés.
Neuropsychological and Neuroimaging Examinations of
Self-Reported Sleep Quality in Alcohol Use Disorder
With and Without Korsakoff’s Syndrome
Alice Laniepce, Shailendra Segobin, Coralie Lannuzel, Céline Boudehent,
Ludivine Ritz, Laurent Urso, François Vabret, Francis Eustache, Hélène
Beaunieux, Géraldine Rauchs, et al.
To cite this version:
Alice Laniepce, Shailendra Segobin, Coralie Lannuzel, Céline Boudehent, Ludivine Ritz, et al.. Neu-ropsychological and Neuroimaging Examinations of Self-Reported Sleep Quality in Alcohol Use Dis-order With and Without Korsakoff’s Syndrome. Alcoholism: Clinical and Experimental Research, Wiley, 2019, 43 (5), pp.952-964. �10.1111/acer.13997�. �inserm-02180852�
N
EUROPSYCHOLOGICAL AND NEUROIMAGING EXAMINATIONS OF SELF-
REPORTED SLEEP1
QUALITY IN
A
LCOHOLU
SED
ISORDER WITH AND WITHOUTK
ORSAKOFF’
S SYNDROME2 3
Alice Laniepce, MSc.1, Shailendra Segobin, PhD. 1, Coralie Lannuzel, MSc. 1, Céline Boudehent, MSc. 4
1,2, Ludivine Ritz, PhD.1, Laurent Urso, MD. 3, François Vabret, MD. 1,2, Francis Eustache, PhD. 1, 5
Hélène Beaunieux, PhD. 1, Géraldine Rauchs, PhD1*., Anne-Lise Pitel, PhD1*. 6
7
*: equally contributed to this work 8
9
1 : Normandy Univ, UNICAEN, PSL Université, EPHE, INSERM, U1077, CHU de Caen, GIP 10
Cyceron, Neuropsychologie et Imagerie de la Mémoire Humaine, Caen, France. 11
2 : Addiction department, Centre Hospitalier Universitaire de Caen, France. 12
3 : Addiction department, Centre Hospitalier de Roubaix, France. 13 14 Corresponding author: 15 Pitel Anne-Lise 16
Centre Cyceron, Campus Jules Horowitz 17
Boulevard Henri Becquerel, BP 5229 18
14074 Caen Cedex 5, FRANCE 19 +33 (0)2 31 47 01 25 20 pitel@cyceron.fr 21 22
Number of words in the abstract: 297 23
Number of words in the body of the manuscript: 4950 24
Number of figures: 5 ; Number of color figures: 5 25
Number of tables: 3 26
27
The authors declare no conflicts of interest. This work was supported by the French National Institute 28
for Health and Medical Research (INSERM), the French National Agency for Research (ANR), and 29
Conseil Régional de Basse-Normandie. Alice Laniepce’s doctoral fellowship was co-funded by 30
European Union in the framework of the ERDF-ESF operationnal programme 2014-2020 and 31
Lundbeck Society. 32
ABSTRACT 33
Background: Alcohol Use Disorder (AUD) patients without Korsakoff’s syndrome (KS) report a 34
variable self-rated sleep quality. Their ability to accurately judge their sleep quality may be related to 35
their alcohol-related cognitive deficits and brain damage. KS patients, who present severe brain 36
dysfunction, may be cognitively unable to judge their sleep quality. The aim of the present study is to 37
examine in AUD and KS patients, whether the absence of sleep complaint is associated with altered 38
brain structure and impaired cognitive abilities within specific cerebral networks. 39
Methods: An assessment of subjective sleep quality was conducted in 20 healthy controls, 37 AUD 40
and 17 KS patients. Patients were first pooled together and then classified into two groups (no-41
complaintAUD+KS and complaintAUD+KS) according to the total PSQI score. Cognitive scores, gray matter 42
volume (GM) and white matter (WM) integrity were compared between these two groups, and then in 43
AUD and KS patients separately. 44
Results: Poor sleep quality was reported by 70% of AUD and 18% of KS patients. Compared to 45
controls, both no-complaintAUD+KS and complaintAUD+KS presented cortical and subcortical alterations as 46
well as episodic memory deficits, which were more severe in patients without sleep complaint. Only 47
no-complaintAUD+KS presented executive deficits. Then, considering the clinical diagnosis, GM volume 48
in fronto-temporal regions, WM integrity and executive functions were affected to the same extent in 49
AUD and KS without sleep complaint. 50
Conclusion: Our results confirm the high prevalence of sleep complaint in AUD patients and the rare 51
complaint in KS patients. In AUD and KS patients, the absence of sleep complaint may not indicate 52
good sleep quality but rather reflect executive deficits and fronto-thalamic damage. Alcohol-related 53
cognitive deficits may indeed alter the ability to self-evaluate sleep quality, suggesting that the use of 54
sleep questionnaire should be considered with caution in patients with executive deficits. 55
Keywords: Alcohol Use Disorder; Korsakoff’s syndrome; Neuropsychology; Neuroimaging; 56
Subjective sleep assessment 57
1. INTRODUCTION 58
Alcohol-related neurological disorders exist principally in two clinical forms that can be distinguished 59
based on the severity of brain dysfunction (Zahr, 2014) and cognitive deficits (Oscar-Berman et al., 60
2014). The more severe clinical form is the Korsakoff's syndrome (KS), which is a neurological 61
complication related to the combination of chronic and excessive alcohol consumption and thiamine 62
deficiency. KS is described as a severe and profound amnesia potentially associated with executive 63
dysfunction. Alcohol Use Disorder without KS (AUD) is also characterized by episodic memory 64
deficits and executive dysfunction, from mild to moderate in most cases up to severe in some patients 65
at risk for KS (Pitel et al., 2008). 66
Chronic and heavy alcohol consumption is not only associated with neuropsychological impairments 67
but also with major sleep disorders. Sleep disturbances are frequently present in recently detoxified 68
AUD patients (Angarita et al., 2016) with a variable sleep complaint reported by 36 to 72% of the 69
population. Such variability can be explained by the AUD patients’ clinical features (the criteria used 70
to diagnose AUD or alcohol abuse, the length of sobriety at the time of the sleep assessment), as well 71
as the absence of standard definitions and measurements of sleep complaint (different sleep 72
questionnaires with, for example, different time frames; Brower, 2001; Stein and Friedmann, 2005). 73
While objective sleep quality seems affected in KS patients (Lairie and Pottier, 1979; Martin et al., 74
1986), only one study considered their subjective sleep perception (Lairie and Pottier, 1979) and 75
suggested that KS patients would report sleeping well. This seemingly absent sleep complaint in KS 76
patients may be related to their characteristic impaired self-awareness (Arts et al., 2017). 77
Even in absence of KS, altered abilities to accurately self-evaluate have been described in AUD 78
patients regarding neuropsychological performance (overall cognitive abilities, episodic memory 79
decoding of facial emotions) and daily recall of alcohol consumption (Kornreich, 2002; Le Berre et al., 80
2010; Lincoln et al., 2011; Rinn et al., 2002; Walvoort et al., 2016). The variability in the sleep 81
complaint prevalence observed in AUD patients may thus be related to their ability to self-assess their 82
sleep quality. Indeed, an accurate subjective sleep evaluation requires efficient episodic memory 83
abilities to recall recent sleep periods and executive functions to interpret internal and physical states, 84
to quantify sleep duration and to respond to a written sleep questionnaire. AUD patients with episodic 85
memory impairments and executive dysfunctions may not be cognitively able to correctly evaluate 86
their sleep quality, just as it may be the case in KS patients. 87
The objective of the present study is to investigate subjective sleep quality in KS and recently 88
detoxified AUD patients using a validated sleep questionnaire. We aim at examining whether the 89
absence of sleep complaint is associated with altered brain structure and cognitive abilities within 90
cerebral networks involved in episodic memory and executive functions. First, we hypothesize that 91
most KS patients do not complain about their sleep while most AUD patients do. Second, we 92
hypothesize that KS and AUD patients without sleep complaint present more severe alterations of the 93
brain networks involved in episodic memory and executive functions than patients who complain 94
about their sleep. Third, we hypothesize that this profile of executive dysfunction and associated brain 95
alterations is similar in KS and AUD without sleep complaint. 96
2. MATERIALS AND METHODS 98
2.1. Participants 99
Seventy-four participants were included in this study: 54 patients with AUD or KS (37 AUD patients 100
and 17 KS patients) and 20 healthy controls (HC). None of them had a history of neurological 101
pathology (except diagnosis of KS), endocrinal nor other infectious diseases, depression (assessed 102
using the Beck Depression Inventory (Beck et al., 1961) nor other forms of substance use disorder 103
(except tobacco). All participants were informed about the study approved by the local ethics 104
committee of Caen University Hospital (CPP Nord Ouest III, no. IDRCB: 2011-A00495-36) prior to 105
their inclusion and provided their written informed consent. For KS, informed consent was collected 106
from guardians or caregivers as well as from the patients themselves. 107
Clinicians recruited AUD patients while they were receiving withdrawal treatment as inpatients at 108
Caen University Hospital. AUD patients met “alcohol-dependence” criteria according to the DSM-IV 109
(American Psychiatric Association (APA), 2000) and “alcohol use disorder” according to the DSM-5 110
(American Psychiatric Association, 2013) for at least 5 years. At inclusion and evaluation, none of 111
them presented physical symptoms of alcohol withdrawal as assessed by the Cushman’s scale 112
(Cushman et al., 1985) and were under medication by benzodiazepines. Alcohol history of the AUD 113
patients is described in Table 1. 114
KS were recruited as inpatients at Caen University Hospital (n=9) and in a nursing home (Maison 115
Vauban, Roubaix, France; n=8). All KS patients were diagnosed with reference to the clinical DSM-116
IV criteria of ‘‘amnesia due to substance abuse’’ and “major neurocognitive disorders, confabulatory 117
type, persistent” according to the DSM-5. All KS patients had a history of heavy drinking, but it was 118
difficult to obtain accurate information about their alcohol intake due to their amnesia. The case of 119
each patient was examined by a multidisciplinary team made up of specialists in cognitive 120
neuropsychology and behavioural neurology. A detailed neuropsychological examination enabled the 121
diagnosis of all KS patients presenting disproportionately severe episodic memory disorders compared 122
to other cognitive functions (Table 1). Clinical and neuroimaging investigations ruled out other 123
possible causes of memory impairments (particularly focal brain damage). 124
HC were recruited locally and to match the demographics of the AUD patients. They were interviewed 125
with the AUDIT to ensure that they did not meet the criteria for alcohol abuse (AUDIT < 7 for men 126
and < 6 for woman (Gache et al., 2005)). None of the controls had a Beck Depression Inventory (BDI) 127
> 29 (Beck et al., 1961), an MMSE score < 26 (Folstein et al., 1975), nor sleep complaint (Pittsburg 128
Sleep Quality Index 5; Buysse et al., 1989). 129
-Insert Table 1- 130
AUD and HC were age-, sex- and education-matched (p=0.31, p=0.42 and p=0.31 respectively). KS 131
differed from both HC and AUD in age (p< 0.001) and only from HC (p=0.03) for education. The sex 132
ratio was also different in the KS group from that in the HC (p=0.01) and AUD groups (p=0.04). 133
There was no difference on BMI among the three groups (Table 1). 134
2.2. Subjective assessment of sleep quality 135
All participants completed the Pittsburg Sleep Quality Index (PSQI; Buysse et al., 1989) during the 136
neuropsychological examination. The PSQI is a 19-item self-assessment questionnaire that allows a 137
measure of sleep quality and disturbances over the last month. Seven components are evaluated 138
ranging from 0 to 3: subjective sleep quality, sleep latency, sleep duration, habitual sleep efficiency, 139
sleep disturbances, use of sleeping medication and daytime dysfunction. The total score ranges from 0 140
(indicating no difficulty) to 21 (major sleep difficulties). As recommended, a cut-off score of 5 was 141
used to indicate a significant sleep complaint. 142
Based on the total PSQI score, patients (AUD and KS) were divided into 2 subgroups: 143
(i) No-complaintAUD+KS patients corresponding to patients who did not complain about their
144
sleep (i.e., PSQI score ≤ 5) 145
(ii) ComplaintAUD+KS patients corresponding to patients who complained about their sleep
146
(i.e., PSQI score > 5). 147
2.3. Neuropsychological examination 148
For executive functions, a composite score was created including performance on three tests assessing 149
manipulation of information (verbal backward spans of the WAIS-III (Wechsler, 1997)), inhibition 150
(Stroop Test (Stroop, 1935), time in seconds needed to complete the interference condition minus time 151
needed for the denomination condition) and mental flexibility (Modified Card Sorting Test (Cianchetti 152
et al., 2005), number of perseverative errors). 153
Episodic memory was examined through the sum of the five free-recalls of the French version of the 154
California Verbal Learning Test (CVLT ; Van der Linden et al., 2004). 155
Neuropsychological data were then transformed into z-scores using the mean and standard deviation 156
obtained from the healthy controls. The sign of all variables for which high scores were in the 157
impaired direction (such as completion time or number of errors) were reversed so that all the z-scores 158
had the same direction: the higher the z-score, the better the performance. Thus, all cognitive and 159
motor variables were on the same scale. We computed a global composite score corresponding to the 160
mean of the 3 z-scores (manipulation of information, inhibition and mental flexibility) for executive 161
functions. 162
This neuropsychological examination showed graded effects of deficits for all evaluated cognitive 163
functions with KS presenting more severe impairments than AUD patients (all p values <0.001, Table 164
1). 165
2.4. MRI Data acquisition: 166
Brain imaging examinations were conducted in 15 HC, 20 AUD and 17 KS patients within the same 167
week as the neuropsychological assessment and the sleep questionnaire. 168
A high-resolution T1-weighted anatomical image was acquired for each subject on a Philips Achieva 169
3T scanner using a three-dimensional fast-field echo sequence (sagittal; repetition time, 20 ms; echo 170
time, 4.6 ms; flip angle, 10°; 180 slices; slice thickness: 1mm; field of view, 256 x 256 mm2; matrix, 171
256 x 256). Regarding Diffusion Tensor Imaging (DTI), 70 slices (thickness: 2 mm, no gap) were 172
acquired axially using a diffusion weighted imaging spin echo sequence (32 directions at b = 1000 173
s/mm², repetition time = 10000 ms; echo time = 82 ms; flip angle = 90°, field of view = 224 x 224 174
mm², matrix = 112 x 112 and in plane resolution of 2 x 2 mm²; one no-diffusion weighted image at b = 175
0 s/mm² was also acquired). 176
2.5. MRI Data processing: 177
The volumetric MRI data were analyzed using the Statistical Parametric Mapping software (SPM12; 178
Wellcome Department of Cognitive Neurology, Institute of Neurology, London, UK). Preprocessing 179
steps included segmentation of the MRI data into gray matter (GM) and spatial normalization to the 180
Montreal Neurological Institute (MNI) template (voxel size = 1.5 mm3, matrix = 121 x 145 x 121). 181
The normalized GM images were modulated by the Jacobian determinants to correct for non-linear 182
warping only so that the resulting brain volumes were corrected for brain size. The resulting images 183
were smoothed by a Gaussian kernel of 8 mm full-width-at-half-maximum (FWHM). GM volume 184
density reflects cerebral macrostructure and numerically corresponds to the mean gray matter per unit 185
volume for each significant cluster. 186
The diffusion-weighted images (DWI) were first preprocessed to create Fractional Anisotropy (FA) 187
images using the FSL Diffusion Toolbox (FDT; http://fsl.fmrib.ox.ac.uk/fsl/ fslwiki/FDT) that is part 188
of FSL 5.0 toolbox for medical image analysis (Smith et al., 2004). Briefly, for each subject, the 32 189
DWI images were first corrected for distortions due to Eddy currents and aligned to the b=0 s/mm2 190
image using rigid-body registration for motion correction (Jenkinson et al., 2002). FA images were 191
then created by fitting a tensor model to the diffusion images. Individual FA data were aligned into 192
MNI space using the nonlinear registration tool (FNIRT), which uses a b-spline representation of the 193
registration warp field (Rueckert et al., 1999). The resulting FA maps were resliced to matrix size of 194
182 x 218 x 182 and voxel size of 1 mm3 and smoothed to 6 mm FWHM prior to voxel-based 195
statistical analyses. Numerically, FA values vary between 0 and 1. Generally, the higher the FA value, 196
the better the microstructural integrity of the fiber within that voxel. FA is assumed to be a structural 197
biomarker that depicts WM disruption involving myelin, cytoskeleton, and the axons’ microtubule 198
system (Pfefferbaum et al., 2006). 199
The GM mask was obtained taking the unmodulated GM images of healthy controls (HC) normalized 200
to the MNI space, averaging them and thresholding the resultant mean image at 0.5. The white matter 201
(WM) mask was obtained by taking the FA maps of healthy controls normalized to the MNI space, 202
averaging them and thresholding the resultant mean image at 0.3. The resulting GM and WM masks 203
were applied respectively to GM and WM data analyses. 204
2.6. Statistical analysis 205
2.6.1. Prevalence of sleep complaint in AUD and KS patients 206
We first described the prevalence, severity and nature of the sleep complaint in the HC, AUD and KS 207
patients using Chi2 tests and ANCOVAs (age, gender and Body Mass Index (BMI) used as covariates) 208
when appropriate. 209
2.6.2. Pattern of cognitive alterations according to sleep quality 210
Then, we pooled the AUD and KS patients together and conducted ANCOVAs (using age, gender and 211
BMI as covariates) followed by post-hoc comparisons (Tukey’s tests) on neuropsychological data to 212
compare HC, no-complaintAUD+KS and complaintAUD+KS patients. 213
We also investigated whether this effect was driven by the results obtained in a specific clinical group 214
by comparing HC, complaintAUD, no-complaintAUD and no-complaintKS patients using ANCOVAs with 215
age, gender and BMI as covariates. Given the sample size of the complaintKS group (N=3), these 216
patients were not included in the statistical analysis (Table 2). 217
-Insert Table 2- 218
2.6.3. Pattern of brain alterations according to sleep quality 219
Voxel-based ANCOVAs were conducted in SPM12, with age, gender and BMI as covariates, to 220
compare HC, no-complaintAUD+KS and complaintAUD+KS patients on GM volume and WM integrity (FA 221
values). Results are reported at p<0.001 (uncorrected for multiple comparisons) with a minimal cluster 222
size (k) of 60 voxels (200 mm3). 223
Once again, to ensure that the effect was not only due to the presence of KS patients in the clinical 224
sample, average signal values within significant clusters were extracted and post hoc tests (Tukey’s 225
tests) were conducted to compare HC, complaintAUD, no-complaintAUD and no-complaintKS patients. 226
Here again, given the sample size of the complaintKS group (N=3), these patients were not included in 227
the statistical analysis. 228
Significant clusters of GM were labeled using the Harvard-Oxford cortical and subcortical structural 229
atlases implemented in FSL (https://fsl.fmrib.ox.ac.uk/fsl/fslwiki/Atlases). WM regions were manually 230
labeled using the MRI Atlas of Human white matter (Oishi et al., 2011). 231
3. RESULTS 233
3.1. Prevalence of sleep complaint in AUD and KS patients. 234
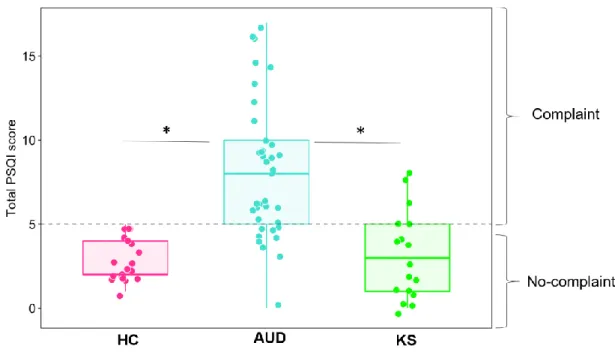
Prevalence of sleep complaint: Based on the PSQI total score, poor sleep quality (PSQI total score > 235
5) was significantly more frequently reported in AUD patients (70.3 %) than in KS patients (17.6 %) 236
and HC (Table 3, Fig 1). 237
Severity of sleep complaint: The ANCOVA revealed a significant effect of group on the PSQI total 238
score (F(2,68)=26,63; p<0.0001 ; Table 3). AUD patients had higher scores than KS patients 239
(p<0.0001) and HC (p <0.0001), these two latter groups being comparable (p = 0.93). 240
Nature of sleep complaint: ANCOVAs conducted on each PSQI subcomponent revealed significant 241
effects of group (all F-values are reported in Table 3). Compared to HC, AUD patients reported poor 242
subjective sleep quality (p<0.004), longer sleep latency (p=0.03) and sleep disturbances (p=0.001), 243
more frequent use of sleeping medication (p=0.03), altered sleep efficiency (p=0.01) and daytime 244
dysfunction (p<0.03). No difference was observed between HC and KS patients (all p values >0.05). 245
Compared to KS patients, AUD patients reported significantly poor subjective sleep quality (p=0.003), 246
shorter sleep duration (p=0.005), sleep disturbances (p=0.0009) and daytime dysfunction (p=0.008; 247
Table 3). 248
- Insert Figure 1 and Table 3 – 249
3.2. Pattern of cognitive alterations according to sleep quality. 250
3.2.1. HC vs no-complaintAUD+KS patients vs complaintAUD+KS patients 251
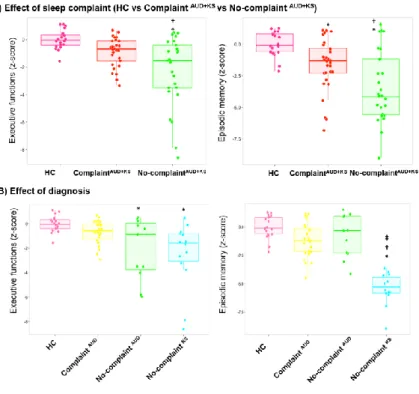
The ANCOVAs revealed significant effects of group (HC vs no-complaintAUD+KS vs complaintAUD+KS 252
patients) for executive (F(2,68)=7.69 p=0.0009) and episodic memory scores (F(2,66)=6.21 p=0.003). 253
Concerning executive functions, post-hoc comparisons showed that complaintAUD+KS patients were 254
comparable to HC (p=0.20), contrary to no-complaintAUD+KS patients who presented lower executive 255
performance compared to both HC (p = 0.0001) and complaintAUD+KS patients (p = 0.008; Fig 2A). 256
For episodic memory, graded effects were observed with no-complaintAUD+KS patients showing lower 257
performance than complaintAUD+KS patients, these latter showing also reduced performance compared 258
to HC (all p values <0.01; Fig 2A). 259
3.2.2. HC vs complaintAUD patients vs no-complaintAUD patients vs no-complaintKS patients
260
The ANCOVAs revealed a significant effect of group for executive (F(3,64)=5.31 p=0.002) and 261
episodic memory scores (F(3,62)=20.31 p<0.0001). 262
Concerning executive functions, post-hoc comparisons showed that complaintAUD patients presented 263
similar performance as HC (p=0.51) and no-complaintAUD patients (p=0.23). No-complaintAUD patients 264
and no-complaintKS patients had significantly lower executive performance than HC (p=0.02 and 265
p=0.001 respectively), but did not differ from each other (p=0.94 ; Fig 2B). 266
Regarding episodic memory, post-hoc comparisons showed that no-complaintAUD patients and 267
complaintAUD patients presented similar performance as HC (p=0.47 and p=0.05 respectively) and did 268
not differ from each other (p=0.92). No-complaintKS patients performed significantly lower than the 269
three other groups (p=0.0001 for all comparisons; Fig 2B). 270
- Insert Figure 2 – 271
3.3. Pattern of brain alterations according to sleep quality. 272
3.3.1. Gray-matter volume 273
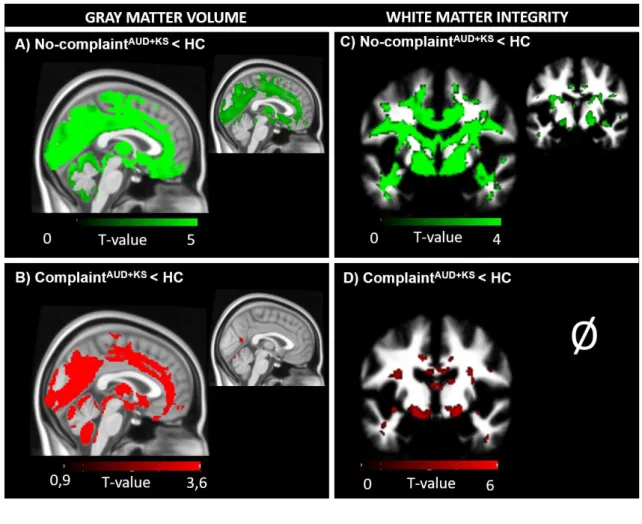
Compared to HC, no-complaintAUD+KS patients had significantly lower GM volume in frontal and 274
prefrontal areas, insula, lateral and medial temporal cortices (including the hippocampus and 275
parahippocampal gyrus), cingulate and occipital cortices, but also in subcortical regions including the 276
thalamus, putamen and caudate nuclei, and in the cerebellum (p <0.001, uncorrected, k=60). These 277
results remained significant after correction for multiple comparisons but with smaller cluster size 278
(Family Wise Error (FWE), p<0.05; Fig 3A). 279
Compared to HC, complaintAUD+KS patients had lower GM volume in frontal and prefrontal areas, 280
insula, lateral and medial cortices (including the hippocampus and parahippocampus gyrus), cingulate 281
and occipital cortices, but also in subcortical regions including the thalamus, putamen and caudate 282
nuclei, and in the cerebellum (p <0.001, uncorrected, k=60). After correction for multiple 283
comparisons, only the bilateral precentral gyrus (clusters encompass the postcentral gyrus), the right 284
insula, the bilateral lingual gyrus, the bilateral cuneus and the left thalamus remained significant 285
(FWE, p<0.05; Fig 3B). 286
- Insert Figure 3 - 287
As shown in Figure 4A, compared to complaintAUD+KS patients, no-complaintAUD+KS patients had 288
significantly lower GM volume in frontal and prefrontal areas (including the right middle frontal 289
gyrus, the median frontal gyrus, bilateral precentral gyrus, bilateral inferior frontal gyrus, left superior 290
frontal gyrus), middle cingulate gyrus, bilateral precuneus, the temporal pole, the occipital gyrus and 291
the left thalamus (p<0.001 uncorrected, k=60). These results did not remain significant after correction 292
for multiple comparisons. The reverse comparison did not reveal any significant difference. 293
From this comparison (complaintAUD+KS patients > no-complaintAUD+KS patients), signal values within 294
each cluster were extracted and compared between the different subgroups (HC, complaintAUD patients, 295
no-complaintAUD patientsand no-complaintKS patients). 296
Compared to HC, no-complaintAUD patients and no-complaintKS patients showed significantly lower 297
values for all extracted clusters (p<0.001). Compared to HC, complaintAUD patients presented 298
significantly lower GM volume in all clusters except in the medial prefrontal cortex (p=0.06). 299
Compared to complaintAUD patients, no-complaintAUD patients exhibited lower values only for the 300
middle frontal gyrus (p=0.002), the inferior frontal gyrus (p=0.02), the superior frontal gyrus (p=0.03), 301
the temporal pole (p=0.02) and the occipital cortex (p=0.003). Compared to complaintAUD patients, no-302
complaintKS patients exhibited significant GM atrophy for all extracted clusters (all p values <0.05). 303
No difference was observed between no-complaintAUD patients and no-complaintKS (p>0.05 ; Fig 4B). 304
Partial Pearson’s correlations adjusted for age, sex and BMI were conducted in the two groups of 305
patients pooled together (no-complaintAUD+KS patients vs complaintAUD+KS patients) between regional 306
volumes in all extracted clusters on the one hand and neuropsychological performance on the other 307
hand. We found significant relationships only between the thalamus (r=0.61, p=0.005), the temporal 308
pole (r=0.52, p=0.02), the lingual gyrus (r=0.47, p=0.04) and episodic memory results as well as 309
between the volume in the middle frontal and precentral gyri and the executive performance (r=0.60, 310
p=0.006; r=0.50, p=0.02 respectively) in no-complaintAUD+KS patients. There was no significant 311
correlation in the complaintAUD+KS patients between cerebral volume and cognitive functions. 312
- Insert Figure 4 - 313
3.3.2. White-Matter integrity 314
Compared to HC, no-complaintAUD+KS patients had significantly lower FA values, indicating an 315
alteration of WM, in a large set of fibers including the corpus callosum, the anterior corona radiata, the 316
anterior limb of the internal capsule, the cingulum, the middle cerebellar peduncle and the fornix. 317
These results remained significant after correction for multiple comparisons but with smaller cluster 318
size (FWE, p<0.05; Fig 3C). 319
The same pattern of white matter abnormalities was observed in complaintAUD+KS patients compared 320
with HC. These results did not remain significant after correction for multiple comparisons (Fig 3D). 321
As shown in Figure 5A, compared to complaintAUD+KS patients, no-complaintAUD+KS patients had 322
significantly lower FA values in the anterior and superior parts of the corana radiata, the bilateral 323
cingulum, the inferior and superior parts of the longitudinal fasciculus, the right fornix (encompassing 324
the cerebral peduncle and the internal capsule), the bilateral external capsule, the left anterior thalamic 325
radiation, and the white matter within the post-central gyrus, the angular gyrus, the superior frontal 326
gyrus and the precuneus (p<0.001, uncorrected, k=60). These results did not remain significant after 327
correction for multiple comparisons. The reverse comparison did not reveal any significant difference. 328
From this comparison (complaintAUD+KS patients > no-complaintAUD+KS patients), signal values were 329
extracted within each significant cluster and compared between subgroups (HC, complaintAUD patients, 330
no-complaintAUD patients and no-complaintKS patients). Compared to HC, i) complaintAUD patients 331
presented lower FA values in the anterior thalamic radiation (p=0.008); ii) no-complaintAUD patients 332
exhibited lower FA values in all extracted clusters p<0.01, except for the white matter in the post-333
central gyrus (p=0.74) and the superior longitudinal fasciculus (p=0.07); and iii) no-complaintKS 334
patients showed lower FA values in all clusters (p<0.001). Compared to complaintAUD patients, no-335
thalamic radiation (p=0.08), the external capsule (p=0.22) and the white matter of the supramarginal 337
gyrus (p=0.06), the precuneus (p=0.06) and the postcentral gyrus (p=0.39). No difference was found 338
between no-complaintAUD patients and no-complaintKS patients (Fig 5B). 339
Partial Pearson's correlations adjusted for age, sex and BMI were conducted in the two groups of 340
patients pooled together (no-complaintAUD+KS patientsvs complaintAUD+KS patients) between regional 341
FA values in all extracted clusters on the one hand and neuropsychological performance on the other 342
hand. 343
In complaintAUD+KS patients, we found significant relationships between FA values of the WM part of 344
the angular gyrus and episodic memory performance (r=0.69, p=0.02). In no-complaintAUD+KS patients, 345
we found significant relationships between the anterior thalamic radiation (r=0.62, p=0.008), the 346
external capsule (r=0.60, p=0.01), the inferior longitudinal fasciculus (r=0,50, p=0.04), the bilateral 347
cingulum (r=0.72, p=0.001), the anterior corona radiata (r=0.61, p=0.009) and executive functions. We 348
also showed significant relationships between the bilateral cingulum (r=0.60, p=0.01), the superior 349
longitudinal fasciculus (r=0.52, p=0.03) and episodic memory. 350
- Insert Figure 5 - 351
4. DISCUSSION 353
The aim of the present study was to investigate, in recently detoxified AUD and KS patients, whether 354
self-estimated sleep quality is related to cognitive functioning and brain integrity. 355
First, in agreement with previous studies, we observed a high prevalence of sleep complaint in 356
recently detoxified AUD patients (Angarita et al., 2016; Chakravorty et al., 2016). We showed that, 357
compared to HC, AUD patients with sleep complaint present a pattern of macrostructural brain 358
damage in frontal and temporal cortices, as well as cingulate gyrus and thalamus, known to be affected 359
by heavy and chronic alcohol consumption (Zahr, 2014). Interestingly, all these regions are involved 360
in the generation and maintenance of both NREM and REM sleep rhythms (Maquet et al., 1996; 361
Massimini et al., 2004; Murphy et al., 2009; Schabus et al., 2007). Moreover, reduced GM volume in 362
the frontal cortex have been related to higher sleep complaint (Sexton et al., 2014). AUD patients with 363
sleep complaint also had lower FA values in the anterior thalamic radiation, in accordance with a 364
recent study showing that altered WM tracts were associated with higher sleep complaint in older 365
adults (Sexton et al., 2017). Thus, in this group of patients who complain about their sleep, poor self-366
rated sleep quality may be related to the objective sleep alterations expected given their pattern of 367
brain dysfunction (Chakravorty et al., 2016). 368
Our study showed that most of the KS patients (14 out of 17) reported sleeping as well as healthy 369
controls. To the best of our knowledge, our study is the first to investigate, in KS patients, sleep 370
complaint using a validated and widely used sleep questionnaire (Buysse et al., 1989) in KS patients. 371
Our findings are not in accordance with polysomnography studies showing objective sleep alterations 372
in KS patients (Martin et al., 1986), highlighting the frequent discrepancies between self-perception 373
and objective sleep measurements reported in AUD (Angarita et al., 2016), as also frequently reported 374
in aging (Nguyen-Michel et al., 2015; Van Den Berg et al., 2008) and neurodegenerative diseases 375
(Hita-Yañez et al., 2013; Most et al., 2012). The rarity of sleep complaint in KS patients is in 376
agreement with their “without complaints appearance” (Walvoort et al., 2016) and may be explained 377
by their cognitive deficits and/or impaired insight that affect their ability to recognize and report 378
problems in self-evaluation questionnaires (Arts et al., 2017; Walvoort et al., 2016). Anosognosia is 379
defined as the inability to accurately estimate one’s functional capacity (Prigatano, 2009). It is 381
frequently observed in amnesic patients with associated executive dysfunction (Arts et al., 2017; 382
Shimamura and Squire, 1986). 383
Some of the recently detoxified AUD patients presented a profile of executive dysfunction as well as 384
macrostructural and microstructural brain abnormalities similar to those observed in KS patients. 385
These patients with severe brain dysfunction, sometimes considered at risk of developing KS (Pitel et 386
al., 2012, 2007; Segobin et al., 2015), did not complain about their sleep. Compared to AUD patients 387
with sleep complaint, these patients presented more severe alterations in fronto-temporal regions and 388
specific damage in the frontal-subcortical tracts. Besides, executive impairments were not found in 389
AUD patients with sleep complaint. These findings suggest a key role of the fronto-temporal network 390
and executive functions in subjective assessment of sleep quality. The evaluation of sleep quality 391
using the PSQI is a complex cognitive task that requires a self-interpretation of internal and physical 392
states, which in turn implies having efficient executive functions to judge both sleep quantity (includes 393
evaluating parameters like total sleep time, sleep latency, number of awakenings, among others) and 394
subjective aspects of sleep quality such as feeling tired or daytime sleepiness (Buysse et al., 1989). 395
Executive impairments result in self-awareness deficits (Goldstein et al., 2009) related to damage 396
within the frontal cortex, especially the dorsolateral (Schmitz, Kawahara-Baccus, & Johnson, 2004; 397
Shany-Ur et al., 2014) and medial parts of the prefrontal cortex (Fleming & Dolan, 2012; Schmitz & 398
Johnson, 2007). Previous studies have reported altered self-awareness in AUD patients, who tend to 399
underestimate their daily alcohol consumption (Lincoln et al., 2011) and cognitive deficits (Kornreich, 400
2002; Le Berre et al., 2010; Walvoort et al., 2016). In the present study, AUD patients with executive 401
dysfunction and lower gray matter volume in the dorsolateral and medial parts of the prefrontal cortex 402
as well as lower WM integrity in fibers connecting fronto-subcortical regions may thus not be 403
cognitively able to accurately estimate their sleep. It is also worth noting that the group of AUD 404
patients without sleep complaint is highly heterogeneous (figure 2B) and potentially consisted of two 405
sub-groups of patients: one that would be similar to HC or complaint AUD regarding brain structure 406
and function while the other would be similar to KS patients (Parsons, 1998; Pitel et al., 2012, 2007; 407
Segobin et al., 2015). The complaint AUD group is more homogeneous since it mainly includes 408
patients with preserved performance and brain measures. 409
The thalamus has been shown to play a crucial role in self-awareness (Shany-Ur et al., 2014) and may 410
also be implicated in self-reported sleep quality. This subcortical structure is known to be affected by 411
chronic and excessive alcohol consumption, with graded effects in thalamic volume from AUD to KS 412
patients (Pitel et al., 2012). Interestingly, while AUD patients with sleep complaint have thalamic 413
volumes significantly different from those of KS patients, the thalamic shrinkage in patients without 414
sleep complaint is similar to that of KS patients. The thalamus being a key node of the Papez circuit 415
involved in episodic memory, one would expect AUD patients without sleep complaint to perform on 416
par with KS patients on the episodic memory task. Conversely, in line with the diagnosis, KS patients 417
were impaired in episodic memory compared with both HC and the two subgroups of AUD, who did 418
not differ from each other. Taken together, these findings suggest that the contribution of the thalamus 419
in self-reported sleep quality may not be related to the involvement of episodic memory abilities, 420
contrary to our hypothesis. Rather, several subcortical regions, including the thalamus, “subserve 421
transforming lower-level interoceptive bodily sensations and representations of self into higher-level 422
self-referential mental representations” (Shany-Ur et al., 2014). AUD patients with severe thalamic 423
abnormalities may be unable to accurately perceive and update current physical states, resulting in the 424
absence of sleep complaint. 425
One potential limitation of the present study is the absence of objective sleep measures by 426
polysomnography, generally not available in clinical practice. Even though it was not the objective of 427
the present study, it would allow determining whether patients without sleep complaint do present 428
objective sleep disturbances. Further studies combining both objective and subjective sleep measures 429
as well as neuropsychological and multimodal neuroimaging examinations are under way to confirm 430
the proposed cognitive and brain mechanisms underlying sleep perception in AUD and KS patients. 431
5. CONCLUSION 432
Taken together, our data contribute to a better understanding of self-reported sleep quality in recently 433
detoxified AUD patients, by incorporating new insights from neuropsychological and neuroimaging 434
examinations. Given the high prevalence of sleep complaint in AUD patients (Angarita et al., 2016; 435
Chakravorty et al., 2016), the use of a sleep questionnaire in clinical practice should not be abandoned 436
since it reflects the subjective perception of mental states and feelings on which most alcohol 437
treatments are proposed. However, sleep questionnaires should be employed and interpreted with 438
caution with AUD patients presenting executive dysfunction. A neuropsychological assessment of 439
alcohol-related cognitive deficits is thus a crucial step in the treatment of AUD patients early in 440
abstinence. In patients who are cognitively unable to complain, sleep problems would be neglected 441
under a clinical setting and therefore remain untreated. Such a situation would worsen sleep-related 442
clinical consequences in AUD such as increased mood disturbances (Zhabenko et al., 2012), impair 443
their overall quality of life and likely trigger relapse (Brower, 2003), hence defeating the purpose of 444
their initial treatment. 445
446
6. ACKNOWLEDGMENTS 447
The authors are grateful to the Cyceron MRI staff members for their help with patients and imaging 448
examination acquisition, Claire André, Nicolas Cabé and Angéline Maillard for their helpful 449
comments on the manuscript. We would also like to thank all the participants for their implication in 450
this study. 451
7. REFERENCES 453
American Psychiatric Association (2013) American Psychiatric Association, 2013. Diagnostic and 454
statistical manual of mental disorders (5th ed.), American Journal of Psychiatry. 455
American Psychiatric Association (APA) (2000) Diagnostic and Statistical Manual of Mental 456
Disorders, Fourth Edition, Text Revision (DSM-IV-TR), American Psychiatric Association. 457
Arlington, VA, Am. Psychiatr. Assoc. 458
Angarita GA, Emadi N, Hodges S, Morgan PT (2016) Sleep abnormalities associated with alcohol , 459
cannabis , cocaine , and opiate use : a comprehensive review. Addict Sci Clin Pract 1–17. 460
Arts NJ, Walvoort SJ, Kessels RPC (2017) Korsakoff ’ s syndrome : a critical review. Neuropsychiatr 461
Dis Treat 13:2875–2890. 462
Beck AT, Ward CH, Mendelson M, Mock J, Erbaugh J (1961) An inventory for measuring depression. 463
Arch Gen Psychiatry 4:561–571. 464
Brower KJ (2003) Insomnia, alcoholism and relapse. Sleep Med Rev 7:523–539. 465
Brower KJ (2001) Alcohol’s Effects on Sleep in Alcoholics. Alcohol Res Heal 25:110–125. 466
Buysse DJ, Reynolds CF, Monk TH, Berman SR, Kupfer DJ, III CFR, Monk TH, Berman SR, Kupfer 467
DJ (1989) The Pittsburgh Sleep Quality Index: a new instrument for psychiatric practice and 468
research. Psychiatry Res 28:193–213. 469
Chakravorty S, Chaudhary NS, Brower KJ (2016) Alcohol Dependence and Its Relationship With 470
Insomnia and Other Sleep Disorders. Alcohol Clin Exp Res 40:2271–2282. 471
Cianchetti C, Corona S, Foscoliano M, Scalas F, Sannio-Fancello G (2005) Modified Wisconsin Card 472
Sorting Test: Proposal of a supplementary scoring method. Arch Clin Neuropsychol 20:555–558. 473
Cushman PJ, Forbes R, Lerner W, Stewart M (1985) Alcohol withdrawal syndromes: clinical 474
management with lofexidine. Alcohol Clin Exp Res 9:103–108. 475
Fleming SM, Dolan RJ (2012) The neural basis of metacognitive ability. Philos Trans R Soc Lond B 476
Biol Sci 367:1338–49. 477
Folstein MF, Folstein SE, McHugh PR (1975) “Mini-mental state.” J Psychiatr Res 12:189–198. 478
Gache P, Michaud P, Landry U, Accietto C, Arfaoui S, Wenger O, Daeppen J-B (2005) The Alcohol 479
Use Disorders Identification Test (AUDIT) as a Screening Tool for Excessive Drinking in 480
Primary Care: Reliability and Validity of a French Version. Alcohol Clin Exp Res 29:2001– 481
2007. 482
Goldstein RZ, Craig AD (Bud), Bechara A, Garavan H, Childress AR, Paulus MP, Volkow ND (2009) 483
The Neurocircuitry of Impaired Insight in Drug Addiction. Trends Cogn Sci 13:372–380. 484
Hita-Yañez E, Atienza M, Cantero JL (2013) Polysomnographic and Subjective Sleep Markers of 485
Mild Cognitive Impairment. Sleep 36:1327–1334. 486
Jenkinson M, Bannister P, Brady M, Smith S (2002) Improved optimisation for the robust and 487
accurate linear registration and motion correction of brain images. Neuroimage 17:825–841. 488
Kornreich C (2002) Impaired emotional facial expression recognition is associated with interpersnal 489
problems in alcoholism. Alcohol Alcohol 37:394–400. 490
Lairie M, Pottier M (1979) Quelques remarques à propos du sommeil dans le syndrome de Korsakoff. 491
EEG Neurophysiol 9:277–285. 492
Le Berre A-P, Pinon K, Vabret F, Pitel AL, Allain P, Eustache F, Beaunieux H (2010) Study of 493
metamemory in patients with chronic alcoholism using a feeling-of-knowing episodic memory 494
task. Alcohol Clin Exp Res 34:1888–98. 495
Lincoln R, Rosenthal CF, Malte CA, Simpson T (2011) A pilot study of memory impairment 496
associated with discrepancies between retrospective and daily recall of alcohol consumption. Am 497
J Addict 20:568–574. 498
Maquet P, Péters J-M, Aerts J, Delfiore G, Degueldre C, Luxen A, Franck G (1996) Functional 499
neuroanatomy of human rapid-eye-movement sleep and dreaming. Nature 383:163–166. 500
Martin PR, Loewenstein RJ, Kaye WH, Ebert MH, Weingartner H, Gillin JC (1986) Sleep EEG in 501
Korsakoff’s psychosis and Alzheimer’s disease. Neurology 36:411–411. 502
Massimini M, Huber R, Ferrarelli F, Hill S, Tononi G (2004) The Sleep Slow Oscillation as a 503
Traveling Wave. J Neurosci 24:6862–6870. 504
Most EIS, Aboudan S, Scheltens P, Van Someren EJW (2012) Discrepancy between subjective and 505
objective sleep disturbances in early-and moderate-stage alzheimer disease. Am J Geriatr 506
Psychiatry 20:460–467. 507
Murphy M, Riedner BA, Huber R, Massimini M, Ferrarelli F, Tononi G (2009) Source modeling sleep 508
slow waves. Proc Natl Acad Sci 106:1608–1613. 509
Nguyen-Michel VH, Lévy PP, Pallanca O, Kinugawa K, Banica-Wolters R, Sebban C, Mariani J, 510
Fournier E, Arnulf I (2015) Underperception of naps in older adults referred for a sleep 511
assessment: An insomnia trait and a cognitive problem? J Am Geriatr Soc 63:2001–2007. 512
Oishi K, Faria A, Van Zijl P, S M (2011) MRI atlas of human white matter. Academic. 513
Oscar-Berman M, Valmas MM, Sawyer KS, Ruiz SM, Luhar RB, Gravitz ZR (2014) Profiles of 514
impaired, spared, and recovered neuropsychologic processes in alcoholism In: Handbook of 515
Clinical Neurology , pp 183–210. 516
Parsons OA (1998) Neurocognitive Deficits in Alcoholics and Social Drinkers: A Continuum? 517
Alcohol Clin Exp Res 22:954–961. 518
Pfefferbaum A, Adalsteinsson E, Sullivan E V. (2006) Supratentorial Profile of White Matter 519
Microstructural Integrity in Recovering Alcoholic Men and Women. Biol Psychiatry 59:364– 520
372. 521
Pitel A-L, Chételat G, Le Berre AP, Desgranges B, Eustache F, Beaunieux H (2012) Macrostructural 522
abnormalities in Korsakoff syndrome compared with uncomplicated alcoholism. Neurology 523
78:1330–1333. 524
Pitel AL, Beaunieux H, Witkowski T, Vabret F, Guillery-Girard B, Quinette P, Desgranges B, 525
Eustache F (2007) Genuine Episodic Memory Deficits and Executive Dysfunctions in Alcoholic 526
Subjects Early in Abstinence. Alcohol Clin Exp Res 31:1169–1178. 527
Pitel, Beaunieux H, Witkowski T, Vabret F, de la Sayette V, Viader F, Desgranges B, Eustache F 528
Theory Revisited. Alcohol Clin Exp Res 32:1229–1241. 530
Prigatano GP (2009) Anosognosia: Clinical and ethical considerations. Curr Opin Neurol 22:606–611. 531
Rinn W, Desai N, Rosenblatt H, Gastfriend DR (2002) Addiction denial and cognitive dysfunction: a 532
preliminary investigation. J Neuropsychiatry Clin Neurosci 14:52–57. 533
Rueckert D, Sonoda LI, Hayes C, Hill DL, Leach MO, Hawkes DJ (1999) Nonrigid registration using 534
free-form deformations: application to breast MR images. IEEE Trans Med Imaging 18:712–21. 535
Schabus M, Dang-Vu TT, Albouy G, Balteau E, Boly M, Carrier J, Darsaud A, Degueldre C, 536
Desseilles M, Gais S, Phillips C, Rauchs G, Schnakers C, Sterpenich V, Vandewalle G, Luxen A, 537
Maquet P (2007) Hemodynamic cerebral correlates of sleep spindles during human non-rapid eye 538
movement sleep. Proc Natl Acad Sci 104:13164–13169. 539
Schmitz TW, Johnson SC (2007) Relevance to self: A brief review and framework of neural systems 540
underlying appraisal. Neurosci Biobehav Rev 31:585–596. 541
Schmitz TW, Kawahara-Baccus TN, Johnson SC (2004) Metacognitive evaluation, self-relevance, and 542
the right prefrontal cortex. Neuroimage. 543
Segobin S, Ritz L, Lannuzel C, Boudehent C, Vabret F, Eustache F, Beaunieux H, Pitel AL (2015) 544
Integrity of white matter microstructure in alcoholics with and without Korsakoff’s syndrome. 545
Hum Brain Mapp 36:2795–2808. 546
Sexton CE, Storsve AB, Walhovd KB, Johansen-Berg H, Fjell AM (2014) Poor sleep quality is 547
associated with increased cortical atrophy in community-dwelling adults. Neurology 83:967–73. 548
Sexton CE, Zsoldos E, Filippini N, Griffanti L, Winkler A, Mahmood A, Allan CL, Topiwala A, Kyle 549
SD, Spiegelhalder K, Singh-Manoux A, Kivimaki M, Mackay CE, Johansen-Berg H, Ebmeier 550
KP (2017) Associations between self-reported sleep quality and white matter in community-551
dwelling older adults: A prospective cohort study. Hum Brain Mapp 38:5465–5473. 552
Shany-Ur T, Lin N, Rosen HJ, Sollberger M, Miller BL, Rankin KP (2014) Self-awareness in 553
neurodegenerative disease relies on neural structures mediating reward-driven attention. Brain 554
137:2368–2381. 555
Shimamura AP, Squire LR (1986) Memory and Metamemory. A Study of the Feeling-of-Knowing 556
Phenomenon in Amnesic Patients. J Exp Psychol Learn Mem Cogn 12:452–460. 557
Smith SM, Jenkinson M, Woolrich MW, Beckmann CF, Behrens TEJ, Johansen-Berg H, Bannister 558
PR, De Luca M, Drobnjak I, Flitney DE, Niazy RK, Saunders J, Vickers J, Zhang Y, De Stefano 559
N, Brady JM, Matthews PM (2004) Advances in functional and structural MR image analysis 560
and implementation as FSL. Neuroimage 23:S208–S219. 561
Stein MD, Friedmann PD (2005) Disturbed sleep and its relationship to alcohol use. Subst Abus 26:1– 562
13. 563
Stroop JR (1935) Studies of interference in serial verbal reactions. J Exp Psychol 18:643–662. 564
Van Den Berg JF, Van Rooij FJA, Vos H, Tulen JHM, Hofman A, Miedema HME, Neven AK, 565
Tiemeier H (2008) Disagreement between subjective and actigraphic measures of sleep duration 566
in a population-based study of elderly persons. J Sleep Res 17:295–302. 567
Van der Linden M, Coyette F, Poitrenaud J, Kalafat M, Calicis F, Wyns C, Adam S (2004) L’épreuve 568
de rappel libre / rappel indicé à 16 items (RL/RI-16) In: L’évaluation Des Troubles de La 569
Mémoire : Présentation de Quatre Tests de Mémoire Épisodique Avec Leur Étalonnage , pp 25– 570
42. Marseille. 571
Walvoort SJW, van der Heijden PT, Wester AJ, Kessels RPC, Egger JIM (2016) Self-awareness of 572
cognitive dysfunction: Self-reported complaints and cognitive performance in patients with 573
alcohol-induced mild or major neurocognitive disorder. Psychiatry Res 245:291–296. 574
Wechsler D (1997) Wechsler Memory Scale- (Third Ed.). Psychol Corp. 575
Zahr NM (2014) Structural and microstructral imaging of the brain in alcohol use disorders, 1st ed, 576
Handbook of Clinical Neurology. Elsevier B.V. 577
Zhabenko N, Wojnar M, Brower KJ (2012) Prevalence and Correlates of Insomnia in a Polish Sample 578
of Alcohol-Dependent Patients. Alcohol Clin Exp Res 36:1600–1607. 579
8. FIGURE LEGENDS: 582
583
Figure 1: Prevalence of sleep complaint in HC, AUD and KS patients 584
The dotted line represents the cut-off score (5) of the PSQI, which indicates the presence of a sleep 585
complaint. For each boxplot, the median is represented by the bold line. HC = healthy controls; AUD 586
= patients with Alcohol Use Disorder without Korsakoff’s syndrome; KS = patients with Alcohol Use 587
Disorder with Korsakoff ‘s Syndrome. *:p<0.05 (Tukey’s tests). 588
589 590
591 592
Figure 2: Executive and episodic memory performance in controls and patients according to the 593
sleep complaint (A) and diagnosis (B) 594
This figure shows executive (left) and memory (right) z-scores. * : significant difference compared to 595
HC (p<.05); † : significant difference compared to complaintAUD (p<.05); ‡ : significant difference 596
compared to no-complaintAUD (p<.05). Tukey’s tests. 597
598 599
600 601
Figure 3: Structural brain abnormalities in patients with and without sleep complaint compared 602
with controls 603
A: Lower gray matter volumes (left) and altered white matter integrity (right) in no-complaintAUD+KS 604
compared to HC. B: Lower gray matter volumes (left) and altered white matter integrity (right) in 605
complaintAUD+KS compared to HC. We used a p value cutoff of p<0.001 uncorrected (larger images) 606
but also display the results using a restrictive p<0.05 corrected for family-wise error (smaller images) 607
to highlight the most significant regions. For D) No significant results at p<0.05 FWE. Cluster size: 608
>60 voxels. 609
611
Figure 4: Gray matter volume in controls and patients according to the sleep complaint (A) and 612
diagnosis (B) 613
A: voxel by voxel analysis, p<0.001 uncorrected, k=60. B: example of regions of interest extracted 614
from the previous analysis. * : significant difference compared to HC (p<.05) ; † : significant 615
difference compared to complaintAUD (p<.05) . Tukey’s tests. 616
617 618
Figure 5: White matter integrity in controls and patients according to the sleep complaint (A) 619
and diagnosis (B) 620
A: voxel by voxel analysis, p<0.001 uncorrected, k=60. B. example of regions of interest extracted 621
from the previous analysis. *: significant difference compared to HC (p<.05); †: significant difference 622
compared to complaintAUD (p<.05). Tukey's test
9. TABLES 624
TABLE 1: DEMOGRAPHICAL AND CLINICAL DESCRIPTION OF THE HEALTHY CONTROLS (HC),
625
ALCOHOL USE DISORDER PATIENTS WITHOUT KORSAKOFF’S SYNDROME (AUD) AND ALCOHOL
626
USE DISORDER PATIENTS WITH KORSAKOFF’S SYNDROME (KS
627 628 HC (N=20) AUD (N=37) KS (N=17) Post-hoc comparisons Age 42.50±5.94 [31;53] 45.59±9.21 [32;65] 56.41±4.79 [49;67] (HC = AUD) > KS
Gender. male % 80% 70.3% 41.2% (HC = AUD) > KS
Education (years of schooling) 12.20±2.01 [9 ;15] 11.43±1.57 [9 ;15] 10.65±2.34 [8 ;15] HC = AUD ; HC > KS ; AUD = KS BMI [19.53 ;48.88] 26.53±6.73 [16.02 ;39.84] 24.23±4.61 [15.94 ;35.42] 23.77±5.45 HC = AUD = KS BDI 3.25±3.47 [0 ;14] 13.11±7.64 [2 ;28] 7.05±6.33 [0 ;19] (HC = KS) < AUD STAI A 26.05±6.68 [20 ;47] 32.32±35 [20 ;61] 35±13.99 [20 ;66] HC = AUD = KS STAI B 32.80±7.59 [20 ;50] 44.22±12.47 [28 ;72] 38.67±10.03 [24 ;57] HC < AUD ; HC = KS ; AUD = KS
AUDIT 2.7±1.92
[0 ;6]
28.92±6.22
[9 ;40] NA HC < AUD
Alcohol use (years) / 15.30±4.06
[7 ;32] NA /
Alcohol misuse (number of
years) / 16.54±8.34 [2 ;34] NA / Alcohol dependence (number of years) / 8.65±7.73 [0 ;34] NA /
Daily alcohol consumption
(unitsa) / 18.49±8.82 [0-39.4] NA /
Number of previous
detoxifications /
2.64±2.21
[0 ;11] NA /
Maximum Cushman score / 5.33±2.42 [0 ;11] NA / Days of sobriety before
inclusion /
10.5±3.99
[4 ;21] NA /
Mini Mental State Examination (MMSE) (/30) 29.22±0.73 [28 ;30] 27.17±2.15 [21 ;30] 22.59±3.75 [12 ;27] HC > AUD > KS Executive Functions (z-scores) 0±0.68 [-1.57 ;1.10] -1.14±1.66 [-5.98 ;0.67] -2.46±2.48 [-8.6 ;0.48] HC > AUD > KS Episodic Memory (z-scores) [-2.15;1.25] 0±1 [-4.43;1.54] -0.97±1.57 [-6.99;-3.57] -5.33±0.99 HC > AUD > KS
TABLE 2:DESCRIPTIVE STATISTICS IN THE DIFFERENT SUBGROUPS ACCORDING TO THE SLEEP COMPLAINT
HC No-complaint Complaint
n=20 No-Complaintn=25 AUD+KS ComplaintNo- AUD
n=11 No-ComplaintKS n=13 Complaint AUD+KS n=29 Complaint AUD n=26 Complaint KS n=3 Age (years) 42.50 ± 5.94 [31-53] 50.68 ± 9.55 [34-67] 42.73 ± 8.16 [34-61] 56.93 ± 4.66 [49-67] 47.55 ± 9.37 [32-65] 46.81 ± 9.51 [32-65] 54 ± 5.57 [49-0] Gender. male % 80% 60% 81.81% 42.85% 62.06% 65.38% 33.3% Education (years) 12.20 ± 2.01 [9-15] 11.4 ± 2.08 [8-15] 11.78 ± 1.64 [9-14] 10.93 ± 2.33 [8-15] 11.00 ± 1.66 [8-15] 11.32 ±1 .56 [9-15] 9.33 ± 2.3 [8-12] BMI [19.53-48.88] 26.53 ± 6.73 [15.94-35.42] 24.16 ± 4.63 [19.23-29.97] 24.07 ± 2.7 [15.94-35.42] 23.89 ± 5.85 24.161 ± 5.09 [16.02-39.84] [16.02-39.84] 24.30 ± 5.26 [19.53-46.88] 23.24 ± 6.73 BDI 3.25 ± 3.47 [0-14] 9.4 ± 8.11 [0-27] 14.73 ± 8.17 [4-27] 5.21 ± 5.22 [0-15] 12.75 ± 7.16 [2-28] 12.42 ± 7.46 [2-28] 15.67 ± 3.05 [13-19] STAI A 26.05 ± 6.68 [20-47] 32 ± 11.99 [20-59] 33.09 ± 13.44 [20-59] 31 ± 11 [20-55] 33.96 ± 12.37 [20-66] 32.00 ± 10.71 [20-61] 51.00 ± 15.00 [36-66] STAI B 32.80 ± 7.59 [20-50] 39.65 ± 10.65 [24-59] 43.73 ± 11.31 [28-59] 35.92 ± 8.87 [24-50] 44.96 ± 12.64 [28-72] 44.42 ± 13.13 [28-72] 49.67 ± 6.65 [44-57] AUDIT 2.7 ± 1.92 [0-;6] / 26.64 ± 8.23 [9-39] / / 29.92±4.97 [16-40] / Alcohol use (years) / NA 14.36 ± 2.61 [10-19] NA NA 15.69±4.53 [7-32] NA Alcohol misuse (number of
years) / NA
18.27 ± 7.65
[6-26] NA NA 15.81±8.65 [2-34] NA
Alcohol dependence
(number of years) / NA 9.72 ± 7.79 [2-26] NA NA 8.16±7.82 [0-34] NA Daily alcohol consumption
(units) / NA
19.03 ± 8.69
[0-30] NA NA 18.23±9.07 [2-39.40] NA
Number of previous
detoxifications / NA 3.81 ± 3.21 [0-11] NA NA 2.15±1.43 [0-6] NA Maximum Cushman score / NA 5.9±1.91 [3-9] NA NA 5.11±2.59 [0-11] NA Days of sobriety before
TABLE 3: PREVALENCE, SEVERITY AND NATURE OF THE SLEEP COMPLAINT ON THE PSQI IN HEALTHY CONTROLS (HC), ALCOHOL USE DISORDER PATIENTS WITHOUT KORSAKOFF’S SYNDROME (AUD) AND ALCOHOL USE DISORDER PATIENTS WITH KORSAKOFF’S SYNDROME (KS).
HC AUD KS Statisticsa Post hoc
comparisonsb Total score (0 to 21) Prevalence (PSQI >5) 0% 70% (N=26) 17% (N=3) Χ2 = 31.19 p<0.0001 AUD > KS = HC Severity 3 ± 1.21 [1-5] 8.32 ± 3.97 [0-17] 3.35 ± 2.80 [0-9] F(2.68)=26.63 p<0.0001 AUD > KS = HC Subcomponents (0 to 3) Subjective sleep quality 0.6 ± 0.5 [0-1] 1.35 ± 0.85 [0-3] 0.52 ± 0.51 [0-1] F(2.68)=10.98 p<0.0001 HC = KS > AUD Sleep latency 0.6 ± 0.68 [0-2] 1.32 ± 0.94 [0-3] 0.76 ± 1.03 [0-3] F(2.68)=5.30 p=0.007 HC = KS ; HC < AUD ; AUD = KS Sleep duration 0.6 ± 0.82 [0-3] 1.21 ± 1.05 [0-3] 0.11 ± 0.33 [0-1] F(2.68)=8.75p=0.0004 HC = KS; HC = AUD; KS > AUD Habitual sleep efficiency 0.05 ± 0.22 [0-1] 0.70 ± 1.10 [0-3] 0.29 ± 0.58 [0-2] F(2.68)=10.55 p<0.0001 HC = KS ; HC < AUD; AUD= KS Sleep disturbances 0.85 ± 0.36 [0-1] 1.64 ± 0.78 [0-3] 0.76 ± 0.56 [0-2] F(2.68)=13.48 p<0.0001 HC = KS > AUD Use of sleeping medication 0.05 ± 0.22 [0-1] 0.97 ± 1.38 [0-3] 0.52 ± 1.17 [0-3] F(2.68)=4.36 p=0.01 HC = KS ; HC < AUD; AUD = KS Daytime dysfunction 0.25 ± 0.44 [0-1] 1.10 ± 0.77 [0-3] 0.35 ± 0.78 [0-3] F(2.68)=10.99 p<0.0001 HC = KS > AUD Quantitative data Sleep duration (min) 447±49.53 [360-510] 397.02±107.37 [180-660] 499.41±71.10 [420-720] F(2,68)=7.57 p=0.001 HC = KS; HC = AUD; KS > AUD Sleep latency (min) 14.75±9.38 [5-30] 26.27±25.88 [0-120] 22.5±15.76 [7.5-60] F(2,68)=3.76 p=0.03 HC = AUD = KS Sleep efficiency (%) 94.61±5.33 [82.35-100] 84.24±16.58 [36.36-100] 90.67±7.59 [77.77-100] F(2,68)=8.22 p=0.0006 HC = KS; HC > AUD; AUD = KS
TABLE LEGENDS
Table 1: Demographical and clinical description of the healthy controls (HC), alcohol use disorder patients without Korsakoff’s syndrome (AUD) and alcohol use disorder patients with Korsakoff’s syndrome (KS).
Mean ± Standard Deviation and range [minimum; maximum] are reported. BMI= Body Mass Index; BDI = Beck Depression Inventory; STAI = State-Trait Anxiety Inventory; AUDIT = Alcohol Use Disorders Identification Test. NA: not available ; a: an alcohol unit = 10g of pure ethanol
Table 2: Descriptive Statistics in the different subgroups according to the sleep complaint
Mean ± Standard Deviation and range [minimum; maximum] are reported. BMI= Body Mass Index; BDI = Beck Depression Inventory; STAI = State-Trait Anxiety Inventory; AUDIT = Alcohol Use Disorders Identification Test. NA: not available ; a: an alcohol unit = 10g of pure ethanol
Table 3: Prevalence, severity and nature of the sleep complaint on the PSQI in healthy controls (HC), alcohol use disorder patients without Korsakoff’s syndrome (AUD) and alcohol use disorder patients with Korsakoff’s syndrome (KS).
The prevalence of sleep complaint corresponded to the proportion of participants in each group (HC, AUD, KS) with a PSQI total score > 5 which is a validated cut-off score indicating poor sleep quality. The severity of sleep complaint corresponded to the mean PSQI total score for each group (HC, AUD, KS) which is to the sum of the seven PSQI subcomponents, ranging from 0 (no sleep complaint) to 21 (major sleep disturbances). Each PSQI subcomponent score ranged from 0 (good) to 3 (poor). For PSQI continuous variables, short sleep duration and low sleep efficiency correspond to higher component scores. a: Data were analyzed using ANCOVAs adjusted for age, sex and body mass index (BMI), except for the frequency of sleep complaint for which we used a Chi² test. b: Between-groups comparisons were performed with Tukey’s tests corrected for unequal sample size. Mean ± Standard Deviation and range [minimum-maximum] are reported.