HAL Id: inserm-00189555
https://www.hal.inserm.fr/inserm-00189555
Submitted on 21 Nov 2007HAL is a multi-disciplinary open access archive for the deposit and dissemination of sci-entific research documents, whether they are pub-lished or not. The documents may come from teaching and research institutions in France or abroad, or from public or private research centers.
L’archive ouverte pluridisciplinaire HAL, est destinée au dépôt et à la diffusion de documents scientifiques de niveau recherche, publiés ou non, émanant des établissements d’enseignement et de recherche français ou étrangers, des laboratoires publics ou privés.
Comparison of the pharmacokinetics of S-1, an oral
anticancer agent, in Western and Japanese patients.
Emmanuelle Comets, Kazumasa Ikeda, Paulo Hoff, Pierre Fumoleau, Jantien
Wanders, Yusuke Tanigawara
To cite this version:
Emmanuelle Comets, Kazumasa Ikeda, Paulo Hoff, Pierre Fumoleau, Jantien Wanders, et al.. Compar-ison of the pharmacokinetics of S-1, an oral anticancer agent, in Western and Japanese patients.. Jour-nal of Pharmacokinetics and Pharmacodynamics, Springer Verlag, 2003, 30 (4), pp.257-83. �inserm-00189555�
Comparison of the pharmacokinetics of S-1, an oral anticancer
agent, in Western and Japanese patients
Emmanuelle Comets1,6, Kazumasa Ikeda2, Paulo Hoff3, Pierre Fumoleau4, Jantien Wanders5,
Yusuke Tanigawara1
1Department of Pharmacy, Keio University Hospital, Tokyo 160–8582, Japan
2Taiho Pharmaceutical Co, Ltd., Tokushima Research Center, Tokushima 771–0194, Japan
3 Department of Gastrointestinal Medical Oncology and Digestion Diseases, University of Texas,
Houston, USA
4Centre René Gauducheau, Nantes, France
5NDDO Oncology, 1081 JD Amsterdam, The Netherlands
6 Inserm E 0357, Dpt of Epidemiology, Biostatistics and Clinical Research, Hopital Bichat-Claude
Bernard, 46 rue Henri Huchard, 75 018 Paris, France
Corresponding author: Professor Yusuke Tanigawara, Department of Pharmacy, Keio University Hospital, Tokyo 160–8582, Japan
Tel: +81-(0)3-5363-3847 Fax: +81-(0)3-5269-4576
Email: tanigawa@sc.itc.keio.ac.jp
HAL author manuscript inserm-00189555, version 1
HAL author manuscript
A
BSTRACT
Objective: S-1 is an oral anticancer agent combining tegafur (FT), a prodrug of 5-fluorouracil (5-FU),
with potassium oxonate (oteracil) and gimeracil (CDHP) respectively to mitigate gastrointestinal tox-icity and increase the half-life of 5-FU. This article presents a population pharmacokinetic analysis of these four compounds in Western cancer patients. The second objective was to compare the pharma-cokinetics of S-1 in Western and Japanese patients.
Methods: A single dose (25-45mg/m2) of S-1 was administered to 60 patients. In each patient, 6 concentrations of FT, 5-FU, oteracil and CDHP were measured over 24hr. Using NONMEM, oteracil and CDHP were analysed separately, and the individual estimates of CDHP parameters were included in the joint analysis of FT and 5-FU. We used validation techniques to assess differences between the two populations, and finally we compared the exposures in Western and Japanese patients using simulations.
Results: A compartmental model describing the PK of the 4 compounds was developed. The
in-fluence of CDHP on the elimination of 5-FU was well described by an enzymatic inhibition model. The model provided a good fit for all compounds. The pharmacokinetics for 5-FU and oteracil were similar between Western and Japanese patients, but apparent differences in exposure to 5-FU resulted from different total doses due to different body sizes.
K
EYWORDS
-5-FU -oral anticancer drug
-population pharmacokinetics -model validation
-ethnic differences
I
NTRODUCTION
5-fluoro-uracil (5-FU) is one of the most frequently used agent in the treatment of colorectal, head and neck, bladder and breast cancer. A recent meta-analysis pooling 1219 colorectal cancer patients showed that sustained intravenous infusions have provided so far the best administration method, with reduced toxicity and enhanced clinical activity when compared to bolus doses [1]. These administration methods are however difficult to apply to outpatients and increase the risk of infections and clinical complications. When given as oral doses, 5-FU is irregularly absorbed, a feature which is attributed to high interindividual variability in the levels of dihydropyrimidine-dehydrogenase (DPD), the enzyme responsible for 5-FU degradation, in the gut. Since DPD is the only enzyme degrading 5-FU in the body, it is also held responsible for the high interindividual variability in the elimination of 5-FU. Furthermore a circadian rhythm in the activity of this enzyme has been shown, contributing to the erratic elimination observed [2]. The search for orally administered anticancer agents has therefore focused on prodrugs of 5-FU which can provide more constant concentrations of the active agent in blood. Modulation of 5-FU metabolism is also investigated as a means to enhance its clinical efficiency [3].
S-1 is a novel anti-cancer combination containing tegafur (FT), a prodrug of 5-FU, as the active agent, and two biochemical modulators designed to enhance the anti-tumor activity of 5-FU. Potas-sium 1,3,5-triazine 2,4(1H,3H)-dione-6-carboxylate (potasPotas-sium oxonate or oteracil) inhibits phos-phorylation of 5-FU in the gut by inhibiting the enzyme pyrimidine phosphorybosyl transferase, and is included in S-1 in an attempt to reduce 5-FU-induced gastrointestinal toxicity [4]. Oteracil is mainly distributed in the gastrointestinal tract but the concentrations in the plasma can be used as surrogates under the assumption that they reflect the concentrations in the GI tract [5]. 5-chloro-2,4-dihydroxypyridine (gimeracil or CDHP) is an inhibitor of DPD, and is included in an attempt to
enhance the anti-cancer activity of 5-FU by increasing its half-life. S-1 is administered as capsules in which FT, CDHP and oteracil are combined at a molar ratio of 1:0.4:1, each capsule containing 20 or 25 mg of FT.
Several studies have investigated the efficacy and safety of S-1 in patients. Phase I and early phase II studies in Japan demonstrated antitumour activity, with efficacy rates (partial responses) of 40 to 54% for gastric, breast and head and neck cancer, comparing favourable with other fluoropyrimidine drugs [3]. In these studies, administration regimen consisted of doses of 40 to 75 mg given twice daily for 28 days followed by one week rest. Pharmacokinetics were also investigated in 12 patients after single (n=12) and multiple (n=10) administration [6].
The objective of the present study was to study the pharmacokinetics (PK) of S-1 in Western patients (American and European) and to compare the characteristics of S-1 between Western and Japanese patients. In the first stage, we analysed phase-I data from 3 studies performed in American and European patients, in which the plasma concentrations of the four compounds were measured for 24 hours after a single administration of S-1 in patients. We developed models to describe the PK of CDHP and oteracil. We then described the PK of FT and 5-FU, including the inhibition of 5-FU elim-ination as a function of the concentration of CDHP, using the individual pharmacokinetic parameters for CDHP. The models were validated using pseudo-residuals. In the second stage, we examined the differences between Western and Japanese patients. We proposed several methods to compare the two populations using the results of the two separate population analyses: we applied model validation techniques to assess the similarity between the two populations, and we also compared the exposures to the four compounds using simulations.
D
ATA AND
M
ETHODS
Patients and analytical methods
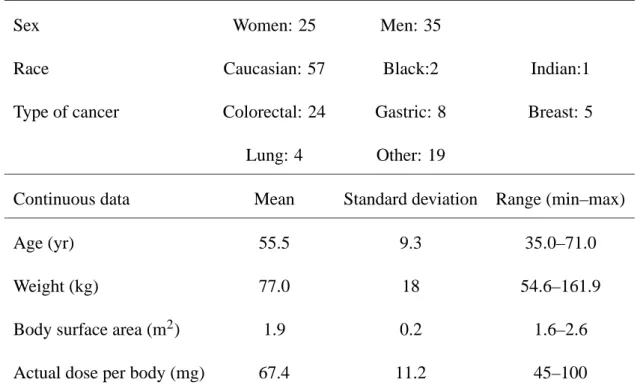
Sixty patients from 3 open-label, non randomised phase-I studies provided pharmacokinetic data for S-1 in Western patients. The clinical findings of the first study, involving 28 European patients in a dose-escalation trial, have been reported in Groeningen et al. [7]. In addition, 18 European patients from a food-effect study and 14 American patients from a dose-escalation trial were included. For the 18 patients from the second European study, for consistency only the data from the fed period was used, so that all patients included in the present analysis received S-1 after a meal. This was because the European food effect study had showed that the AUC of oteracil was increased 2.5 fold when patients were fasted (unpublished data). In the three studies, patients over 18 years old, with documented solid tumors were eligible for inclusion. Exclusion criteria included other serious medi-cal conditions, severe renal or liver impairment, and patients were not to have received chemotherapy, immunotherapy or radiotherapy for at least 4 weeks prior to inclusion. Written informed consent was obtained from all patients. The study was approved by the scientific and ethical review committees of the participating institutions. Table I gives a summary of the main demographic characteristics of these patients.
The three studies shared a similar protocol. Patients were administered a single dose of S-1 (25–45mg/m2) at time 0, and a 15 mL blood sample was collected in heparinised tubes at the fol-lowing time points after administration: 30 min, 1, 2, 4, 8 and 24 hours. Measurement of FT, 5-FU, CDHP and oteracil concentrations in plasma were conducted according to the method by Mat-sushima et al. [8]. Briefly, FT was extracted from plasma with dichloromethane and analyzed by a high-performance liquid chromatography (HPLC) with ultraviolet detection. 5-FU and CDHP were extracted from the same plasma aliquot using ethylacetate followed by derivatization with
orobenzylbromide (PFBBr), and analyzed by a gas chromatography with negative ion chemical ion-ization mass spectrometric detection (GC-NICI-MS). In the European dose-escalation study [7], an HPLC method was used for the determination of CDHP, and the consistency of the two assay methods has been validated. Oteracil was extracted from separate plasma aliquot by a solid phase extraction (NH2 Bond Elut columns), followed by derivatization with PFBBr and determined by the GC-NICI-MS detection. The lower limits of quantification for the four compounds in the analytical assays were 10 ng.mL−1for FT, 1 ng.mL−1for 5-FU, 2 ng.mL−1for CDHP and 1 ng.mL−1for oteracil. The vari-ation of the assay (reproducibility) was less than 10% for all compounds except at the LOQ, where it was 20%. The bias was also less than 10% [8].
The results from the analysis in Western patients were compared to the results of a population analysis of S-1 in Japanese patients [9]. In the Japanese analysis, 34 patients from a phase I study, 53 patients from phase II studies and 12 patients from a pharmacokinetic study, were included. The Japanese and Western populations were similar with respect to gender, presence of liver metastases and cancer types. 21 patients out of 60 had liver metastases in the Western population (35%) versus 36 out of 99 in the Japanese population (35%, NS). 20 out of 60 patients were classified as gastric cancer in the Western population (17%), versus 21 out of 99 in the Japanese population (21%, NS). 26 out of 60 patients were classified as colorectal cancer in the Western population (43%), versus 29 out of 99 in the Japanese population (29%, NS). However, because the Japanese analysis pooled patients from several different clinical studies, this does not reflect the actual distribution of cancers in the two populations. Japanese patients received a similar range of doses relative to body surface area, denoted BSA (17–150, median 72.5 mg) compared to Western patients, however because Western patients were on average heavier than Japanese patients, doses per body were generally lower in the Japanese population (25–200, median 111.1 mg).
Data analysis methods
Model building: Because CDHP concentrations are not affected by the other constituents of S-1 but are likely to influence the pharmacokinetics of 5-FU, we first performed a separate population PK analysis of CDHP alone. We then developed a model to describe the inhibition of 5-FU elimination as a function of the concentration of CDHP. We used the individual pharmacokinetic parameters esti-mated during the first analysis as fixed covariates for the second analysis. Oteracil was also analysed separately.
A similar structural model for the PK of the four compounds was developed in Japanese patients by Ikeda et al. [9]. The kinetics of CDHP, FT and oteracil were found to follow a two-compartment model, and the kinetics of 5-FU a one-compartment model. Figure 1 is a graphical representation of this model. Equation 1 describes the enzyme inhibition model used to model the inhibition of the elimination of 5-FU by CDHP. In this equation, the elimination rate constant kel is a function of CCDHP, the concentration of CDHP, kel,0, the rate constant in the absence of CDHP and ki, an inhibition constant:
kel=
kel,0
1+CCDHP/ki (1)
Because model building is described in details elsewhere [9], in the present study we focused more on investigating the relationships between the covariates and the pharmacokinetic parameters. The model for interindividual variability on parameters was an exponential error model, to ensure that the parameters remain positive. For parameterθ( j)with population meanθ( j)0 , individual parameters θ( j)
i for individual i was modelled according to:
θ( j)
i =θ
( j)
0 eηi (2)
withηi∼
N
(0,σ( j) 2). In this model,σ( j)represents approximately the coefficient of variation of the variability of the individual parameters.The analyses were performed using NONMEM version 5.1 [10] on a Linux PC (Red Hat 7.0, GNU Fortran compiler). Unless otherwise specified, the FOCE (First Order Conditional) method with theINTERACTIONoption was used. The analysis of the results was handled using the R statis-tical and graphical environment [11]. We explored the relationships between covariates and post-hoc estimates of individual parameters using plots and correlation tests for the continuous covariates and non parametric location test (Wilcoxon rank sum test) for binary covariates. Linear mixed effect modelling followed by one-way analysis of variance was used for the categorical covariate cancer type. The covariates yielding a p-value lower than 0.01 were then tested for inclusion in the model. Statistical significance was assessed by the change in the objective function (equal to minus twice the log-likelihood). For nested (reduced versus full) models, asymptotically the difference is approx-imately distributed as aχ2 with (n − p) degrees of freedom, where n is the number of parameters of the full model and p that of the nested model. We also examined the following plots to evaluate the goodness of fit of each model:
• scatterplots of predictions (population and individual) versus individual observations;
• population weighted residuals versus predictions and versus independent variable (time);
• absolute weighted residuals versus individual predictions.
Treatment of values below the quantification limit: Most patients were found to have mesure-ments below the quantification limit (BQL) for oteracil and 5-FU. Censoring the data by simply excluding BQL is problematic, and may give rise to biased estimates of the parameters [12]. We therefore used the following simple way to account for BQL values. If for example there were sam-ples at 6, 8, 10 and 24 hours and the samsam-ples at 10 and 24 hours are BQL, we imput the value at 10 hours to BQL/2 and censored the value at 24 hours as missing. The same principle applied if these
to BQL/2. A combined proportional and additive error model was then used to reflect the uncertainty of these values:
var(εi, j) =θ21+σ2C2 (3)
The additive part of this model, represented by parameter θ1 in this equation, was fixed to BQL/2, ensuring that the standard deviation of the error always covered the interval [0,BQL]. σ was the coefficient of variation.
Model validation: The final model for each compound was validated using pseudo-residuals, a new validation approach proposed by Mesnil et al. [13]. This distribution-free method provides more accurate residuals than the standardised prediction errors [14], which assume normality of the predic-tions conditional to the parameters. The pseudo-residuals are computed as follows. Let
D
denote the distribution of the individual parameters, a multivariate normal in NONMEM with parameters notedµ andΩ(respectively the mean vector and variance-covariance matrix of the population parameters). To compute the pseudo-residuals, we used stochastic simulation [15]. For each individual i, K=500 values were drawn in
D
. Let (Ci, j)p be the predicted concentration for (θi)p, the pth value of the parameters, at time ti, j and yi, j, the corresponding measured concentration. The simulated residual is then:(rsi, j)p= yi, j− (Ci, j)p
(σi, j)p (4)
where(σi, j)p is the standard deviation of the predicted measured concentration and may depend on (θi)pin the case of heteroscedastic variance models. The pseudo-residuals are then computed as:
pri, j= Z yi, j −∞ K
∑
p=1 1Kp(y/(θi)p,ti, j)dy =
∑
p1
KΦ((rsi, j)p) (5)
whereΦis the cumulative density function of a zero-mean, unit variance gaussian variable.
If all the observed concentrations were independent, the pseudo-residuals should have a uniform distribution over [0,1] and a one-sample Kolmogorov-Smirnov test can be used to test this assumption.
In the presence of repeated measurements, correlations tend to increase the type-I error of the test. An empirical threshold for the test was estimated using 200 replications of the original data set: for each replication, values of the parameters were drawn in
D
for each subject and the corresponding predicted measured concentrations were computed. For each replicated data set, pseudo-residuals were computed for and the p-level of the corresponding Kolmogorov-Smirnov tests was stored. The empirical threshold for the test was then defined as the 5%-percentile of the 200 p-values.Comparison between Western and Japanese patients: Three complementary approaches were used to compare the pharmacokinetics of S-1 in the two populations. First, we used the pseudo-residuals to establish the predictability of the model and the estimated population parameters in the Japanese population. Indeed, model validation techniques using residuals actually evaluate whether the observed data could arise under the model and parameters, so pseudo-residuals from the Western model to the Japanese data assess whether we can extrapolate the model to Japanese data.
Second, we computed prediction intervals, again using simulations with the population distribu-tion estimated in the Western analysis: for each individual, 100 sets of parameters were drawn from this distribution, keeping the subject’s dose and covariates. For each time point the 2.5 and 97.5% percentile of the predicted concentrations over all the corresponding individuals marked the boundary of the prediction interval. By plotting this interval for each sampling point over the observations, we could assess how well predictions from the Western analysis represented the data in the Japanese population.
Third, we compared parameters estimated in each population. The Japanese population parameter estimates were obtained by Ikeda et al.[9]. We also compared the estimated exposures in the two populations, by calculating the area under the concentration-time curve (AUC) over 24 hours. The doses corresponding to the first day of the first course were used to calculate the exposure.
R
ESULTS
Model building
Analysis of CDHP data: Figure 2 shows the data, as a plot of the concentration versus time for the four compounds. Starting from the two-compartment model with a full covariance-structure and an additive error model, we checked that a one-compartment model was significantly worse (p<0.001). Because the random effects on the transfer rate constants between peripheral and central compartment are usually difficult to estimate, we tested a model without variability on these constant, and this did not change the objective function. Although the absorption of S-1 was reported as very fast, there was some misfit around the Cmaxvalues that could be explained by a change in the absorption model, such as non-linear absorption or an absorption time lag. The introduction of a time-lag allowed a large decrease in the objective function (p<10−4), whereas non-linear elimination using a Michaelis-Menten model did not improve the fit. Parallel increase of the Vmand Kmparameters in this model made the covariance matrix singular, indicating that the elimination is closer to linear. We did not find any covariate related to the pharmacokinetic parameters. One patient (patient 209) was excluded from model building because her data was erratic (high concentrations and large fluctuations).
We then proceeded to compute the pseudo-residuals to validate the model. Although there was no apparent trend in the residual plots to suggest a change in the error model structure, simulations performed using the final estimates of this model showed a tendency to overpredict late (low) con-centrations. As a result, this model was rejected using pseudo-residuals. One possible solution was to change the error model structure, because with a homoscedastic variance, the absolute size of the error is similar for high and low concentration which may penalise the fit for low concentrations. We tested this using a combined proportional and additive error model and treated the BQL concentra-tions as indicated in Methods for 5-FU and oteracil. This model improved the bias at later times, and
also improved the pattern of the pseudo-residuals.
With this model we repeated the covariate selection process, as this step is known to be sensitive to the assumptions in the error model, and found a linear relationship between the body surface area (BSA) and the volume of distribution. The model was also improved when a random effect for the absorption time-lag was included in the model, but because of the dependency between the parameters of the absorption model we needed to include a covariance term between Tlag,CDHP and kabs,CDHP (the correlation was estimated to beρ=- 0.24 with a standard error of 82%). The negative correlation between these two parameters could indicate variability in the dissolution process or in the gastric emptying time. Table II summarises the estimates of the parameters and their variability when applicable, as obtained using the final model in all 60 patients (including patient 209), and also shows the estimated standard errors of estimation (SE). The parameters were very similar to those estimated with an additive error model, except for the estimate of kabs,CDHP(previously 2.1 hr−1) and k2,1,CDHP (previously 0.18 hr−1).
Figure 3-a shows a plot of the population predicted concentrations versus observations for this compound, in log-log scale. Patient 209 was omitted from the plot. Apart from this patient the fit was very good, with no structural bias. Also, the prediction intervals represented the observations more faithfully especially at later times. This model was successfully validated using pseudo-residuals, with a p-value of 0.046, while the empirical threshold was determined to be 0.016 using 200 simulations.
Joint analysis of FT and 5-FU data: We used the final model and population parameters from the CDHP analysis to obtain the individual Bayesian estimates of the pharmacokinetic parameters of CDHP for each patient. A second data set was used, including the FT and 5-FU data as dependent variables, and the CDHP observed concentrations and the individual Bayesian estimates of the param-eters as fixed covariates for the next analysis. Again we excluded patient 209 from model building.
The error model was heteroscedastic for 5-FU to account for the large number of BQL measure-ments, however for FT we found that an additive error model described the data better. Compared to the model without inhibition, a model taking into account the influence of CDHP provided a large im-provement in the objective function and in the diagnostic plots (p<0.001), performing slightly better than a nonlinear elimination model. For FT, there was no improvement in the fit obtained by assuming an absorption time-lag. In this model we could not identify interindividual variability for kel,0.
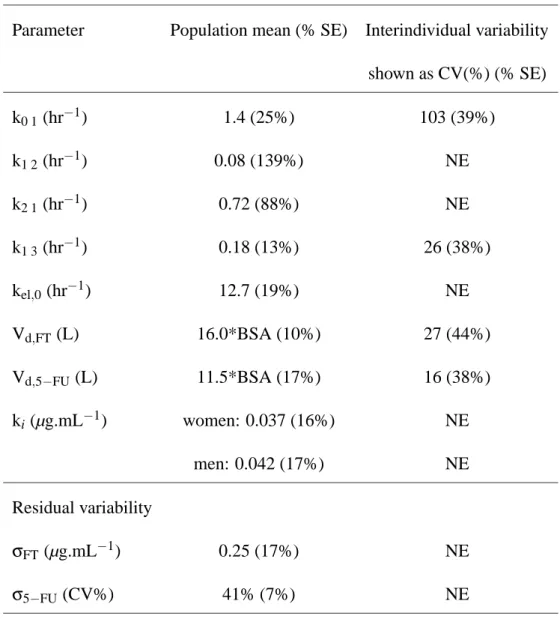
We then explored the relationships with the covariates, and found a significant correlation of Vd,FT with weight and BSA (p<0.001), as well as a slight correlation of kiwith weight and BSA (p<0.01) and more significantly with sex (p<0.003). Vd,5−FU was also correlated with BSA (p<0.001). These covariates were then tested for inclusion in the model, one at a time. Body weight and BSA were as could be expected significantly correlated to one another (p<10−4), so only one was kept in the final model. Oncologists are more familiar with BSA, and including either covariate resulted in two equivalent models, therefore we used preferably BSA in our model, as for CDHP. The inclusion of an effect of BSA on ki was not significant, however we could identify different values for men and women. After inclusion of the covariates the variance of the random effect on kiwas driven to zero and was eliminated from the model. We also found correlations between the estimates of some random effects and included a covariance term between k1,3 and Vd,5−FU (ρ=0.79) and between the two volumes of distribution (ρ=- 0.60). Table III shows the estimates of the population parameters and their standard error of estimation, again including all 60 patients.
The residual plots (not shown) indicate some bias in the plot of the weighted residuals versus time for both compounds. No such distorsion appears in the plots of predicted versus observed concentra-tions in figure 3, lower left plot, for 5-FU but there is a slight bias for FT at low concentraconcentra-tions (fig-ure 3-upper right plot). Plots of Bayesian predicted concentrations versus observations (not shown) indicate that there is no bias at low concentrations for CDHP, 5-FU or oteracil, although the bias for
FT remains. As expected however, the dispersion is large for these concentrations below the LOQ. For FT on the other hand, the model failed the validation test (p<0.0005), but the problem was caused mainly by the low concentrations at late times, as apparent in the upper right plot of figure 3, and this small bias is unlikely to have a clinically significant influence. Because there was good model adequation for 5-FU which was our main focus of interest we kept the present model in the following. We simulated the 5-FU concentration versus time profile in the presence of CDHP by using the mean parameters reported in tables III and II, and in the absence of CDHP by fixing the elimination rate constant to kel,0. The Cmaxin the presence of CDHP was 0.23 mg.L−1(versus 0.03 mg.L−1 with-out CDHP, 7-fold increase), and the AUC increased from 0.26 to 1.10 mg.L−1.hr (4-fold increase). AUC was computed as the area under the concentration curve over 48 hours extrapolated to infinity, estimated from the simulated profile using the trapezoidal rule. These results illustrate the dramatic impact of coadministering CDHP.
Analysis of oteracil data: The concentration versus time data for oteracil were analysed separately as for CDHP. We included all 60 patients for this analysis. The two-compartment model with an absorption time-lag showed adequate fit (p<0.001). Using Bayesian estimates from this model, we examined the relationships of the estimated parameters with the covariates. A linear relationship was found between the volume of distribution and the body surface area BSA, which provided a decrease in the objective function (p<0.001). We also found that the type of cancer influenced both the absorption rate constant and the volume of distribution. Specifically, gastric cancer patients had faster absorption and smaller volumes than the other patients (p<0.01 using a one-way analysis of variance on the result of a linear mixed effect model fit). Assuming a different variance for these parameters in gastric cancer patients did not improve the objective function, probably due to the small number of patients with gastric cancer (n=8). Including the cancer type as a covariate for the
rate absorption constant and the volume of distribution led to a significant decrease in the objective function (p<0.001). Also this model allowed more precise estimates of interindividual variability, and improved the residual plots.
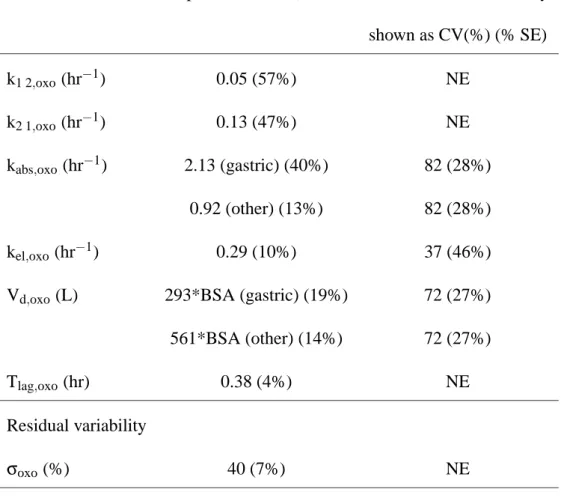
Table IV shows the parameter estimates obtained in the final model and figure 3-d shows the plots of predicted versus observed concentrations for this model. A slight bias in the structural model was observed, leading to higher residuals around the time of Cmax (not shown), but no satisfactory alter-native was found using other models such as zero-order absorption, saturable absorption or nonlinear elimination models. As seen from figure 3-d however, the model provided a good fit.
Model validation: For each of the final models, model validation was performed to check the goodness-of-fit of the models in the Western population. Pseudo-residuals were computed using 500 parameter samples for each individual, and the normalised pseudo-residuals were obtained. QQ-plots of the pseudo-residuals are shown in figure 4 for the four compounds: for each compound, the quantiles of the normalised pseudo-residuals are plotted against the theoretical quantiles from a normal distribution. Departures from the line x=y indicate departures from the expected distribution. Here, for all compounds, the assumption of a normal distribution appears reasonable.
Model adequacy was formally tested using a Kolmogorov-Smirnov test to compare the pseudo-residuals to the uniform distribution over [0,1], and p-values of 0.046, 0.00045, 0.067 and 0.0016 were found respectively for CDHP, FT, 5-FU and oteracil. Empirical p-values for this test were determined using 200 replications of the original data set and found to be respectively 0.016, 0.011, 0.014 and 0.0004. Therefore, the models for CDHP, 5-FU and oteracil were considered adequate, when taking into account that the subjects usually have repeated (correlated) measurements. The model for FT on the other hand failed the validation test when taking into account all the measurements, because of a systematic underprediction at late times.
Comparison with Japanese data
Validation approach: Another major objective of this study was to assess whether Western and Japanese patients shared common pharmacokinetics in response to S-1. A test of goodness-of-fit of the Western model and parameter estimates in the Japanese data set was provided by the approach used for model validation. We treated the Japanese data set as a validation data set and computed pseudo-residuals using simulations based upon the model and parameters estimated from the Western data. For this analysis we only considered the data collected during the first 72 hours of administration of S-1: the Japanese data set included patients from phase I and phase II trials, with some patients receiving multiple doses of S-1 under sparse sampling schedule. Overall, about 500 concentrations collected in 89 patients were included in the validation data set for each compound (actual numbers are different for each compound because of BQL). The results are shown in figure 5, where QQ-plots of the pseudo-residuals are plotted for the four compounds: as for figure 4, departures from the line x=y indicate departures from the expected distribution. The graphs show that there is a clear lack of fit for FT, and the residuals also indicate departure from the normal distribution for CDHP and 5-FU. On the other hand, the model seems adequate for oteracil.
Using a Kolmogorov-Smirnov test, the lack of fit was significant for FT, CDHP, 5-FU, with p-values of 4×10⁻⁸, 10−19, 6×10⁻⁹ respectively, which means that the Western parameters do no pre-dict well the Japanese data. With a p-value of 0.0006 versus an empirical threshold of 0.0001 however, the model for oteracil developed in the Western analysis was found to be valid in the Japanese sample.
Prediction intervals: To confirm that the populations were similar with respect to oteracil, we derived the prediction intervals for the Japanese data set using simulations based on the results of the Western analysis. The results are shown in figure 6 for the four compounds, with a plot of the pre-diction intervals overlayed on the Japanese data. For oteracil, the coverage probability is 91.2%, very
close to the 89.3% found in the Western patients, which suggests good predictability of the Western parameters applied to the Japanese population. For the other compounds, the coverage probability was slightly lower when compared to the corresponding values found in the Western population: for CDHP, FT and 5-FU, the empirical coverage in the Japanese patients was respectively 81.5, 76.3 and 80.7% versus 89.8, 92.2 and 87.3% in the Western patients. For CDHP, the outlying observations from the Japanese data set were distributed both over and under the interval, indicating increased scat-ter rather than a shift in the pharmacokinetic profile. For FT, the outlying observations were mostly above the interval, indicating that higher concentrations tend to be observed in Japanese patients when compared to Western patients.
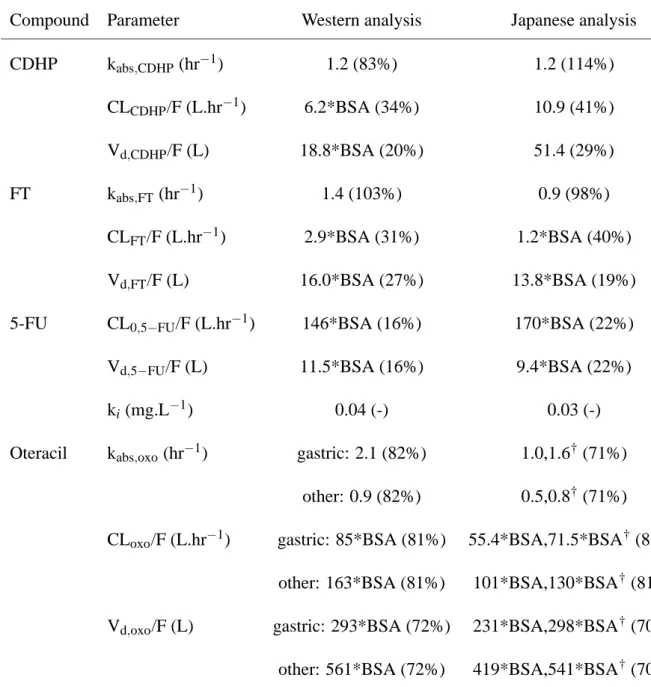
Parameter comparison: Goodness-of-fit tests detect overall lack of fit of the model, but as a global criterion it gives no indication about the origin of the differences. Also, because the pharmacokinetics of 5-FU are influenced by that of its parent drug FT and of its inhibitor CDHP, we should be cautious about the interpretation of differences in 5-FU. To understand where the populations differ, we then compared the parameters estimated in each of the Western and Japanese analyses. Table V displays the corresponding population parameter estimates. We used the relationship CL=kel Vd to derive an approximation of the distribution of clearance (CL) for CDHP, FT and oteracil. Because of the exponential error model used to model the interindividual variability, the random effect on CL is the sum of the random effects on keland Vd, which makes the computation of the variability on CL very simple. The population estimate for CL is equal to the product of the population estimates for these two parameters.
For CDHP, the Japanese analysis did not find any relationship of CL and Vd with BSA, but the estimate of CL for a patient with BSA=1.9m2 (average in the Western sample) was 11.8, very close to the 10.9 estimated in the Japanese population. The absorption rate constants were identical in the
two populations, and the variabilities were also similar. On the other hand, a lower estimate of the volume of distribution was found in Western patients when compared to Japanese patients (35.7 L versus 51.4 L), therefore higher concentrations of CDHP can be expected in Western patients.
For FT and 5-FU, the absorption rate constant is slightly lower in Japanese patients but there is high variability in both populations. More importantly the clearance for FT is halved, meaning the transformation of FT into 5-FU is slower than in Western patients. The population estimate of the conversion rate constant of FT to 5-FU was estimated to be 0.08 hr−1 in the Japanese population, versus 0.18 hr−1 in the Western population, so the observed difference in clearance is probably not entirely due to differences in bioavailability between the two populations. For 5-FU however, the differences are small, indicating that the distribution, elimination and inhibition of elimination are similar in the two populations.
For oteracil, different covariate models were selected in the two popoulations. Namely, in the Japanese population age was dichotomised in two classes (over 65 and under 65 years of age) and was found to have a significant influence on the absorption rate constant and on the volume of distribution. However, as shown in table V, the range of parameters was not so different in the two populations, consistent with the results from the model validation approach.
Using the population parameters estimated in each population, we then estimated the daily AUC for the four compounds. Doses of 25 to 45 mg/m2were given once or twice a day. As a result, because the distributions of actual dose per body are different due to different body size, another informative comparison is obtained by dividing the AUC by the dose for each patient. Table VI displays the median and minimum-maximum range of the estimates, for the four compounds in each population. The distribution of BSA, daily dose per body and dose per BSA in the two populations is also shown: Japanese patients had significantly lower BSA than Western patients, and as a result their daily dose was significantly lower, although they had similar ranges for the dose per BSA. This table shows that
although the exposure to FT was higher in Japanese patients given the same dose, there was only a small difference in the AUC for 5-FU in the two populations. In fact, dividing by dose showed that the difference in exposure was due to different doses (resulting from larger body size in the Western patients), because the difference between the two populations is no longer significant for AUC/dose. The exposure to CDHP was nearly identical in the two populations. For oteracil, the table shows the results for the two types of cancer patients separately because there were slightly more gastric cancer patients in the Japanese sample (21 out of 99, 21%, versus 8 out of 60 in the Western sample, 13%). There was a slightly higher exposure to oteracil in Japanese patients compared to Western patients, in both types of cancer patients, but a further subgroup analysis showed that this was in fact due to a larger proportion of elderly patients in the Japanese population (47 out of 99, 48%, versus 9 out of 60 in the Western sample, 15%). When we compared the oteracil AUC between the patients younger than 65 in the two populations, no significant difference was found between the exposures.
D
ISCUSSION
In this study, we performed a population PK analysis of S-1 in Western patients, and compared the pharmacokinetics with those found in Japanese patients [9].
The first issue was the joint modelling of the prodrug FT (tegafur) and its metabolite 5-FU after oral administration of S-1. We found that the best description was provided by a two-compartment model for FT and a one-compartment model for 5-FU, with the elimination rate of the latter being a function of CDHP concentration. In this model the nonlinearity is therefore a result of the reversible inhibition of DPD by CDHP. Indeed, although the elimination of 5-FU administered intravenously has repeatedly exhibited nonlinear kinetics [2, 16, 17], as a result of saturable metabolism in the liver [18], the nonlinearity usually disappears when administering a prodrug of 5-FU [3], as is the case for S-1. This is due to the fast elimination of 5-FU when compared to the conversion of FT to 5-FU. Because different models were used to describe 5-FU pharmacokinetics, there is no consensus on the value of the elimination rate constant of 5-FU: half-lives of 7 to 22 minutes have been reported, corresponding an elimination rate constant of 2.7 to 6 hr−1 [19], however in some studies using nonlinear kinetics, the asymptotic values for low concentrations of 5-FU are as high as 11 hr−1 [16]. The value of 12.7 hr−1(t
1/2=3 min) is therefore in keeping with previous results.
We estimated the inhibition constant kito be around 0.04 mg.L−1, very close to the in vitro value of 0.05 mg.L−1 [20]. The estimates of both k
i and kel,0 however fluctuated somewhat during model building. That fact and the high nonlinearity of this model indicates that standard errors of estimation estimated by NONMEM and reported in this study are likely to be underestimated. Also the predicted values of CDHP rely on estimated parameters and the uncertainty of these parameters was not taken into account. Reliable estimates of kel,0could be obtained by including an initial administration of FT without CDHP in the protocol on the day before the administration of S-1. A lower dose of FT could
be given without hindering the estimation of kel,0, but the samples should be taken early to account for the faster disappearance of 5-FU in the absence of the biomodulator and avoid BQL measurements. Note that we could not identify interindividual variability in kel,0, the value of the elimination constant in the absence of CDHP, which is unsurprising given the difficulty of estimating this parameter. We could estimate a limited (20% CV) variability associated with ki, however it appeared to be due to a slight difference in sensitivity related to sex, and when we included sex as a covariate we could eliminate the random effect. Some studies found a sex-related difference in the activity of the DPD enzyme [21], with a higher activity in females. A model where kel,0 instead of ki depends on sex converged to nearly the same objective function, showing the correlation between the estimates of these two parameters. Unsurpringly given the highly nonlinear model, we could not in this study identify interindividual variability associated with kel,0, despite the known interindividual variability in DPD activity. Despite the caveats concerning the sensitivity of the model estimates however, the values we found in this analysis are consistent with previous findings, and model validation showed a good fit for all the compounds except for FT, where the model tended to underpredict concentrations at late times, but of limited bearing on the predictions of the main compounds of interest. Simulating the exposure, we found results in good accordance with the exposure observed in patients during these studies.
The values for kishould be compared with a median value of 0.16 mg.L−1for the CDHP concen-trations measured in this study. According to the population prediction, CDHP would be expected to remain above kifor a long time after administration, considerably increasing the half-life of 5-FU. As a result, we found that the AUC of 5-FU in the presence of CDHP increased dramatically, a simulation using the mean population parameters showing a 4-fold increase in AUC when compared to a situ-ation without CDHP. In the present study, we performed a separate analysis for CDHP and used the individual Bayesian estimates of the CDHP parameters for the joint analysis of FT and 5-FU
tial fitting). Because the pharmacokinetics of CDHP are independent of the pharmacokinetics of the other two compounds, and CDHP acts through an inhibition model, there is little information about the pharmacokinetics of CDHP to be deduced from the pharmacokinetics of the other two compounds FT and 5-FU, and the present sequential fitting approach makes sense.
The modelling of oteracil showed that gastric cancer patients had much faster absorption rates than non gastric cancer patients, but lower volumes of distribution. As a result, higher concentrations of oteracil were predicted for these patients, and this was confirmed by the data. Although we are not sure of the significance of this finding, because of the small number of patients, the difference in the estimated absorption rate constants (2.1 for gastric patients versus 0.9 for the others) warrants further exploration. For CDHP and FT, we did not find similar differences. The fact that we also found an effect on the volumes of distribution may point at different bioavailabilities in the gastric cancer patients. Oxonic acid is unstable in acidic conditions, which is the reason why it is recommended to take oxonic acid within one hour after a meal, and stomach acidity may be different in gastric cancer patients.
The second purpose of the analysis was to compare Japanese and Western patients. The structural models describing the pharmacokinetics of the four compounds were identical in the two populations, but different covariates were selected in the second stage model. One of the difficulties in comparing two populations is that the distribution of covariates can be very different. Here, the body surface area entered the model as a multiplicative factor for the volume of distribution, and its distribution was very different in the two populations: as an example, the median of the BSA in the Western patients was equal to the highest value measured in the Japanese patients. The estimates of the volumes of distribution relative to BSA in the two populations were close for all compounds except CDHP, showing similar influence of this covariate. For CDHP, the higher volume of distribution observed in
Japanese may be related to different distribution of fatty tissues. CDHP being a hydrophilic compound does not distribute into fatty tissues, thus a subject with a higher percentage of fatty tissues will have an apparent volume of distribution per unit body mass smaller than a subject with a lower percentage of fat. Given an average BSA of 1.9 m2 in the Western subjects and of 1.46 m2 in the Japanese subjects, the average volume of distribution was found to be 35.7 L in Western patients and 51.4 L in Japanese patients. On the other hand, prediction intervals show that the pharmacokinetics of CDHP are not fundamentally different in Japanese and Western patients.
For FT on the other hand, the clearance in Western patients was found to be faster than in Japanese patients. As a result, a clear shift was found in the pharmacokinetic profile of FT, with concentrations higher in the Japanese patients. FT is metabolised by CYP2A6 [22], but the frequency of genetic mutation reducing CYP2A6 activity has a frequency of only 3% in Japanese. Recent findings suggests that mutations in the CYP2A6 gene may also cause reduced metabolism in Japanese populations, but we have yet no idea of the penetrance of such genes in Western and Asian populations. The reason for the large difference in the clearance of FT is therefore not explainable. Because of the dependency between the concentrations of FT, CDHP and 5-FU, the difference in the kinetics of FT between the two populations does not however translate to 5-FU, and we found very similar exposures of 5-FU (as measured by AUC divided by dose) in the two populations. This was also confirmed by plotting the prediction intervals overlayed to the observed data, using the parameters from the Western analysis to predict the Japanese data 6. As for CDHP, for 5-FU the variability was somewhat larger, but the prediction intervals remained centered on roughly the same profile. Although there were more observations lying out of the prediction intervals for 5-FU compared with the prediction intervals in the Western patients, these were spread evenly above and below the interval, indicating increased variability rather than different kinetics. In that sense, it is likely that we will see more extreme behaviour in the Japanese patients than in the Western patients, however the average behaviour for
5-FU will be the same. Supporting this is the fact that the exposures, as measured by AUC or Cmax were close in the two populations of this study, when estimated using the individual Bayes estimates. For oteracil, we found similar kinetics in both populations using prediction intervals, and model validation using pseudo-residuals did not show any difference between the two samples, therefore the estimates from the analysis in Western patients may be used to predict the kinetics of oteracil in Japanese patients. Despite this, when we estimated the AUC in the two populations, oteracil AUC seemed higher in the Japanese patients. In the Japanese analysis, age was found to be a significant covariate, with elderly patients (over 65 years of age) having lower clearance and volume of distri-bution, and therefore higher AUC. When we compared the AUC between the patients younger than 65 in the two populations, no significant difference was found between the exposures. In the Western analysis, age was not a significant covariate, but only 9 patients (15%) were older than 65, so maybe an effect of age was not detectable in this study.
We have performed independent population pharmacokinetic analyses for Western and Japanese populations. This provides a tool to deal with the situation often encountered in practice, where a new study is performed in a different country or at different stages in the drug development process, and the pharmacokinetics are compared to previously established results. If the data is available together, a joint population analysis pooling the two data sets and including race as a covariate would be more straightforward. The present nonlinear model however would require a very long computational time if both data sets were combined, because the INTERACTION option was used in conjunction with the FOCE method. Instead of performing a pooled analysis therefore, we have used the Japanese parameter estimates to compare the results obtained in the two populations.
The present population pharmacokinetic analysis will be applied in a further work to study the relationship between exposure and toxicity. 5-FU metabolites are responsible for gastrointestinal and
haematological toxicity. In addition, post-marketing surveys in Japan have shown an association be-tween severe toxicity and high concentrations of CDHP, probably because of long-lasting inhibition of DPD. On the other hand, in vitro studies demonstrated a protective effect of oteracil on gastroin-testinal toxicity [4], which needs to be assessed in patients.
A
CKNOWLEDGMENTS
During this work, Dr Emmanuelle Comets was supported by the fellowship program of the Japanese Society for the Promotion of Science. The authors would like to thank Pr France Mentré for her help in implementing and checking the pseudo-residual approach for model validation.
R
EFERENCES
[1] Meta-analysis group in cancer. Efficacy of intravenous continuous infusion of fluorouracil com-pared with bolus administration in advanced colorectal cancer. J. Clin. Oncol. 16:301–8 (1998).
[2] E. Bressolle, J. Joulia, F. Pinguet, M. Ychou, C. Astre, J. Dufour, and R. Gomeni. Circadian rhythm of 5-fluorouracil population pharmacokinetics in patients with metastatic colorectal can-cer. Cancer Chemother. Pharmacol. 44:295–302 (1999).
[3] E. Lamont and R. Schilsky. The oral fluoropyrimidines in cancer chemotherapy. Clin. Cancer
Res. 5:2289–96 (1999).
[4] K. Yoshisue, K. Hironaga, S. Yamaguchi, A. Yamamoto, S. Nagayama, and Y. Kawaguchi. Reduction of 5-fluorouracil (5-FU) gastrointestinal (GI) toxicity resulting from the protection of thymidylate synthase (TS) in GI tissue by repeated simultaneous administration of potassium oxonate (Oxo) in rats. Cancer Chemother. Pharmacol. 46:51–6 (2000).
[5] T. Shirasaka, Y. Shimamoto, and M. Fukushima. Inhibition by oxonic acid of gastrointestinal toxicity of 5-fluorouracil without loss of its antitumor activity in rats. Cancer Res. 53:4004–9 (1993).
[6] K. Hirataka, N. Horikoshi, K. Aiba, M. Okazaki, R. Denno, K. Sasaki, Y. Nakano, H. Ishizuka, Y. Yamada, S. Uno, T. Taguchi, and T. Shirasaka. Pharmacokinetic study of S-1, a novel oral fluorouracil antitumor drug. Clin. Cancer Res. 5:2000–5 (1999).
[7] C. van Groeningen, G. Peters, J. Schornagel, H. Gall, P. Noordhuis, M. de Vries, S. Turner, M. Swart, H. Pinedo, A. Hanauske, and G. Giaccone. Phase I clinical and pharmacokinetic study of oral S-1 in patients with advanced solid tumors. J. Clin. Oncol. 18:2772–9 (2000).
[8] E. Matsushima, K. Yoshida, R. Kitamura, and K. Yoshida. Determination of S-1 (combined drug of tegafur, 5-chloro-2,4-dihydroxypyridine and potassium oxonate) and 5-fluorouracil in hu-man plasma and urine using high-perforhu-mance liquid chromatography and gas chromatography-negative ion chemical ionization mass spectrometry. J. Chromatogr. B Biomed. Sci. Appl.
691:95–104 (1997).
[9] K. Ikeda, K. Yoshida, S. Nagayama, Y. Sugimoto, T. Taguchi, Y. Kawaguchi, and Y. Tanigawara. Population pharmacokinetics of 5-FU converted from tegafur under the influence of gimeracil and oteracil (TS-1). Annual Meeting of the American Association of Cancer Research, New
Orleans, March (2001).
[10] L. Sheiner and S. Beal. NONMEM Version 5.1. University of California, NONMEM Project Group, San Francisco (1998).
[11] R. Ihaka and R. Gentleman. R: A Language for Data Analysis and Graphics. J. Comput. Graph.
Stat. 5:299–314 (1996).
[12] S. Beal. Ways to fit a pharmacokinetic model with some data below the quantification limit. J.
Pharmacokin. Pharmacodyn. 28:481–504 (2001).
[13] F. Mesnil, F. Mentré, C. Dubruc, J. Thénot, and A. Mallet. Population pharmacokinetics analysis of mizolastine and validation from sparse data on patients using the nonparametric maximum likelihood method. J. Pharmacokinet. Biopharm. 26:133–61 (1998).
[14] S. Vozeh, P. Maitre, and D. Stanski. Evaluation of population (NONMEM) pharmacokinetic parameter estimates. J. Pharmacokinet. Biopharm. 18:161–73 (1990).
[15] F. Mentré and S. Escolano. Validation methods in population pharmacokinetics: a new approach based on predictive distributions with an evaluation by simulations. Meeting of the Population
Approach Group in Europe, Basel (2001).
[16] C. Terret, E. Erdociain, R. Guimbaud, M. Boisdron-Celle, H. McLeod, R. Féty-Deporte, T. La-font, E. Gamelin, R. Bugat, P. Canal, and E. Chatelut. Dose and time dependencies of 5-fluorouracil pharmacokinetics. Clin. Pharmacol. Ther. 68:270–9 (2000).
[17] J. Wagner, J. Gyves, P. Stetson, S. Walker-Andrews, I. Wollner, and M. Cochran. Steady-state nonlinear pharmacokinetics of 5-fluorouracil during hepatic arterial and intravenous infusions in cancer patients. Cancer Res. 46:1499–506 (1986).
[18] R. Diasio and B. Harris. Clinical pharmacokinetics of 5-fluorouracil. Clin. Pharmacokinet.
16:215–37 (1989).
[19] C. Coustère, F. Mentré, J. Sommadossi, R. Diasio, and J. Steimer. A mathematical model of the kinetics of 5-fluorouracil and its metabolites in cancer patients. Cancer Chemother. Pharmacol.
28:123–9 (1991).
[20] K. Tatsumi, M. Fukushima, T. Shirasaka, and S. Fujii. Inhibitory effect of pyrimidine, barbituric acid and pyridine derivatives of 5-fluorouracil degradation in rat liver extracts. Jpn. J. Cancer
Res. (Gann) 78:748–55 (1987).
[21] Z. Lu, R. Zhang, and R. Diasio. Population characteristics of hepatic DPD activity, a key metabolic enzyme in 5-FU chemotherapy. Clin. Pharmacol. Ther. 58:512–22 (1995).
[22] K. Ikeda, K. Yoshisue, E. Matsushima, S. Nagayama, K. Kobayashi, C. Tyson, L. Chiba, and Y. Kawaguchi. Bioactivation of tegafur to 5-fluorouracil is catalyzed by cytochrome P-450 2A6
T
ABLES
Categorical data
Sex Women: 25 Men: 35
Race Caucasian: 57 Black:2 Indian:1
Type of cancer Colorectal: 24 Gastric: 8 Breast: 5
Lung: 4 Other: 19
Continuous data Mean Standard deviation Range (min–max)
Age (yr) 55.5 9.3 35.0–71.0
Weight (kg) 77.0 18 54.6–161.9
Body surface area (m2) 1.9 0.2 1.6–2.6
Actual dose per body (mg) 67.4 11.2 45–100
Table I : Demographic data in the 60 Western cancer patients.
Parameter Population mean (% SE) Interindividual variability shown as CV(%) (% SE) k1 2,CDHP(hr−1) 0.19 (15%) NE k2 1,CDHP(hr−1) 0.31 (7%) NE kabs,CDHP(hr−1) 1.16 (14%) 83 (26%) kel,CDHP(hr−1) 0.33 (7%) 28 (28%) Vd,CDHP(L) 18.8*BSA (7%) 20 (58%) Tlag,CDHP(hr) 0.41 (3%) 13 (31%) Residual variability σCDHP (%) 32 (11%) NE
NE: not estimated
Table II : Population mean and interindividual variability (along with the standard error of estimation
in brackets) of the pharmacokinetic parameters estimated in the analysis of CDHP data. The residual error was modelled as a combined proportional and additive error model, with variance: var(εi, j) = (BQLCDHP/2)2+σ2
CDHPC2.
Parameter Population mean (% SE) Interindividual variability shown as CV(%) (% SE) k0 1(hr−1) 1.4 (25%) 103 (39%) k1 2(hr−1) 0.08 (139%) NE k2 1(hr−1) 0.72 (88%) NE k1 3(hr−1) 0.18 (13%) 26 (38%) kel,0 (hr−1) 12.7 (19%) NE Vd,FT (L) 16.0*BSA (10%) 27 (44%) Vd,5−FU (L) 11.5*BSA (17%) 16 (38%) ki(µg.mL−1) women: 0.037 (16%) NE men: 0.042 (17%) NE Residual variability σFT(µg.mL−1) 0.25 (17%) NE σ5−FU (CV%) 41% (7%) NE
NE: not estimated
Table III : Population mean and interindividual variability (along with the standard error of
es-timation in brackets) of the pharmacokinetic parameters estimated in the joint analysis of FT/5-FU. The residual error was modelled as an additive model for FT with constant variance σ2FT, while the model for 5-FU was a combined proportional and additive error model with variance:
var(εi, j) = (BQL5−FU/2)2+σ25−FUC2.
Parameter Population mean (% SE) Interindividual variability shown as CV(%) (% SE) k1 2,oxo(hr−1) 0.05 (57%) NE k2 1,oxo(hr−1) 0.13 (47%) NE kabs,oxo(hr−1) 2.13 (gastric) (40%) 82 (28%) 0.92 (other) (13%) 82 (28%) kel,oxo(hr−1) 0.29 (10%) 37 (46%)
Vd,oxo(L) 293*BSA (gastric) (19%) 72 (27%)
561*BSA (other) (14%) 72 (27%)
Tlag,oxo(hr) 0.38 (4%) NE
Residual variability
σoxo (%) 40 (7%) NE
NE: not estimated
Table IV : Population mean and interindividual variability (along with the standard error of estimation
in brackets) of the pharmacokinetic parameters estimated in the analysis of oteracil data. The residual error was modelled as a combined proportional and additive error model, with variance: var(εi, j) = (BQLoxo/2)2+σ2oxoC2.
Compound Parameter Western analysis Japanese analysis CDHP kabs,CDHP(hr−1) 1.2 (83%) 1.2 (114%) CLCDHP/F (L.hr−1) 6.2*BSA (34%) 10.9 (41%) Vd,CDHP/F (L) 18.8*BSA (20%) 51.4 (29%) FT kabs,FT (hr−1) 1.4 (103%) 0.9 (98%) CLFT/F (L.hr−1) 2.9*BSA (31%) 1.2*BSA (40%) Vd,FT/F (L) 16.0*BSA (27%) 13.8*BSA (19%)
5-FU CL0,5−FU/F (L.hr−1) 146*BSA (16%) 170*BSA (22%)
Vd,5−FU/F (L) 11.5*BSA (16%) 9.4*BSA (22%)
ki(mg.L−1) 0.04 (-) 0.03 (-)
Oteracil kabs,oxo(hr−1) gastric: 2.1 (82%) 1.0,1.6†(71%) other: 0.9 (82%) 0.5,0.8†(71%)
CLoxo/F (L.hr−1) gastric: 85*BSA (81%) 55.4*BSA,71.5*BSA†(81%) other: 163*BSA (81%) 101*BSA,130*BSA†(81%) Vd,oxo/F (L) gastric: 293*BSA (72%) 231*BSA,298*BSA†(70%) other: 561*BSA (72%) 419*BSA,541*BSA†(70%) † the two values given for the parameters of oteracil in Japanese patients correspond to two groups
with ages respectively over 65 and under 65.
Table V : Comparison of pharmacokinetic parameters between the Western and the Japanese
anal-yses. The population estimates are reported along with the estimated interindividual variability ex-pressed as CV in brackets, when it was estimated in the analysis. The parameter estimates for the Japanese analysis were reported in [9].
Exposure AUC (mg.L−1.hr) AUC/dose (mL−1.hr) Western patients Japanese patients Western patients Japanese patients
CDHP 3.0 (1.2–8.9) 2.7 (0.7–8.8) 75 (34–250) 87 (38–200)
FT 22.1 (9.8–38.8) 44.9 (8.6–173) 161 (76–298) 424 (235–863)
5-FU 2.0 (0.6–6.6) 1.6 (0.2–5.6) 15 (5–55) 15 (6–95)
Oteracil, gastric 0.8 (0.2–1.8) 1.0 (0.1–3.3) 5 (2-13) 11 (3-27)
non-gastric 0.4 (0.05–2.2) 0.5 (0.1–4.3) 3 (0.5–19) 5 (1–30)
Dose and BSA Western patients Japanese patients
BSA (m2) 1.9 (1.6–2.6) 1.5 (1.1–1.9)
Actual daily dose (mg)
134.5 (90–200) 111.1 (25–200)
Daily dose/BSA (mg/m2)
70.5 (47–92) 76.4 (17–154)
Table VI : Exposure to the four compounds, estimated in the two populations. Left: AUC (median
and min–max range); right: AUC divided by dose (median and min–max range); for 5-FU, the AUC was divided by the dose of FT, and one Japanese patient with a very high predicted AUC was excluded from the data set. The last lines show the BSA and doses in the two populations.
F
IGURES
Depot FT−central FT−peripheral 5−FU k =kabs Depot CDHP central CDHP peripheral k k k k k a,CDHP el,CDHP k k met =k k =kel 12 2 1 CDHP PK model 01 13 12,CDHP 21,CDHP 34 Figure 10 5 10 15 20 25 0.0 0.1 0.2 0.3 0.4 0.5 0.6 CDHP Time (hr) Observed concentrations (mg/L) 0 5 10 15 20 25 0.0 0.5 1.0 1.5 2.0 2.5 FT Time (hr) Observed concentrations (mg/L) 0 5 10 15 20 25 0.00 0.10 0.20 0.30 5−FU Time (hr) Observed concentrations (mg/L) 0 5 10 15 20 25 0.00 0.05 0.10 0.15 0.20 0.25 Oteracil Time (hr) Observed concentrations (mg/L) Figure 2
0.001 0.005 0.020 0.100 0.500 0.001 0.005 0.020 0.100 0.500 CDHP Observed concentrations (mg/L) Predicted concentrations (mg/L) 0.02 0.05 0.20 0.50 2.00 0.02 0.05 0.20 0.50 2.00 FT Observed concentrations (mg/L) Predicted concentrations (mg/L)
5e−04 2e−03 1e−02 5e−02 2e−01
5e−04 2e−03 1e−02 5e−02 2e−01 5−FU Observed concentrations (mg/L) Predicted concentrations (mg/L)
5e−04 2e−03 1e−02 5e−02 2e−01
5e−04 2e−03 1e−02 5e−02 2e−01 Oteracil Observed concentrations (mg/L) Predicted concentrations (mg/L) Figure 3
0.0 0.2 0.4 0.6 0.8 1.0 0.0 0.2 0.4 0.6 0.8 1.0 CDHP Sample quantiles Theoretical quantiles 0.0 0.2 0.4 0.6 0.8 1.0 0.0 0.2 0.4 0.6 0.8 1.0 FT Sample quantiles Theoretical quantiles 0.0 0.2 0.4 0.6 0.8 1.0 0.0 0.2 0.4 0.6 0.8 1.0 5−FU Sample quantiles Theoretical quantiles 0.0 0.2 0.4 0.6 0.8 1.0 0.0 0.2 0.4 0.6 0.8 1.0 Oteracil Sample quantiles Theoretical quantiles
0.0 0.2 0.4 0.6 0.8 1.0 0.0 0.2 0.4 0.6 0.8 1.0 CDHP Sample quantiles Theoretical Quantiles 0.0 0.2 0.4 0.6 0.8 1.0 0.0 0.2 0.4 0.6 0.8 1.0 FT Sample quantiles Theoretical Quantiles 0.0 0.2 0.4 0.6 0.8 1.0 0.0 0.2 0.4 0.6 0.8 1.0 5−FU Sample quantiles Theoretical Quantiles 0.0 0.2 0.4 0.6 0.8 1.0 0.0 0.2 0.4 0.6 0.8 1.0 Oteracil Sample quantiles Theoretical Quantiles
0 10 20 30 40 0.0 0.4 0.8 1.2 CDHP 0 10 20 30 40 0.0 0.4 0.8 1.2 0 10 20 30 40 0.0 0.4 0.8 1.2 0 10 20 30 40 0.0 0.4 0.8 1.2 Time (hr) CDHP concentrations (mg/L) 0 10 20 30 40 0 2 4 6 8 10 FT 0 10 20 30 40 0 2 4 6 8 10 0 10 20 30 40 0 2 4 6 8 10 0 10 20 30 40 0 2 4 6 8 10 Time (hr) FT concentrations (mg/L) 0 10 20 30 40 0.0 0.5 1.0 1.5 5−FU 0 10 20 30 40 0.0 0.5 1.0 1.5 0 10 20 30 40 0.0 0.5 1.0 1.5 0 10 20 30 40 0.0 0.5 1.0 1.5 Time (hr) 5−FU concentrations (mg/L) 0 10 20 30 40 0.0 0.2 0.4 0.6 0.8 1.0 Oteracil 0 10 20 30 40 0.0 0.2 0.4 0.6 0.8 1.0 0 10 20 30 40 0.0 0.2 0.4 0.6 0.8 1.0 0 10 20 30 40 0.0 0.2 0.4 0.6 0.8 1.0 Time (hr) Oteracil concentrations (mg/L) Figure 6
List of Figures
Figure 1: Schematic representation of the joint compartmental model for the simultaneous analysis
of FT and 5-FU data in the presence of CDHP, an inhibitor of the enzymatic elimination of 5-FU by DPD.
Figure 2: Measured concentrations versus time profiles for the four compounds after oral
adminis-tration of S-1 in Western cancer patients.
Figure 3: Population predicted concentrations versus observations for the four compounds, with a
log-log scale. For each plot, the line y=x is drawn. The data for patient 209 (outlier) was omitted from the figure.
Figure 4: QQ-plot of the pseudo-residuals in the Western patients versus a uniform distribution:
quantiles from the sample distribution (pseudo-residuals simulated in the Western patients based on the Western population PK parameters) are plotted against quantiles from a random sample drawn in the theoretical distribution (for pseudo-residuals, the uniform distribution over [0,1]). Departures from the theoretical distribution can be assessed by departures from the line y=x.
Figure 5: QQ-plot of the pseudo-residuals in the Western patients versus a uniform distribution:
quantiles from the sample distribution (pseudo-residuals simulated in the Japanese patients based on the Western population PK parameters) are plotted against quantiles from a random sample drawn in the theoretical distribution (for pseudo-residuals, the uniform distribution over [0,1]). Departures from the theoretical distribution can be assessed by departures from the line y=x.
Figure 6: Simulated 95% interquantile range (dotted lines) and median prediction (solid line) of the
four compounds in Japanese patients, obtained using the parameters estimated in the analysis in the Western patients. Overlayed are the values measured in the Japanese population (◦). Top: CDHP (left) and FT (right); bottom: 5-FU (left) and oteracil (right).