HAL Id: hal-03151207
https://hal.sorbonne-universite.fr/hal-03151207
Submitted on 24 Feb 2021
HAL is a multi-disciplinary open access
archive for the deposit and dissemination of
sci-entific research documents, whether they are
pub-lished or not. The documents may come from
teaching and research institutions in France or
abroad, or from public or private research centers.
L’archive ouverte pluridisciplinaire HAL, est
destinée au dépôt et à la diffusion de documents
scientifiques de niveau recherche, publiés ou non,
émanant des établissements d’enseignement et de
recherche français ou étrangers, des laboratoires
publics ou privés.
chelator inositol hexakisphosphate and is mutated in
Pontocerebellar Hypoplasia
Ekin Ucuncu, Karthyayani Rajamani, Miranda Wilson, Daniel Medina-Cano,
Nami Altin, Pierre David, Giulia Barcia, Nathalie Lefort, Céline Banal,
Marie-Thérèse Vasilache-Dangles, et al.
To cite this version:
Ekin Ucuncu, Karthyayani Rajamani, Miranda Wilson, Daniel Medina-Cano, Nami Altin, et al..
MINPP1 prevents intracellular accumulation of the chelator inositol hexakisphosphate and is mutated
in Pontocerebellar Hypoplasia. Nature Communications, Nature Publishing Group, 2020, 11 (1),
pp.6087. �10.1038/s41467-020-19919-y�. �hal-03151207�
MINPP1 prevents intracellular accumulation of the
chelator inositol hexakisphosphate and is mutated
in Pontocerebellar Hypoplasia
Ekin Ucuncu et al.
#Inositol polyphosphates are vital metabolic and secondary messengers, involved in diverse
cellular functions. Therefore, tight regulation of inositol polyphosphate metabolism is
essential for proper cell physiology. Here, we describe an early-onset neurodegenerative
syndrome caused by loss-of-function mutations in the multiple inositol-polyphosphate
phosphatase 1 gene (
MINPP1). Patients are found to have a distinct type of Pontocerebellar
Hypoplasia with typical basal ganglia involvement on neuroimaging. We
find that
patient-derived and genome edited
MINPP1
−/−induced stem cells exhibit an inef
ficient neuronal
differentiation combined with an increased cell death. MINPP1 de
ficiency results in an
intracellular imbalance of the inositol polyphosphate metabolism. This metabolic defect is
characterized by an accumulation of highly phosphorylated inositols, mostly inositol
hex-akisphosphate (IP
6), detected in HEK293 cells,
fibroblasts, iPSCs and differentiating neurons
lacking MINPP1. In mutant cells, higher IP
6level is expected to be associated with an
increased chelation of intracellular cations, such as iron or calcium, resulting in decreased
levels of available ions. These data suggest the involvement of IP
6-mediated chelation on
Pontocerebellar Hypoplasia disease pathology and thereby highlight the critical role of
MINPP1 in the regulation of human brain development and homeostasis.
https://doi.org/10.1038/s41467-020-19919-y
OPEN
#A list of authors and their affiliations appears at the end of the paper.
123456789
I
nositol polyphosphate (IPs) comprise an ubiquitous family of
small molecule messengers controlling every aspect of cell
phy-siology
1. The best characterized is the calcium release factor
inositol trisphosphate (I(1,4,5)P
3or simply IP
3), a classical example of
a second messenger
2, generated after receptor activation by the action
of phospholipase C on the lipid phosphoinositide PIP
2. Each of the
six hydroxyl groups of the inositol ring can be phosphorylated, and
the combination of these phosphorylations generates multiple
deri-vatives
3. Among them, inositol hexakisphosphate (IP
6
, or phytic acid)
is the most abundant in nature. In plants, IP
6accumulates in seeds,
within storage vacuoles, where it could represent 1–2% of their dry
weight
4. Plant seed IP
6
is used as the main source of phosphate and
mineral nutrients (e.g., Ca
2+, K
+, Fe
2+) during germination. In
mammalian cells, IP
6is the most abundant inositol-polyphosphate
species, reaching cellular concentrations of ~15–100 μM
5. IP
6
is
synthesized from inositol monophosphate (IP) or from IP
3by the
action of several inositol phosphate kinases: IPMK
(inositol-poly-phosphate multikinase, also known as IPK2), IP
3-3K (inositol
-1,4,5-trisphophate 3-kinase), ITPK1 (inositol tetrakisphosphate 1-kinase),
and IPPK (inositol-pentakisphosphate 2-kinase, also known as IPK1)
1,6. Subsequently, the fully phosphorylated ring of IP
6
can be further
phosphorylated to generate the more polar inositol pyrophosphates
such as IP
77. While IP
6anabolism is well studied, its catabolism has
been less characterized. Mammalian cells dephosphorylate IP
6through the action of the MINPP1 (multiple inositol-polyphosphate
phosphatase 1) enzyme
8that is able to degrade IP
6
to IP
39. The
analysis of mouse knockouts for the inositol kinases responsible for
IP
6synthesis have highlighted an important role for this pathway in
controlling central nervous system development, since knockout of
Itpk1 or Ipmk is embryonically lethal due to improper neural tube
development
10,11. In mammals, IP
6has been directly associated with
a pleiotropy of functions, including ion channel regulation, control of
mRNA export, DNA repair, and membrane dynamics
1.
Further-more, IP
6is considered as a natural antioxidant since its
iron-chelating property enables it to inhibit iron-catalyzed radical
for-mation
12. Although not yet thoroughly studied, some of the
phy-siological roles of IP
6could be related to its high affinity for
polyvalent cations
13,14.
To investigate the role of IP
6in mammalian physiology, many
studies use IP
6exogenously added to cell lines in culture, often
observing antiproliferative properties
15. These studies give little
attention to the chelating property of IP
6: cations-IP
6precipita-tion depletes the medium of essential ions such as calcium or
iron. In addition, the physiological relevance of extracellular IP
6in mammals is not established. Extracellular pools of IP
6have
only been demonstrated in a cestode intestinal parasite
16, and
several studies suggest that dietary IP
6cannot be absorbed as such
through the digestive system and is absent from body
fluids
17,18.
Instead, de novo synthesis of IP
6occurs in all mammalian cells,
including in the brain with high levels in regions such as the
brainstem and striatum
17,19. The existence of several cellular
pools of IP
6has been suggested
6,19,20. However, the dynamic
regulation of the endogenous intracellular pools of IP
6is not fully
understood, since its high cellular concentration precludes the
determination of IP
6pool-specific fluctuations. Therefore, the
exact function(s) of IP
6in cell homeostasis and mammalian
development remain an area of intense investigation.
Several human diseases have been genetically associated with
alterations in phosphoinositide (the lipid derivatives of inositol)
metabolism
21. However, so far, no Mendelian disorder has been
shown to be caused by an imbalance in the cytosolic
inositol-polyphosphate pathway, with the exception of two variants in a
gene involved in the conversion of the pyrophosphates forms of
inositol, associated with hearing or vision impairment
22,23.
Pontocerebellar hypoplasia (PCH) is a group of early-onset
neurodegenerative disorders that includes at least 13 subtypes,
based on neuropathological, clinical, and MRI criteria
24,25. PCH
is usually associated with a combination of degeneration and lack
of development of the pons and the cerebellum, suggesting a
prenatal onset. The genetic basis is not known for all of the cases,
and preliminary data from different PCH cohorts suggest that
many subtypes remain to be identified. Based on the known
molecular causes, PCH often results from a defect in apparently
ubiquitous cellular processes such as RNA metabolism regulation
and especially tRNA synthesis (i.e., mutations in EXOSC3,
TSEN54, TSEN2, TSEN34, CLP1, and RARS2). Multiple
addi-tional conditions show neurological symptoms and imaging
comparable to typical PCH syndromes and are caused by defects
in diverse pathways involved in mitochondrial, glycosylation or
purine nucleotide metabolisms. This observation further supports
the disruption of ubiquitous pathways as the unexplained basis of
these neurological conditions
25.
In this study, we demonstrate that loss-of-function (LOF)
mutations of the MINPP1 gene cause a specific PCH syndrome.
We also show that the absence of MINPP1 leads to an abnormal
accumulation of intracellular IP
6. Using patient-derived cells, we
observe that this increase in IP
6is associated with impairments in
neuronal differentiation and survival. In addition, we
find a
deregulation of cytosolic cation (e.g., Ca
2+, Fe
3+) homeostasis
when IP
6accumulates inside the cells. These observations suggest
that the regulation of IP
6by MINPP1 is critical to preserve
neuronal cation homeostasis.
Results
Loss-of-function mutations of the
MINPP1 gene are associated
with a distinct subtype of Pontocerebellar hypoplasia. To
identify additional etiological diagnoses of patients with PCH, we
explored a group of 15 probands previously screened negative
with a custom gene panel approach
26. Whole-exome sequencing
(WES) was then performed through trio sequencing (i.e., both
parents and the proband). Among the candidate genes that were
identified, the MINPP1 gene was recurrent and the most obvious
candidate (Table
1
and Supplementary Note). The MINPP1 gene
has not been previously associated with any Mendelian disorders.
To assess how frequently MINPP1 mutations could be involved in
PCH, we explored two other cohorts of pediatric cases with
neurological disorders. The presence of MINPP1 mutations was
investigated using a custom gene panel or WES (see
“Methods”).
Three additional families with MINPP1 biallelic variants were
identified, all the affected being diagnosed with PCH.
In total, biallelic variants in MINPP1 were identified in eight
affected children from six unrelated families (Fig.
1
, Table
1
,
Supplementary Fig. 1). These variants include homozygous
early-truncating mutations in the families CerID-30 and PCH-2712,
compound heterozygous missense and frameshift variants in
family CerID-11, a homozygous missense variant in the
endoplasmic reticulum (ER) retention domain of the protein in
the family CerID-09 and homozygous missense variants in the
histidine phosphatase domain of the protein in the families
TR-PCH-01 and PCH-2456 (Fig.
1
b, d). These four missense variants
are predicted to be disease-causing using MutationTaster and
SIFT
27, and involve amino acids fully conserved across evolution
(Table
1
, Fig.
1
c). To predict the impact of the variants on protein
structure, we utilized a phytase crystal structure of D. castellii and
evaluated the consequences of the missense variants involving
amino acids included in the model (Supplementary Fig. 1b).
Tyr53Asp variant introduces a buried charge and disrupts a
hydrogen bond with the donor amino-acid Ser299. The
Phe228Leu substitution breaks a buried hydrogen bond with
Lys241, both amino-acid positions are close to the IP
6binding
site. The Arg401Gln substitution replaces a buried charged
residue with an uncharged residue and disrupts a salt bridge
formed with the amino-acid Asp318. Thus, all the missense
variants tested are predicted to cause structural damages with
potential consequences on the enzyme activity.
The eight patients presented with almost complete absence of
motor and cognitive development, progressive or congenital
microcephaly, spastic tetraplegia or dystonia, and vision
impair-ments (Table
2
). For most of the patients, the
first symptoms
included neonatal severe axial hypotonia and epilepsy that started
during the
first months or years of life. Prenatal symptoms of
microcephaly associated with increased thalami echogenicity were
detected for the individual CerID-11, while the seven other
patients presented with progressive microcephaly. For patients
from the families CerID-09 and 11, the phenotype appeared to be
rapidly progressive and the affected children died in their infancy
or middle-childhood. Strikingly, all the affected children harbor a
unique brain MRI showing a mild to severe PCH,
fluid-filled
posterior fossa, with dilated lateral ventricles. In addition, severe
atrophy at the level of the basal ganglia or thalami often
associated with typical T2 hypersignal were identified in all the
patients MRI (Table
2
, Fig.
1
a lower panel). This imaging is
distinct from other PCH syndromes and thereby defines a
subtype that we propose as PCH type 14.
MINPP1 missense PCH mutations are deleterious for protein
function. The MINPP1 enzyme is predominantly localized in the
ER lumen
28. It removes phosphate groups from
inositol-polyphosphate substrates starting at position 3
29,30, with high
affinity for IP
5and IP
631. Indeed, it has been described as the main
mammalian phytase, or enzyme involved in IP
6degradation
(Fig.
2
a). Despite its name, this gene does not have any paralog in
the human or mouse genome. In order to determine the effect of
the patient mutations on the endogenous enzyme, we obtained
skin
fibroblasts from patients of the CerID-30 family. MINPP1
protein was undetectable in patients’ cells (Fig.
2
b), supporting a
complete loss of function of MINPP1 as the cause of this PCH
subtype. The MINPP1 gene is widely expressed in the developing
and adult mouse
8,31, and rat
9, as well as in human tissues
(Sup-plementary Fig. 2a). This broad expression pattern suggests a
general role for this enzyme in regulating inositol-polyphosphate
metabolism. To investigate this role, we generated a HEK293T cell
model KO for the MINPP1 gene (MINPP1
−/−HEK293) using
genome editing (Fig.
2
c). MINPP1
−/−HEK293 cells showed a
30% decrease in their growth rate after 48 h of culture, likely
resulting from a proliferation defect, in the absence of significant
difference in the binding of the apoptosis marker Annexin-V
(Fig.
2
d, Supplementary Fig. 2b, c). This defect was partially
res-cued by transient overexpression of WT MINPP1 (p
= 0.0029;
Fig.
2
e, Supplementary Fig. 2d). Contrastingly, overexpression of
two of the MINPP1 missense variants (i.e., Y53D and E486K) did
not rescue growth, suggesting that these variants have a major
impact on the protein function. MINPP1 has two predicted
N-glycosylation sites (Fig.
1
d). In order to evaluate the glycosylation
status of the endogenous and over-expressed WT MINPP1 as well
as the Y53D and E486K missense variants, we treated the protein
extract with the PNGase enzyme
32. A shift in the molecular weight
after treatment, in all the samples, indicated that MINPP1 is
indeed glycosylated without major impact of the missense variants
(Supplementary Fig. 2e).
Patient and genome-edited
MINPP1 mutant neural
progeni-tors show an impaired neuronal differentiation with increased
apoptosis. To investigate the mechanism at the origin of the
neurological symptoms of MINPP1 patients, we derived induced
pluripotent stem cells (iPSCs) from patient CerID-30-2
Table
1
MINPP1
variants
identi
fi
ed
in
the
different
cohorts.
Family Genomic coordinates (GRCh38) Variant (transcript level) Variant (protein level) dbSNP ExAC gnomAD SIFT Polyphen MutationTaster CADD CERID-30 Chr10: g.87505138_87505139insGGGGG NM_004897.4(MINPP1): c.223_224insGGGGG p.E75Gfs*30 –– – – – – – CERID-11 Chr10:g.87505072T>G NM_004897.4(MINPP1): c.157T>G p.Y53D –– – Deleterious (0) Probably damaging (0.978) Disease causing (prob: 1) 32 Chr10:g.87505215del NM_004897.4(MINPP1): c.300del p.K101Sfs*2 –– – – – – – CERID-09 Chr10:g.87552470G>A NM_004897.4(MINPP1): c.1456G>A p.E486K –– – Deleterious (0) Probably damaging (0.94) Disease causing (prob: 1) 26.6 TR -PCH-01 Chr10:g.87552216G>A NM_004897.4(MINPP1): c.1202G>A p.R401Q rs1381093602 – 1 allele count (freq 3×1 0 − 6) Deleterious (0) Probably damaging (0.987) Disease causing (prob: 1) 33 PCH-2712 Chr10: g.87505096_87505097insGAC NM_004897.4(MINPP1): c.181_182insGAC p.L61* –– – – – – – PCH-2456 Chr10:g.87508380T>C NM_004897.4(MINPP1): c.682T>C p.F228L rs1456945513 –– Deleterious (0) Probably damaging (0.993) Disease causing (prob: 1) 25.8 CADD score ⩾ 25 indica tes that the variant is among the 0.5% most deleter ious substitutions in the protein-coding regions of the human geno me.(Supplementary Fig. 3a–e). In order to assess a contribution of the
genetic background or other factors to the phenotype, we also
generated MINPP1
−/−iPSCs in isogenic background
(Supple-mentary Fig. 3a–e). Surprisingly, a dual SMAD inhibition-based
neural induction protocol
33,34, did not allow the generation of
viable neural progenitor cells for both MINPP1 mutant lines.
Differentiation of patient-derived iPSCs systematically generated
mixed cell populations with undefined HNK1 negative cells
(Supplementary Fig. 3h). These observations suggest a critical role
for MINPP1 during neuroectodermal induction in vitro, and led
us to use a different protocol that preserved neural rosette
environment, using only noggin as a SMAD inhibitor
35(Sup-plementary Fig. 3g). In these conditions, control cells efficiently
differentiated toward TUJ1
+neurons after 14 days (Fig.
3
a). In
contrast, MINPP1 mutant lines showed a significant 53% decrease
in TUJ1
+post-mitotic cells mirrored by a significant 2.9-fold
increase in the number of PAX6
+neural progenitors (Fig.
3
a, b).
To test the presence of a neurodegenerative phenotype in our
MINPP1 mutant cells, we assessed the apoptosis level using a
TUNEL assay. We observed an increase in apoptosis at day 10 of
neuronal differentiation that became more significant at day 14
with a 1.9-fold increase in the number of TUNEL
+cells among
the MINPP1 mutant differentiating neurons, respectively (see
Fig.
3
c, d). Interestingly, we observed no significant difference in
apoptosis levels among the undifferentiated iPSCs lines (Fig.
3
d).
These results suggest that the differentiation of neural progenitors
into neurons is specifically vulnerable to this inositol phosphate
metabolism defect.
Inositol-polyphosphate metabolism is altered in HEK293 cells,
iPSCs, and differentiating neurons mutated for
MINPP1. The
localization of human MINPP1 into the ER, and the
demon-stration that its drosophila homolog (i.e., mipp1) is anchored to
the plasma membrane outside of the cell
36, prompted us to
investigate the presence of phytase activity in conditioned media
from control and MINPP1 mutant HEK293 cells. In conditioned
medium from control cells, exogenously added IP
6was
sub-stantially processed after 2 h, and completely degraded after four
hours (Supplementary Fig. 4a). Conversely, although partially
degraded, IP
6is still detectable after six hours of incubation in
MINPP1 mutant conditioned media. This result suggests that
a
d
Signal peptide
Histidine Phosphatase Superfamily domain
N-glycosylation site
ER retention signal
Control CerID-30-2 CerID-11-1 CerID-09-2
1 30 82 436 487
b
c
c.157T>G c.223_224insGGGGG 4 5 3 2 c.1456G>A c.300del 1 p.K101Sfs*2 CerID-11 CerID-30 CerID-11100
p.Y53D p.E75Gfs*30 p.E486K
CerID-09 NM_004897.5 NM_001178117.1 NM_001178118.1 c.1202G>A p.R401Q PCH-2712-2-1 c.682T>C p.F228L PCH-2456 TR-PCH-01-1 TR-PCH-01 c.181_182insGAC PCH-2712 p.L61* H. sapiens M. musculus R. norvegicus D. rerio G. gallus X. tropicalis A. thaliana A. gambiae K K K K K K K V T T T G S T T T R R R R R R R P Y Y Y Y Y Y Y Y 50 T T R S S V S S E H S S S N A E K D D D D D D D T T E E E E E E E E L L L L L L L L p.Y53 R S H p.E486 T T p.R401 RK F R RK F R E R F R R R R R R V F R K F R F K W R K T D F R p.F228 M RFF D H M RFF D H M RFF D H M RFF D H M RFF D H M RFF D H L RFY K G RFF L E C 226 399 482 K R -K -L T CerID-30-1 PCH-2456-5-2 PCH-2456-5-3
-Fig. 1 Biallelic mutations inMINPP1 cause a distinct PCH phenotype. a Midline sagittal (top), coronal (middle), and axial (bottom) brain MRIs of control and patients from families CerID-30, CerID-11, CerID-09, and TR-PCH-01, respectively. Only sagittal (top) and coronal (middle) brain MRIs were available for the patient from the family PCH-2712 and sagittal brain MRI for the patients from PCH-2456 (top and middle). Sagittal MRIs show variable degree of brainstem (arrow) and cerebellar atrophy/hypoplasia (arrowhead).b Schematic representation of theMINPP1 transcripts: NM_004897.5,
NM_001178117.1, and NM_001178118.1, respectively. Exon numbers for the longest isoform NM_004897.5 are indicated above the schematic
representation. Mutations are shown relative to their cDNA (NM_004897.5) position.c Multiple-sequence alignment of MINPP1 from different species. Variant amino-acid residues p.Y53, p.F228, p.R401, and p.E486 are evolutionarily conserved.d Linear schematic representation of MINPP1, showing the position of mutations with respect to predicted protein domains. Endoplasmic reticulum (ER).
Table
2
Clinical
information
of
the
patients
with
variants
in
MINPP1
.
Family CerID-30 CerID-30 CerID-09 Ce rID-11 TR -PCH-01 PCH-2712 PCH-2456 PCH-2456 Subje ct CerID-30-1 CerID-30-2 CerID-09-2 CerID -11-1 TR -PCH-01-1 271 2-2-1 2456 -5-2 2456 -5-3 Gender F/M F F M F M F M F Origi n (country ) Tunisia Tunisia Tunisia Franc e France Tur ke y Egyp t Egyp t Docum ented consang uinity No No Yes No Yes Yes Yes Yes Age at last follow-up 12 years 9 years 11 years 18 months 12 years 2y 10m 4.5 ye ars 1.5 ye ars Weigh t a t birth (kg ) 3.2 (M) 4.2 (+ 2 S D ) 3.2 (M) 2.4 (− 2SD ) 3.710 3.0 (M) 3.4 (M) 3 (M ) Weigh t a t last examination (kg ) 3 0 (− 1.5 SD ) 23.4 (− 0. 5 SD ) 16.9 (− 4 S D ) 10 (− 1SD ) 3 6 10.5 (− 2SD ) 10.5 (− 3SD ) 8.5 (− 3SD ) Lengt h a t birth (cm) 50 (M ) 5 1 (M) 50.5 (M ) 4 3.5 (− 3SD ) 5 0 N A 4 9 .2 (M) 47.5 (− 1SD ) HC at birt h (cm) 34 (M ) 3 5 (+ 1 S D ) 35 (M ) 30.6 (− 3SD ) 3 6 3 3 (− 1SD ) 3 4 (M) 32 (− 1SD ) HC at las t examination (cm, age) 48 cm (8 years; − 2SD ) 47 cm (4 years; − 2SD ) 47 cm (11 years; − 5SD ) 42 c m (18 m onths; − 4S D ) − 2,55 (18 months ) 41 cm (− 5SD ) 4 4 .5 (− 5SD ) 4 2 (− 3SD ) Onset Perinatal Perinatal Perinatal Pr enatal Perinatal Peri natal Peri natal Peri natal Progressive en cephalopathy No No Yes Yes No Yes Yes Yes Posture: bedridden (B ), sitting (S ), w alking (W) B B B B B B B B De velopm ent Gross motor (normal/de layed/a bsent) Absent Absent Absent Abs ent Absent Abse nt Abse nt Abse nt Fine motor (no rmal /delayed/ absen t) Absent Absent Absent Abs ent Absent Abse nt Abse nt Abse nt Lan guage (normal/de layed/a bsent) Absent Absent Absent Abs ent Absent Abse nt Abse nt Abse nt Social (normal/de layed/a bsent) Absent Absent Absent Abs ent Delayed Abse nt Abse nt Abse nt Seizur es Epilept ic se izures +++ − ++ + + Onset 7 y e ars 4 years 5 y e ars − 1 day 2 months 3 months 5 months Neurologica l Findings Axia l hypotonia +++ + + ++ + Distal hypert onia +++ + + ++ + Pyrami dal signs Spastic tetraplegia Spastic tetraplegia Spastic tetraplegia Spa stic tetraplegia Spastic tetraplegia Spast ic tetra plegia Spast ic tetraplegia Spast ic tetraplegia Extra -pyramidal sig ns +++ + − ++ + Ophthalmo logical fi nding s Nystagmus +++ + + bila teral ++ + Abn ormal ocul ar movem ent +++ + + NA ++ Optic atrophy +++ −− − + − VEP/E RG NA ERG VEP ERG /VEP NA abnormal VEP, lef t e ye abnormal VEP − Others Ptosis/ cataract Ptosis/ cataract Blindness Pt osis Cataract Ptosis, Catar act coul dn ’t follow object − Investigations Metab olic Norma l Norma l Norma l Norma l Normal Norma l Norma l Norma l EEG Abnormal Norma l Norma l Norma l Normal Abn orma l Abn orma l Abn ormal MRI Age at last inve stigation (y ears (y ); months (m); days (d)) 2y7m 8m2d 1y11m 8m 23d 4 m 6y8m 2.5 y 1.5 y Cerebellum Hypoplasia Hypoplasia Hypoplasia Hypoplas ia Hypoplasia Hypoplas ia Hypoplas ia Hypoplasia Pons Atrophy Atrophy Atrophy A trophy Hypoplasia At rophy At rophy Atrophy Cerebr al cortex atrophy Atrophy Atrophy Atrophy A trophy − At rophy atr ophy atrophy Ventricles Enlarged Enlarged Enlarged Enla rged Enlarged Enla rged en larged enlarg edTable
2
(continued)
Family CerID-30 CerID-30 CerID-09 Ce rID-11 TR -PCH-01 PCH-2712 PCH-2456 PCH-2456 Corpus callosu m −− Thin NA − thin Thin Thin Bas al Ga nglia hypoplas ia/atrophy +++ + thalamic atrophy ++ + Bas al gang lia T2 hypers ignal +++ + thalami + −− Spec troscopy No lactat e abnormality NA NA NA NA No lac tate abnormal ity NA NA Others (WM defect) WM periventricular atrophy WM periventricular atrophy NA NA NA WM pe riventricular atr ophy −− Other sym ptoms Respiratory tra ct cong estion No No Yes No Yes No Yes No Apn oea No No No No No No Yes No Imp aired swallowing Yes Yes Yes Yes Yes Yes Yes Yes Joint stiff ness Yes Yes Yes Yes NA Yes Yes No Ske letal de formitie s Scoliosis Scoliosis Scolio sis Scoliosis Scoliosis Scoliosis sco liosis No Cardiovascular fi nding s N o N o N A N A N o N o N o N o Urine scre ening Norma l Norma l N A Norma l Normal recurrent urina ry infe ction Norma l Norma l Peri pheral blood smear NA NA NA Thr omboc ytosis Normal NA NA NA Mus cle wasting Yes Yes Yes Yes Yes Yes Yes No Facia l dysmorphism Yes Yes No No Yes Mic rognathia Non-speci fi c sma ll he ad, prominent nose, low set ea r Non-speci fi c sma ll head, promi nent nose, low set ears Other NA NAMild Normochromic, normocytic anaemia
Abn orma l fat dist ribution NA BAE P: no response −− EEG electr oencephalogram, ERG electroretinography, HC head circumfe rence, M median, NA not available, VEP visua l e voked potential.
MINPP1 accounts for the main secreted phytase activity of
HEK293 cells.
To explore precisely a disruption in inositol phosphate
metabolism, and to better address the role of MINPP1 in this
metabolic pathway, we used tritium inositol (myo-[
3H]-inositol)
metabolic labeling of cultured cells, and analyzed inositol
derivatives with SAX-HPLC (strong anion-exchange
high-per-formance liquid chromatography) as previously described
37,38.
We applied this method to HEK293 cells, skin
fibroblasts, and
iPSCs before or during neuronal differentiation at day 10
(referred to as day-10 differentiating neurons) from control and
MINPP1 mutant cell lines. Exogenously added [
3H]-inositol is
imported into the cytosol and converted into phosphoinositide
lipids before processing into inositol phosphates (IPs) (Fig.
2
a).
As expected, after 3 days of [
3H]-inositol labeling, IP
6
was
detected as the most, or the second most abundant intracellular
inositol derivative in control cell lines (black hollow bars in
Fig.
4
), but was absent in the cell culture media (Fig.
4
,
Supplementary Fig. 4b). In all the cell models studied, the
disruption of MINPP1 enzyme activity had a strong impact on
a
b
β-Actin
MINPP1
Ctrl HEK293 MINPP1–/– HEK293
4 1 2 1 2 3 50 kDa 37 kDa
c
d
50 kDa 37 kDa β-Actin MINPP1 30-2 30-1 Ctrl-2 Ctrl-1e
Inositol IP3 PIP PIP2 PI IP IP2 PLC IP4 IP5 IP6 DAG IPMK IP3-3K MINPP1 inositol IPMK IPPK MINPP1 MINPP1 CerID-30 Ctrl + vector MINPP1 –/–+ vector MINPP1 –/– + MINPP1 MINPP1 –/– + E486K MINPP1 –/– +Y53D 0 20 40 60 80 100 120 MTT absorbance at 48 h (% of control) **** ** ** ** 24 48 0.0 0.5 1.0 1.5 Time (h) Absorbance (560 nm) Ctrl MINPP1–/– ** ***Fig. 2 PCH-associated mutations ofMINPP1 are deleterious for protein function. a Schematic representation of inositol phosphate cycle. myo-inositol (Inositol); phosphatidylinositol (PI); phosphatidylinositol phosphate (PIP); phosphatidylinositol 4,5-bisphosphate (PIP2); diacylglycerol (DAG);
phospholipase C (PLC); inositol phosphate (IP); inositol bisphosphate (IP2); inositol 1,4,5-trisphosphate (IP3); inositol 1,3,4,5-tetrakisphosphate (IP4); inositol pentakisphosphate (IP5); inositol hexakisphosphate (IP6); inositol-polyphosphate multikinase (IPMK); I(1,4,5)P33-Kinase (IP3-3K); inositol-pentakisphosphate 2-kinase (IPPK); multiple inositol-polyphosphate phosphatase 1 (MINPP1).b, c Western blot analysis of MINPP1 level in patient fibroblasts and HEK293 cells with β-Actin shown as loading control. Patient fibroblasts CerID-30-1 and CerID-30-2 (b) and MINPP1−/−HEK293 clones (c) show absent MINPP1. The uncropped blots are provided as a source datafile and are representative of two independent experiments. d Assessment of cell proliferation by MTT assay. For each clone, MTT absorbance was measured 3, 24, and 48 h post-seeding. Values represent the mean ± s.d. of triplicate determinations from four replicates (n = 4, two-tailed student’s t-test, **p ≤ 0.01 and ***p ≤ 0.001. At 24 h, Ctrl vs. MINPP1−/−:p = 0.0018; at 48 h Ctrl vs. MINPP1−/−:p = 0.0009). e MINPP1−/−HEK293 cells were transiently transfected with plasmids encoding empty vector, wild type, Y53D or E486K variant MINPP1. To assess the cell proliferation rate, MTT assay was performed 48 h post-nucleofection. The data are presented as mean percentage relative to control (Ctrl) ± s.d., with triplicate determinations from four replicates. The normalization was done with 3 h MTT assay data (n = 4, one-way ANOVA, Tukey’s post hoc test, **p ≤ 0.01 and ****p ≤ 0.0001. Ctrl vs. MINPP1−/−:p < 0.0001; MINPP1−/−vs.MINPP1−/−+ MINPP1: p = 0.0029; MINPP1−/−+ MINPP1 vs. MINPP1−/−+ E486K: p = 0.0014; MINPP1−/−+ MINPP1 vs. MINPP1−/−+ Y53D: p = 0.0080). For (d) and (e), source data are provided as a source datafile.
intracellular IPs profile when compared with their respective
controls. The investigation of MINPP1
−/−HEK293 cells revealed
a ~3-fold increase in IP
6level, as well as an increase in IP
5levels,
and surprisingly a severe decrease in IP and IP
2levels (Fig.
4
a).
Differences in the same direction, although to a lesser extent, were
detected in patient
fibroblasts (Fig.
4
b) suggesting
cell-type-specific differences. Indeed, in iPSCs, IP
6levels showed a
significant 1.6-fold increase in patient-derived and MINPP1 KO
iPSCs, also associated with an increase in IP
5levels (Fig.
4
c).
Finally, we studied differentiating neurons at day 10, a time point
when differences in the TUJ1/PAX6 cell populations are not
detected (Supplementary Fig. 3f). These data revealed significant
1.64-fold increases in IP
6levels in MINPP1 mutant differentiating
cells, respectively, with a trend or significant decrease in IP
2levels
(Fig.
4
d). Interestingly, the defects in IP
6and IP
2levels in
MINPP1
−/−HEK293 cells were fully rescued, considering a ~70%
transfection efficiency, by the transient overexpression of WT
MINPP1 (Supplementary Fig. 4c, d). We also performed
radiolabeling experiments on MINPP1
−/−HEK cells with Y53D
and E486K MINPP1 variants. The Y53D variant had no impact
on the IP
6and IP
2levels, indicating the clear loss of enzyme
activity (Supplementary Fig. 4c, d). However, the E486K variant
did not affect the enzyme activity in this overexpression system,
with apparently unchanged levels of IP
6and IP
2. This result is in
line with the previously demonstrated preserved enzyme activity
in the absence of the ER retention signal
39. Therefore, and given
its inability to rescue the MINPP1
−/−HEK293 cells proliferation,
this variant could impact a critical regulation of MINPP1 protein.
In all the cell models tested, including HEK293 cells, patients’
fibroblasts, and undifferentiated and differentiated iPSCs, a
PAX6 / TUJ1
a
b
PAX6 / TUJ1c
d
TUNEL / Hoechst TUNEL / Hoechst DAY 14 CerID-30-2 Ctrl-D10 Ctrl- I004MINPP1–/– CerID-30-2 Ctrl-D10 Ctrl- I004
MINPP1–/– Ctrl MINPP1 LOF 0 20 40 60 80 100 % PAX6 + cells % TUJ1 + cells *** Ctrl MINPP1 LOF 0 5 10 15 20 ** 0 10 20 30 40 50 % TUNEL + cells ** ***
iPSCs DAY 10 DAY 14 Ctrl
MINPP1 LOF
Fig. 3 MINPP1 loss causes an early neuronal differentiation defect combined with an increase in apoptosis. a Control (Ctrl-D10 (filled circle) and Ctrl-I004 (filled triangle)) and MINPP1 LOF (patient-derived (CerID-30-2 (blank circle) and MINPP1−/−(blank triangle)) iPSCs were differentiated toward neuronal lineage for 14 days. Representative images of the differentiated cells stained with early neuronal marker TUJ1 and neural progenitor marker PAX6. Hoechst was used as a nuclear stain.b Quantitative analysis of the immunofluorescence data. c Representative images of TUNEL staining during neuronal differentiation at day 14.d Quantification of the TUNEL assay during neuronal differentiation (iPSC, day 10 and day 14). All scale bars correspond to 50 μm. (For (b, c),n = 4, for (d), n = 6 for iPSCs and day 14, n = 4 for day 10. Duplicate/triplicate analysis of two independent experiments. Two-tailed student’s t-test, **p ≤ 0.01 and ***p ≤ 0.001. For (b) upper panel, Ctrl vs. MINPP1 LOF: p = 0.0001; for (b) lower panel, Ctrl vs. MINPP1 LOF: p = 0.0066; for day 10 data (d), Ctrl vs.MINPP1 LOF: p = 0.0045 and for day 14 data (d), Ctrl vs. MINPP1 LOF: p = 0.0003). The data are presented as mean percentage values ± s.d. For (b) and (d), source data are provided as a source datafile.
comparable imbalance of IPs levels were observed, where increase
in the amounts of higher inositol-polyphosphate derivatives IP
5and IP
6were associated with a decrease in lower-phosphorylated
IP
2and IP species (Fig.
4
). Differences observed between the
various cell models tested are likely to be caused by cell-type
differences and potentially also by the genetic background.
Nevertheless, these observations clearly demonstrate the critical
role played by MINPP1 in cellular inositol-polyphosphate
homeostasis, with the conversion of higher to lower IPs. The
most robust
finding was that IP
6is systematically increased in
MINPP1 mutant cells compared to controls. Altogether, these
observations exclude a major contribution of extracellular
higher-phosphorylated IPs to this metabolic defect, but highlight an
unappreciated role for MINPP1 in the regulation of the
intracellular pool of de novo synthesized IP
6, the most abundant
inositol derivative.
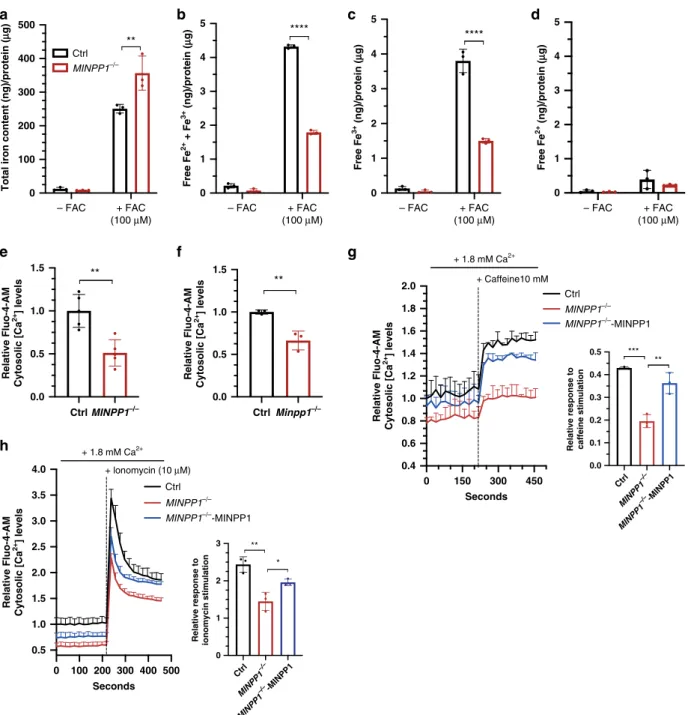
IP
6accumulation can deplete free iron in presence of high iron
condition. Considering the strong impact of MINPP1 mutations
on cellular IP
6levels, and the known chelator properties of this
molecule, we hypothesized that MINPP1 defects can have
con-sequences for intracellular cations homeostasis. An intracellular
accumulation of IP
6could theoretically lead to the accumulation
DAY 10 DIFFERENTIATING NEURONS iPSCs
a
c
b
HEK293 FIBROBLAST ([ 3H]-IP n / [ 3H]-PIP n ) % ([ 3H]-IP n / [ 3H]-PIP n ) % ([ 3H]-IP n / [ 3H]-PIP n ) % ([ 3H]-IP n / [ 3H]-PIP n ) % 0 2 4 6 8 10 Ctrl MINPP1–/– 0.0 0.5 1.0 1.5 * * IP IP2 IP3 IP4 IP5b IP5(1,3,4,5,6) IP6 IP IP2 IP3 IP4 IP5b IP5(1,3,4,5,6) IP6 IP IP2 IP3 IP4 IP5b IP5(1,3,4,5,6) IP6 IP IP2 IP3 IP4 IP5b IP5(1 ,3,4, 5,6) IP6 * 0.0 0.2 0.4 0.6 0.8 1.0 * ** ** * 0.0 0.2 0.4 0.6 0.8 1.0 * ** ** Ctrl MINPP1 LOF Ctrl MINPP1 LOF Ctrl MINPP1 LOFd
Fig. 4 MINPP1 absence leads to disruption in inositol phosphates metabolism. a–d SAX-HPLC analysis of inositol phosphate levels in MINPP1−/− HEK293 cells (a), patientfibroblasts (CerID-30-1 and CerID-30-2) (b), MINPP1 LOF (patient-derived (CerID-30-2 (blank circle) and MINPP1−/−(blank triangle)) iPSCs (c), and their day-10 differentiating neuron counterparts (d). The peaks ([3H]-IP
n) were identified based on comparison to standards. [3H]-IP
nlevels are presented as percentage of total radioactivity in the inositol-lipid fraction ([3H]-PIPn). All error bars represent standard deviation (s.d.). (For (a),n = 2 and both experiments are represented. For (b–d), n = 4, two-tailed student’s t-test, *p ≤ 0.05 and **p ≤ 0.01). IPn, inositol phosphates; PIPn, phosphatidylinositol phosphates. Source data are provided as a source datafile.
of chelated cations inside the cell, potentially reducing the pool of
free cations. At physiological pH, IP
6has a strong binding affinity
to iron
14, therefore we evaluated the ability of HEK293 cells to
store iron, in low iron (−FAC) or high iron (provided with ferric
ammonium citrate;
+FAC) conditions. Then, we used a
colori-metric ferrozine-based assay with a HCl/KmnO
4pretreatment
step that separates iron from its binding molecules to measure
total intracellular iron
40,41. After 2 days of incubation with FAC,
we observed a significant 1.5-fold increase in the total iron
con-tent in MINPP1
−/−HEK293 cells, under high iron conditions
compared to control (Fig.
5
a). Although based on
non-physiological iron conditions, this observation suggests that IP
6could play a role in the regulation of metal ion cellular storage
such as iron. To investigate a potential increase of iron chelation
affecting the free iron cellular pool, we measured the cellular free
Fe
2+/3+content using standard cell lysis and colorimetric assay.
We detected a 58% depletion in total free iron levels in MINPP1
mutant cells under high iron conditions (Fig.
5
b). Interestingly,
this depletion was mainly contributed by a decrease in Fe
3+levels
(Fig.
5
c, d). IP
6, the major IPs accumulating in mutant
HEK293 cells, is known to have higher affinity for Fe
3+versus
Fe
2+42,43. These data are consistent with a massive accumulation
of complexed iron in the absence of the MINPP1 enzyme, in the
presence of high iron, and suggest the potential involvement of
IP
6-mediated abnormal cation homeostasis as the underlying
disease mechanism.
IP
6accumulation causes cytosolic calcium depletion in mutant
HEK293 cells and primary mouse neural progenitors. To
fur-ther explore the involvement of the disruption of cellular cations
homeostasis in PCH, we evaluated the intracellular free Ca
2+levels in the absence of MINPP1, using the FLUO-4-AM
calcium-binding indicator. Strikingly, we found a significant, close to 50%
depletion of free basal Ca
2+levels in MINPP1
−/−HEK293 cells,
compared to control cell line (Fig.
5
e). To further validate the
involvement of such calcium depletion in the neurological
phe-notype, we generated a CRISPR/Cas9-mediated Minpp1
−/−mouse model (Supplementary Fig. 5a–f). Minpp1 KO mice were
fertile and are born at Mendelian ratio (Supplementary Table 1)
as described in a previously generated Minpp1 KO mouse
model
31. Brain histology did not identify major differences in
cerebellar (Supplementary Fig. 5d) or cerebral cortex architecture
(Supplementary Fig. 5e). However, we identified a mild but
sig-nificant ~10% decrease in the brain weight associated with a
reduced cortical thickness in homozygous mutant mice at P21
(Supplementary Fig. 5c, e, f). This observation suggests the
pre-sence of an evolutionarily conserved requirement for MINPP1
activity in mammalian brain development. To identify a potential
cause for this cortical phenotype, we isolated neural progenitors
at E14.5 and measured the intracellular free Ca
2+levels.
Sur-prisingly, we observed a significant 33.6% decrease in intracellular
free Ca
2+levels in the Minpp1
−/−mouse cells when compared to
wild-type neural progenitors (p
= 0.007; Fig.
5
f).
To assess the effects of IP
6accumulation on calcium signaling,
we studied the caffeine-sensitive ER calcium release in the MINPP1
−/−HEK293 cells
44. In response to 10 mM caffeine, we observed a
significant peak in the cytosolic Ca
2+levels within a minute in the
control cells. However, we could only detect a slight increase with a
sustained plateau in MINPP1
−/−HEK293 cells, indicating an
altered response potentially caused by a decrease of Ca
2+in
intracellular ER stores (Fig.
5
g). To further study the Ca
2+mobilization in MINPP1
−/−HEK293 cells, we treated the cells
with ionomycin as it is known to initially increase the cytoplasmic
calcium levels, which in turn activates calcium-induced calcium
response and eventually causes Ca
2+depletion in the ER
45. In
response to ionomycin, the control and MINPP1
−/−HEK293 cells
exhibited an initial Ca
2+peak with a sustained plateau. However,
the relative response to ionomycin stimulation was again
significantly decreased in MINPP1
−/−cells (Fig.
5
h). These calcium
signaling defects were specifically rescued in a MINPP1
−/−HEK293
line with stable expression of MINPP1 (Fig.
5
g, h). Interestingly, we
observed similar results in the absence of extracellular calcium
(Supplementary Fig. 5g, h), for both caffeine and ionomycin,
indicating that the defect is not due to the inhibition of calcium
entry. Therefore, these results clearly suggest that MINPP1 absence
affects the calcium levels in the cytosol as well as in the intracellular
stores such as the ER. Altogether, these data support the critical role
played by MINPP1 in the regulation of the intracellular IPs and
available cations with strong implications for neural cell signaling
and homeostasis.
Discussion
The direct physiological role(s) played by IP
6in mammals has
been difficult to define, due to the technical challenges associated
with its measurement, and its complex anabolism. Furthermore,
the well-described role of IP
6(phytate) and phytase activity in
plants and bacteria had led to the thinking that extracellular IP
6degradation also supplies mammalian cells with phosphate and
cations. On the contrary, we demonstrate that intracellular, not
extracellular, IP
6influences cation homeostasis. An imbalance of
IPs derivatives has not been so far directly involved in disease,
and the previously investigated Minpp1 KO mouse did not reveal
any obvious phenotype
31. Surprisingly, we discovered that the
absence of MINPP1 in humans results in a very severe early-onset
neurodegenerative disorder with specific features. Patients with
loss-of-function mutations in the MINPP1 gene present with
PCH associated with typical basal ganglia or thalami involvement
identified by MRI. The prenatal onset of the phenotype is obvious
for patient CerID-11, which supports a critical and early role for
MINPP1 in neuronal development and survival. In agreement
with this, we observed that patient-derived and genome-edited
iPSCs mutant for MINPP1 cannot be differentiated toward neural
progenitors that efficiently give rise to neurons. This defect is
associated with a significant increase in apoptosis levels among
the MINPP1 mutant cells. Interestingly, this cell survival defect
could recapitulate the neurodegenerative phenotype observed in
the patients. Although the exact mechanisms underlying the
inefficient differentiation and the apoptosis have not been
iden-tified yet, the sensitivity of human differentiating neurons to the
disruption of IPs metabolism is likely to be involved
46.
While a key role for MINPP1 in the regulation of IP
6cellular
levels has been investigated before
31, we provide the
first evidence
for its critical importance on cellular physiology and human
development. Our analysis of IPs profiles using metabolic labeling
unambiguously identified a typical imbalance resulting from
MINPP1 defect. The increase in IP
5and IP
6levels is consistent
with a previous mouse model study
31, but our more complete
assessment of the IPs metabolism imbalance also revealed
alterations in lower-phosphorylated IPs. Furthermore, the
con-sequences of this metabolic block are associated with
cell-type-dependent differences in the IPs profile, such as the IP
4depletion
in mutant iPSCs and robust IP
6accumulation in day-10
differ-entiating neurons mutated for MINPP1.
The discrepancy related to the supposed mostly cytosolic
loca-lization of IP
6and the ER localization of MINPP1 remains an
unsolved problem
19,29,31. Hypothetically, the specific subcellular
localization of MINPP1 prevents IP
6accumulation in a specific
compartment (e.g., the ER) that would have primary consequences
on local cation homeostasis. We identified that
MINPP1-mediated IP
6regulation impacts free cations availability, as
illustrated with the altered iron content of MINPP1
−/−HEK293
cells as well as the severe depletion of cytosolic calcium identified
in Minpp1
−/−mouse primary neural progenitors and HEK293
cells. Interestingly, the absence of MINPP1 also severely disrupts
signaling based on ER calcium that could potentially be the place
of the primary defect. Calcium signaling has broad functions in
neural cell physiology and brain development. Basal calcium
levels influence neuronal physiology and cell survival
47–49, and
calcium signaling plays a role in neural induction and
differ-entiation
50–53. Consequently, a disruption in calcium homeostasis
a
b
c
d
e
f
g
h
– FAC + FAC (100 μM) – FAC + FAC (100 μM) – FAC + FAC (100 μM) – FAC + FAC (100 μM) 0 100 200 300 400 500Total iron content (ng)/protein (
μ g) Ctrl MINPP1–/– Ctrl MINPP1–/– MINPP1–/–-MINPP1 Ctrl MINPP1–/– MINPP1–/–-MINPP1 ** 0.0 0.5 1.0 1.5 Relative Fluo-4-AM Cytosolic [Ca 2+ ] levels Relative Fluo-4-AM Cytosolic [Ca 2+ ] levels Relative Fluo-4-AM Cytosolic [Ca 2+ ] levels Relative Fluo-4-AM Cytosolic [Ca 2+ ] levels ** 0.0 0.5 1.0 1.5 Ctrl Minpp1–/– Ctrl MINPP1–/– ** 0 1 2 3 4 5 0 1 2 3 4 5 Free Fe 2+ + Fe 3+ (ng)/protein ( μ g) Free Fe 3+ (ng)/protein ( μ g) Free Fe 2+ (ng)/protein ( μ g) **** 0 1 2 3 4 5 **** 0.0 0.1 0.2 0.3 0.4 0.5
Relative response to caffeine stimulation
*** ** 0 150 300 450 0.4 0.6 0.8 1.0 1.2 1.4 1.6 1.8 2.0 Seconds + Caffeine10 mM + lonomycin (10 μM) + 1.8 mM Ca2+ + 1.8 mM Ca2+ 0 100 200 300 400 500 0.5 1.0 1.5 2.0 2.5 3.0 3.5 4.0 Seconds Ctrl MINPP1 –/– MINPP1 –/–-MINPP1 Ctrl MINPP1 –/– MINPP1 –/–-MINPP1 0 1 2 3
Relative response to ionomycin stimulation **
*
Fig. 5 Altered iron and calcium homeostasis in the absence of MINPP1 enzyme in HEK293 andMinpp1−/−mouse neural progenitor cells. a–d Quantification of total iron content (a), free iron (Fe2+and Fe3+) (b), Fe3+(c), and Fe2+(d) levels in extracts from control andMINPP1−/−HEK293 cells grown under low (−FAC) and high iron (+FAC, 100 µM) conditions. All values are normalized to the total protein concentration and represent the mean ± s.d (n = 3, two-way ANOVA Sidak test, **p ≤ 0.01 and ****p ≤ 0.0001. For (a), Ctrl vs. MINPP1−/−:p = 0.0023; for (b), Ctrl vs. MINPP1−/−:p ≤ 0.0001, and for (c), Ctrl vs.MINPP1−/−:p ≤ 0.0001). e, f Relative Fluo-4-AM cytosolic Ca2+levels in control andMINPP1−/−HEK293 cells (e), wild-type (WT) andMinpp1−/−E14 mouse neural progenitors (f). g, h Relative Fluo-4-AM cytosolic Ca2+levels in control,MINPP1−/−and MINPP1-overexpression stable line inMINPP1−/−HEK293 cells (MINPP1−/−-MINPP1) loaded either with 10 mM caffeine (g) or 10µM ionomycin (h). The dotted line indicates the addition of either caffeine (g) or ionomycin (h). Relative response after caffeine or ionomycin stimulation (peak) is represented graphically (inset). For all of the calcium assay experiments, the data are normalized to cell number with MTT colorimetric assay and presented as mean values relative to control baselinefluorescence intensity control ± s.d. ((e) n = 5; (f) N = 3 mice, (g, h) n = 3, two-tailed student’s t-test (e, f) and one-way ANOVA, Tukey’s post hoc test (g, h), *p ≤ 0.05, **p ≤ 0.01, ***p ≤ 0.001). For (e), Ctrl vs. MINPP1−/−:p = 0.0021; for (f), Ctrl vs. Minpp1−/−:p = 0.007; for (g), Ctrl vs. MINPP1 −/−:p = 0.0002; MINPP1−/−vs.MINPP1−/−-MINPP1:p = 0.0015; for h Ctrl vs. MINPP1−/−:p = 0.0018; MINPP1−/−vs.MINPP1−/−-MINPP1:p = 0.0402. For all panels, source data are provided as a source datafile.
could be involved in PCH disease pathogenesis. A link between
MINPP1 and calcium regulation has been suggested previously
but it was through the synthesis of I(1,4,5)P
354. Hypothetically,
coupling the limitation of IP
6-mediated chelation of calcium with
the promotion of IP
3synthesis could be an efficient way for
MINPP1
to
regulate
calcium
signaling
dynamics
and
homeostasis.
A mild or absent structural brain defect was also observed in
other PCH mouse models. AMPD2 null mutations cause PCH9
but the Ampd2 single KO mouse is not associated with any
obvious histological brain defect
55. CLP1 is involved in tRNA
processing and mutated in PCH10, however, the Clp1 mutant
mouse showed only a mild decrease in the brain weight and
volume, a phenotype overlooked before the identification of
patients with a brain phenotype
56. Differences in the phenotype
of human and mouse with MINPP1 loss-of-function mutations
could be related to an increased sensitivity of the human brain
development to metabolic defects, although the impact of the
genetic background cannot be excluded at this point.
Disrupted cation homeostasis, including metal accumulation, is
central to multiple degenerative disorders
57such as
neurodegen-eration with brain iron accumulation
58,59, Parkinson’s disease
(manganese accumulation)
60,61, and Wilson’s disease (copper
accumulation)
62,63. Basal ganglia dysfunction is usually suspected
in PCH
25, however, the severe defects identified in MINPP1
patient MRIs suggest major neurodegeneration at the level of these
subcortical nuclei, a feature not typically associated with other
PCH subtypes. These structures are well known to be primarily
affected by metal ions accumulation and further investigation will
be needed to determine how cation chelation could contribute to
the disease pathogenesis. Nevertheless, our results reveal an
unappreciated basic role for highly phosphorylated IPs in cellular
homeostasis which is critical during neurodevelopment.
Methods
Patients recruitment and investigation. The patients from families CerID-09, CerID-11, and CerID-30 included in this project were referred to the Departments of Pediatric Neurology, Genetics, Metabolism or Ophthalmology of the Necker Enfants Malades Hospital. Family TR-PCH-01 was recruited by the French Reference Centre for Cerebellar Malformations and Congenital Diseases at Trousseau Hospital. Patients from families PCH-2456 and PCH-2712 were referred for neurological or genetic assessment at the National Research Center in Cairo and Hacettepe University Medical Faculty Department of Pediatric Neurology in Turkey. Written informed consents have been obtained both from the participants and the legal representatives of the children. Details regarding sequencing,filtering, and prioritization protocols for each family are outlined in Supplementary Note. Protein multiple-sequence alignment. The following protein sequences are aligned through COBALT:Multiple Alignment tool: NP_004888.2 (H. Sapiens MINPP1), NP_034929.1 (M. musculus Minpp1), NP_062136.1 (R. norvegicus Minpp1), NP_957394.1 (D. Reiro minpp1b), NP_989975.1 (G. gallus MINPP1), XP_002935472.2 (X. tropicalis minpp1), XP_313302.4 (A. gambiae AGAP003555-PA), NP_563856.1 (A. thaliana histidine acid phosphatase family protein), NP_813655 (B. thetaiotaomicron BtMinpp).
Maintenance and culture of human-induced pluripotent stem cells (iPSCs), fibroblasts, and HEK293 cells. All human cell culture and storage protocols were performed with approval from French Research Ministry (DC 2015-2595, 09/05/ 2016) and all participants provided written consent. iPSC lines Ctrl-D10 and CerID-30-2 were generated by Duke iPSC Share Resource Facility, using RNA-based reprogramming method. CerID-30-2 and Ctrl-D10 were derived from unrelated individuals. Ctrl-D10 iPSC line was derived from BJfibroblasts of a non-disease affected male new born (ATCC cell line, CRL-2522). The control iPSC line (IMAGINi004, referred to as Ctrl-I004 in this study and described athttps:// hpscreg.eu/cell-line/IMAGINi004-A) was generated by Imagine Institute iPSC Platform, using non-integrating Sendai virus approach (CytoTune-2.0). The ability to make iPSC clones during reprogramming (i.e., reprogramming efficiency) was assessed for the CtrI-I004 line, from which the KO is also derived. This showed a standard ~0.3% efficacy to generate clones on vitronectin. The cloning efficiency attained during the generation of MINPP1−/−iPSC lines is ~0.05% following nucleofection and sorting. All iPSC lines were assessed for embryonic pluripotency markers OCT4, SOX2, SSEA-4, and TRA-1-81 (Supplementary Figs. 3a, b and 6a,
b). The absence of obvious chromosomal abnormalities was verified by CGH array 60 K (data not shown). The differentiation into mesoderm and endoderm lineage following embryoid body formation was assessed64. In addition, no obvious
dif-ferences in proliferation and apoptosis were observed among all the iPSC lines. iPSCs were maintained in vitronectin-coated (10μg/ml; 07180, STEMCELL) 3.5-cm dishes (353001, Falcon) in complete mTeSR-1 medium (STEMCELL, 85850) supplemented with 1% Penicillin-Streptomycin (PS) (15140122, Gibco) in a humidified incubator (5% CO2, 37 °C). The media were replaced daily and iPSCs were mechanically passaged with ROCK inhibitor Y-27632 (10μM; 72304, STEMCELL) every 7–8 days, with a 1:3 split ratio.
Human primaryfibroblasts and HEK293T (HEK293) cells were cultured in Dulbecco’s modified Eagle medium (DMEM) (11965092, Gibco) supplemented with 10% Fetal Bovine Serum (FBS) (16000044, Gibco) and 1% PS in a humidified incubator (5% CO2, 37 °C).
Generation of genome-editedMINPP1−/−HEK293 and iPSCs. MINPP1−/− HEK293 and iPSC lines were generated via a CRISPR-Cas9 genome editing strategy, as previously described32. Briefly, sgRNAs targeting the first exon of
MINPP1 transcript variant 1 (NM_004897.5) were designed on CRISPOR website (http://crispor.tefor.net/) and further cloned into the pSpCas9(BB)-2A-GFP plas-mid (PX458, 48138, Addgene). For the generation of MINPP1−/−HEK293 clones, transfection of pSpCas9(sgRNA)-2A-GFP into HEK293 cells was performed with Lipofectamine 2000 (11668019, Invitrogen), as per manufacturer’s instructions (2.5 µg of DNA per well of a 6-well plate). Two days post transfection, single GFP+ HEK293 cells were sorted into 96-well plates by Fluorescence-activated cell sorting (FACS) (BD FACSAria II SORP, BD Biosciences). Indel mutations of clones were detected by Sanger sequencing, and target editing efficiency was assessed by TIDE analysis (https://tide-calculator.nki.nl/; data not shown).
For the generation of MINPP1−/−iPSCs clones, transfection of pSpCas9 (sgRNA)-2A-GFP into iPSC line (Ctrl-I004) was performed using Amaxa 4D-Nucleofector X-Unit (AAF-1002X, Lonza) according to manufacturer’s instructions. Briefly, iPSCs were pre-treated with Y-27632 (10 μM) for 1 h and further dissociated into single-cell suspension with Accutase (STEMCELL, 07920). 4 × 10⁵iPSCs were nucleofected per 20μl nucleocuvette strip, using P3 Primary Cell 4D X Kit S (V4XP-3032, Lonza), 1μg DNA per reaction, and the program CA-137. After nucleofection, iPSCs were seeded on vitronectin pre-coated 12-well plates and cultured in complete mTeSR-1 medium supplemented with Y-27632 (10μM). Two days post transfection, GFP+iPSCs were sorted by FACS and plated at low densities of 1–2 × 10⁴cells per 6 cm dish (Falcon, 353037) in mTeSR-1 medium supplemented with Y-27632 (10μM). After 12–16 days, a subset of individual colonies was processed for DNA extraction using Quick-DNA/RNA Miniprep Plus Kit (D7003, Zymo) and Sanger sequenced. Target editing efficiency was assessed by TIDE analysis (https://tide-calculator.nki.nl/; data not shown). After clonal selection and expansion, no unusual chromosomal abnormalities were detected by CGH array (60 K, data not shown). Validation of MINPP1−/−iPSC clones were further assessed by the absence of MINPP1 using western blot (Supplementary Fig. 3c).
Generation ofMinpp1−/−mice. Minpp1−/−mice were generated with the aid of LEAT platform of Imagine Institute by using a CRISPR/Cas9 system. In this study, animals were used in compliance with the French Animal Care and Use Committee from the Paris Descartes University (APAFIS#961-201506231137361). Guide RNAs (sgRNAs) targeting thefirst exon of the gene were designed via the CRIS-POR (http://crispor.tefor.net/). C57Bl/-J female mice (4 weeks old) were super ovulated by intraperitoneal injection of 5 IU PMSG (SYNCRO-PART® PMSG 600 UI, Ceva) followed by 5 IU hCG (Chorulon 1500 UI, Intervet) at an interval of 46–48 h and mated with C57BL/6J male mice. The next day, zygotes were collected from the oviducts and exposed to hyaluronidase (H3884, Sigma-Aldrich) to remove the cumulus cells and then placed in M2 medium (M7167, Sigma-Aldrich) into a CO2incubator (5% CO2, 37 °C). SgRNAs were hybridized with Cas9 (wild-type) protein and injected into the pronucleus of the C57Bl/6J zygotes. Surviving zygotes were placed in KSOM medium (MR-106-D, Merck-Millipore) and cultured overnight to two-cell stage and then transferred into the oviduct of B6CBAF1 pseudo-pregnant females. The generated knockouts were validated by Sanger sequencing combined with tide TIDE analysis (https://tide-calculator.nki.nl/; data not shown). All Minpp1−/−mice were backcrossed with C57BL/6J mice to remove potential off-targets. The Minpp1−/−offspring were identified by polymerase chain reaction (PCR) genotyping (Supplementary Fig. 5a, b). Brain histological char-acterization was performed with standard hematoxylin/eosin staining and analyzed with NDP.view.2.
Generation of stable HEK293 cell lines. HEK293 cells were transfected with either FLAG-HA-empty or FLAG-HA-MINPP1 plasmids by performing lipofec-tion with the Lipofectamine 3000 reagent (Invitrogen, L3000015) as per manu-facturer’s instructions (2.5 µg of DNA per well of a 6-well plate und) under serum-free media. Six hours post transfection, the media were replaced with normal HEK293 cell culture growth media (see above). Two days post transfection, the cell culture media were replaced with the media supplemented with the selection antibiotic geneticin (0.6 mg/ml, Life, 10131027) and continued to be replaced twice