Development of a Decision Support Tool for
Planning Municipal Solid Waste Management
Systems in India
by
Dhivya Ravikumar
B.E. Mechanical Engineering, College of Engineering Guindy (2010)
PGDM, Indian Institute of Management Shillong (2013)
Submitted to the Institute for Data, Systems, and Society
in partial fulfillment of the requirements for the degree of
Master of Science in Technology and Policy
at the
MASSACHUSETTS INSTITUTE OF TECHNOLOGY
June 2017
c
○ Massachusetts Institute of Technology 2017. All rights reserved.
Author . . . .
Institute for Data, Systems, and Society
May 12, 2017
Certified by . . . .
Randolph E. Kirchain
Principal Research Scientist
Materials Processing Center
Thesis Supervisor
Accepted by . . . .
Munther Daleh
William A. Coolidge Professor of EECS
Director, Institute for Data, Systems, and Society
Acting Director, Technology and Policy Program
Development of a Decision Support Tool for Planning
Municipal Solid Waste Management Systems in India
by
Dhivya Ravikumar
Submitted to the Institute for Data, Systems, and Society on May 12, 2017, in partial fulfillment of the
requirements for the degree of
Master of Science in Technology and Policy
Abstract
Waste management is a significant challenge for India. The Indian waste landscape is changing rapidly as the population grows, the composition of the waste generated evolves, the extent of waste segmentation changes and the technologies available to collect and process waste improve. Many solutions have been proposed for dealing with the mixed waste but the most appropriate solution for a particular context is difficult to quantify. Thus, decisions are often made without considering the long-term economic, environmental or social consequences.
The present work focuses on helping Indian cities improve collection, transporta-tion and treatment of waste by developing a GIS-based decision support tool that assesses the cost effectiveness and efficiency of collection strategies, treatment tech-nologies and system configurations. The tool considers the unique elements of a city including the demographics, waste composition, scale, existing infrastructure for waste collection and treatment and potential for implementing new technologies. Un-derstanding the prevailing waste management architecture of these cities is vital in designing systems which adapt to meet the needs of the growing population with changing aspirations and consumer behavior. There is a lack of bottom-up data on the composition and volumes of waste in India. Our data-driven decision-making approach combines baseline data collection through waste audits with a systems op-timization modeling approach. By using the tool to evaluate the economic, environ-mental and social impact of different technology configurations at varying scales, we are able to quantify the expected performance associated with different architectures. The decision support tool can be used to find the minimum cost waste configuration that considers both environmental GHG emissions and employment, by construct-ing trade-off graphs between competconstruct-ing goals. A compromise solution that satisfies competing goals is obtained at the turning point of the trade-off graphs.
We also test the feasibility of improving the segregation rate in Muzaffarnagar and the impact segregation policies have on the metrics of the waste system. From the waste audits, we see that Indian households have a high composition of organic waste and waste generation increases with income level. By implementing a weekly
feedback social incentive mechanism, we see that the segregation rate of organic waste by households increases to nearly twice than those households that were given no feedback. The tool shows that as the segregation rate of the city increases, the costs and GHG emissions reduce, while the employment of the waste system increases. The level of centralization of the system reduces as the level of segregation of waste increases, that is, the system moves towards smaller scale processing plants instead of large scale centralized plants.
Thesis Supervisor: Randolph E. Kirchain Title: Principal Research Scientist
Acknowledgments
This thesis would not exist without the guidance, wisdom, encouragement and sense of humor of my two amazing advisors, Randy Kirchain and Jeremy Gregory. They fundamentally changed the way I approach problems and I really appreciate the time they both made to meet with me regularly. I’d also like to thank Rob, Chintan and the Tata Center for Technology and Design for providing the funding for this project and for teaching the skills required to do field work in India. The field work would not have been possible without the support of the Mayor of Muzaffarnagar, Mr. Pankaj Aggarwal, and the many students and faculty of SRGC, particularly Dr. Kulshreshtha, Ruchi Srivastav, Prachi Srivastav and Dr. Asif. Malini Parmar and Shekar Prabhakar of the SWMRT were instrumental in conducting the segregation pilot and their enthusiasm for waste issues is truly infectious.
This thesis marks the end of a twenty year academic education and a two year love affair with MIT. MIT is a breathtaking and life-changing place and I’m very grateful that I was provided the opportunity to be here and meet some incredible people. Professors Jessika Trancik, John Sterman, Jason Jay and Bob Eccles, thank you for imparting new ideas and knowledge that changed my world view. My TPP peeps, you are a group of passionate, beautiful, funny and impatient optimists. The world is a tiny, tiny place and I can’t wait till we cross paths again. My lab mates at MSL, you were my constant source of random discussion and knowledge. Thank you for making the lab an awesome place to work. Jinane, Tanya and my Sandbox teams, it was so much fun to work and play with you.
To my friends back in India, thank you for making the effort to be in touch and dropping everything to meet me during my Tata trips. You never let me forget my past, present and future stupidities and you keep me grounded. Ranga, you are wise beyond your years and forever my favorite source of conversation. Finally, mom and dad, thank you for inculcating strong values in me and for supporting me all this while. You are and always have been my best role models.
Contents
1 Introduction 17 1.1 Problem introduction . . . 17 1.2 Thesis objectives . . . 18 1.3 Methodology . . . 20 1.4 Thesis overview . . . 202 Legal and policy framework for waste management in India 21 2.1 Policies and regulations . . . 21
2.1.1 Municipal Solid Waste Management Rules, 2000 . . . 22
2.1.2 National Urban Sanitation Policy . . . 22
2.1.3 Swachh Bharat Abhiyan . . . 23
2.1.4 Municipal Solid Waste Rules, 2016 . . . 23
2.2 Institutional framework for MSW in India . . . 24
2.2.1 Urban local bodies . . . 24
2.2.2 Private waste management companies . . . 25
2.3 Informal sector . . . 26
2.4 Summary . . . 26
3 Muzaffarnagar as a representative Indian city 29 3.1 Motivation for studying Muzaffarnagar . . . 29
3.2 Muzaffarnagar’s waste system . . . 30
3.2.1 City-specific waste policy . . . 30
3.2.3 Logistics . . . 31
3.2.4 Stakeholder analysis . . . 32
3.2.5 Key issues in Muzaffarnagar’s waste system . . . 35
3.3 Baseline of the waste system flows . . . 35
3.3.1 Approach . . . 36
3.3.2 Feasibility of the approach . . . 36
3.3.3 Methods of data collection . . . 37
3.3.4 Procedure . . . 38
3.3.5 Results . . . 40
3.3.6 Quantification of waste flows . . . 42
3.3.7 Applicability of data collection methods to other cities in India 44 4 Changing organic waste separation behavior 47 4.1 Motivations for separating organic waste . . . 47
4.1.1 Waste composition . . . 47 4.1.2 Waste technologies . . . 48 4.1.3 Waste workers . . . 48 4.1.4 Waste toxicity . . . 49 4.1.5 Waste emissions . . . 49 4.1.6 Waste policy . . . 49 4.2 Literature review . . . 50
4.3 Household behavior change pilot study . . . 52
4.3.1 Approach . . . 53 4.3.2 Procedure . . . 53 4.3.3 Feedback . . . 55 4.3.4 Results . . . 57 4.3.5 Cost-benefit analysis . . . 57 4.4 Conclusion . . . 60
5 Decision support tool development and scenario analysis 61 5.1 Literature review . . . 61
5.1.1 Decision support systems . . . 62
5.1.2 Descriptive tools . . . 63
5.1.3 Prescriptive tools . . . 64
5.1.4 DSS for waste management in India . . . 65
5.1.5 Gap analysis . . . 65
5.2 Optimization model methodology . . . 66
5.2.1 Assumptions . . . 66 5.2.2 Metrics . . . 67 5.2.3 Decision variables . . . 68 5.3 Mathematical formulation . . . 68 5.3.1 Objective function . . . 68 5.3.2 Environmental metric . . . 70 5.3.3 Social metric . . . 70
5.4 Inputs to the model . . . 70
5.4.1 Demographic data . . . 71
5.4.2 Waste quantity and composition data . . . 71
5.4.3 Distances between the waste sources and destinations . . . 71
5.4.4 Costs, greenhouse gas emissions and employment generated by the technologies . . . 71
5.4.5 Greenhouse gas emissions of the technologies . . . 74
5.4.6 Employment generated by the technologies . . . 74
5.5 Scenario analysis . . . 75
5.5.1 Map-based representation of Muzaffarnagar . . . 75
5.5.2 Waste planner metrics . . . 75
5.5.3 Segregation scenarios . . . 77
5.5.4 Trade-off curves . . . 79
5.5.5 Level of segregation scenario . . . 83
5.5.6 Future change in population scenario . . . 85
5.5.7 Future change in income level scenario . . . 88
6 Conclusions and recommendations 93
6.1 Methodological contributions . . . 93
6.2 Conclusions . . . 94
6.3 Recommendations for Muzaffarnagar . . . 95
6.4 Recommendations for future work . . . 96
List of Figures
2-1 Institutional Framework for MSW Management (Athena, 2012) Leg-end: CPP - Community Participation Partnership, MSW - Municipal Solid Waste, PPP - Public Private Partnership, SPCB - State Pollu-tion Control Board, SWM - Solid Waste Management, ULB - Urban
Local Body . . . 24
3-1 Institutional structure of the Muzaffarnagar waste system (Danek, 2015) 32 3-2 Daily per-capita generation of organic, recyclable and refuse material 40 3-3 Composition of residential municipal solid waste . . . 41
3-4 Sankey diagram representing city-wide waste quantification using sur-veys and census data . . . 44
4-1 2 bin 1 bag set (2Bin1Bag, 2017) . . . 51
4-2 Door-to-door awareness leaflet (Hindi) . . . 54
4-3 Collection bins . . . 55
4-4 Feedback sheet . . . 56
4-5 Comparison of segregation rate . . . 57
5-1 Generalized decision support model (Sprague and Watson, 1996) . . . 62
5-2 Muzaffarnagar decision support model . . . 67
5-3 Current A2Z waste infrastructure . . . 76
5-4 Minimum cost scenario - 0% segregation . . . 78
5-5 Minimum cost scenario - 100% segregation . . . 79
5-7 GHG emissions vs. labor trade-off (100% segregation) . . . 80
5-8 Cost vs. labor trade-off (100% segregation) . . . 81
5-9 Cost vs. GHG isoquants . . . 82
5-10 Cost vs. level of segregation . . . 83
5-11 Waste configuration at 50% segregation level . . . 84
5-12 Waste configuration at 60% segregation level . . . 85
5-13 Population change scenario . . . 87
5-14 Waste system configuration at 130% population level . . . 87
5-15 Waste system configuration at 140% population level . . . 88
5-16 Waste system configuration in 2027 . . . 89
List of Tables
4.1 Relevant costs . . . 58
4.2 Relevant benefits . . . 59
4.3 Expected benefits vs costs . . . 59
4.4 Net present value of benefits vs costs . . . 59
5.1 Segregation scenarios - summary metrics . . . 78
5.2 Change in waste generation with population . . . 86
5.3 Income shift scenarios - Ten year time horizon . . . 90
Abbreviations
DSS Decision Support System DtD Door to Door
GHG Greenhouse Gas
GIS Geographic Information System ISWM Integrated Solid Waste Management LCA Life Cycle Assessment
LCI Life Cycle Inventory
MILP Mixed Integer Linear Programming
MoEF Ministry of Environment, Forest and Climate Change
MSW Municipal Solid Waste
MSWM Municipal Solid Waste Management NGO Non-Governmental Organization PAYT Pay-As-You-Throw
PPP Public Private Partnership RDF Refuse Dried Fuel
RFP Request for Proposal
SRGC Shri Ram Group of Colleges
SWMRT Solid Waste Management Round Table TPD Tons Per Day
Chapter 1
Introduction
1.1
Problem introduction
Municipal solid waste management (MSWM) is a significant challenge for city au-thorities in developing countries mainly due to the increasing generation of waste, rapid urbanization, rise in community living standards and the burden posed on the municipal budget as a result of the high costs associated with its management. It is common for municipalities in developing countries to spend 20-50% of their available municipal budget on MSWM and in spite of this expenditure, 30-60% of all urban municipal solid waste (MSW) remains uncollected and often only less than 50% of the population is served (UNEP, 2009).
The Indian waste landscape is changing rapidly as the population grows, the com-position of the waste generated evolves, the extent of waste segmentation changes and the technologies available to collect and process waste improve. Municipal waste is rarely segregated at the household level. Some cities collect the mixed non-recyclable waste streams and take them to centralized dumps or incinerators, but these are becoming increasingly unpopular with Indian citizens due to the health and environ-mental risks for the extensive populations that live near these sites. Some cities have banned waste going to dumps or incinerators due to outcry from citizens living near the sites, even though there is no immediate alternative mechanism for handling the mixed waste.
Many solutions have been proposed for dealing with the mixed waste in India, such as automated segregation and then composting or energy generation with the separate waste streams, but the most appropriate solution for a particular context is difficult to quantify. Thus, decisions are often made without considering the long-term economic or environmental consequences. The end result is a lost opportunity to transform the mixed non-recyclable waste into value in the form of energy or compostable com-modities. Source segregation of waste into different streams (organic/food waste, recyclables and inorganic non-recyclable waste) creates a valuable source of input for biogas and composting technologies. However, it requires awareness and behavioral change at the household level.
1.2
Thesis objectives
This thesis focuses on helping Indian cities improve collection, transportation and treatment of waste by developing a GIS-based decision support tool. This will enable system designers to identify a waste management system architecture that considers the unique elements of a city including the demographics, waste composition, scale, existing infrastructure for waste collection and treatment, and potential for imple-menting new technologies. The tools will be generalizable enough to be applied in any city, but the emphasis will be on small to mid-sized cities. We will test the tools using the case of the city of Muzaffarnagar, in which we have numerous contacts in city government and waste management.
This thesis aims to answer the following questions to help Indian cities design a context-specific waste management system:
What capacities of processing plants, technologies and system config-uration make the most sense to deploy, considering multiple constraints and metrics such as cost, environmental impact, space constraints, social impact, etc.?
In the Indian context, generally city planners and policy makers have multiple objectives when designing a waste management system. These objectives are often
competing and there are trade-offs between multiple objectives. Scenario analysis are done to decide the optimum technology and capacity of processing plants to meet competing objectives. Some of the technologies currently being used in the Indian context include biogas and composting for organic waste and pelletization for inorganic waste.
In case of a decentralized waste system, what are the optimal locations of the processing centers within city limits?
A centralized system reduces processing cost due to economies of scale, but trans-portation costs are increased due to the long travel distances from the waste gener-ation points to the processing center or landfill, generally located at the outskirts of the city. A decentralized system minimizes transportation costs. However, capital investment and unit operation costs are higher because of the increased number of disposal sites that do not achieve economies of scale. Locating the decentralized pro-cessing centers at the optimal location in the city involves taking into account the transportation distances between the waste generation points and processing centers.
How can source segregation of household waste be increased?
Source segregating waste at the household level into three streams: organic/food waste, recyclables and inorganic non-recyclable waste, increases the quality of the waste going to the various processing technologies. Biogas and composting in India currently involves passing mixed waste through several filters to separate the organic waste, which is then used for processing into biogas and compost respectively. How-ever, separating the organic waste involves extra processing cost and the compost produced from mixed waste is of poorer quality than that produced from source seg-regated waste. We hypothesize that source segregation of waste reduces processing cost but increases operating costs due to the extra infrastructure and collection trips required for the segregated waste. Also, costs vary depending on the percentage of the city participating in segregation.
1.3
Methodology
In order to develop the tool, we will take the following steps. First, we will gather data about the current baseline performance of the existing waste management system. Then, we will build a tool to model the current and possible system architectures and evaluate the performance of the system. Next, we will test modifications to the waste system by identifying and testing strategies to improve household waste segregation. Finally, we will use the tool combined with data from the field after system modifications to identify, implement and evaluate potential solutions, policies and further modifications to the waste system.
1.4
Thesis overview
The structure of this thesis is as follows: Chapter 2 details the current institutional frameworks and stakeholders governing waste management in India. The baseline of waste flows of the current waste system is quantified using a bottom-up data col-lection approach in Chapter 3, considering Muzaffarnagar as a representative Indian city. Modifications to the current waste system are hypothesized in Chapter 4 and a behavior change mechanism to improve segregation of organic waste at the house-hold level is tested through a pilot study. Chapter 5 focuses on the development of the decision support tool and discusses the applicability of the tool in the Indian context. A literature review of the existing decision support tools is undertaken and system optimization is identified as the modeling approach to be used in development of the decision support tool. The tool is then applied to the city of Muzaffarnagar to evaluate the economic, environmental and social impact of different technology configurations at varying scales and levels of segregation. Finally, Chapter 6 recom-mends policies and technology options for Muzaffarnagar and other Indian cities and discusses limitations and possible future improvements to the decision support tool.
Chapter 2
Legal and policy framework for waste
management in India
Though there are policies governing the handling and processing of MSW in India, there is no clear implementation and monitoring of these policies. In this chapter, we will discuss the existing policies and regulations governing waste management in India, in order to understand the institutional framework within which the decision support tool should operate.
2.1
Policies and regulations
The formulation of municipal waste policy and administration is done at the national level by the Ministry of Environment, Forest and Climate Change (MoEF), the Min-istry of Urban Development and the Central Pollution Control Board. The MinMin-istry of Environment, Forest and Climate Change is empowered by Environment (Protec-tion) Act, 1986 to provide the regulatory framework for managing municipal solid waste and various other waste types in India. However, the responsibility of funding and monitoring is done at the state government and the urban local bodies (ULBs) level. According to the Indian Constitution, solid waste management is a state sub-ject and included in the 12th Schedule of the Constitution (74th Amendment) Act of 1992. State laws governing the ULBs stipulate MSWM as an obligatory function
of the municipal governments (Mani and Singh, 2016). ULBs are in charge of the actual service delivery either by itself or through public private partnerships. ULBs are classified into four major categories: municipal corporation, municipality, town area committee and notified area committee. The major policies governing waste management in India are detailed below.
2.1.1
Municipal Solid Waste Management Rules, 2000
The first set of rules governing waste management in India were the Municipal Solid Waste Management Rules, 2000. The responsibility for SWM management lies with the respective Urban Local Bodies (ULBs), consisting of municipal corporations, mu-nicipalities, nagar panchayats, etc. (collectively referred to as the ‘Authorities’). The Municipal Solid Waste (Management and Handling) Rules, 2000, issued by the MoEF, Government of India, under the Environment (Protection) Act, 1986, prescribe the manner in which the Authorities have to undertake collection, segregation, storage, transportation, processing and disposal of the municipal solid waste generated within their jurisdiction under their respective governing legislation.
Compliance with the MSW Rules requires that appropriate systems and infras-tructure facilities be put in place to undertake scientific collection, management, processing and disposal of MSW. However, the Authorities are often unable to im-plement and sustain projects to enable scientific collection, management, processing and disposal of MSW (Annepu, 2012) due to resource and expertise constraints.
2.1.2
National Urban Sanitation Policy
The policy was prepared by the Ministry of Urban Development in 2008. The objec-tive of the policy is ‘to transform urban India into community-driven, totally sani-tized, healthy and livable cities and towns’. The policy stresses upon awareness and behavior change, open defecation free cities and integrating sanitation in all the other aspects of cities (TERI, 2015).
2.1.3
Swachh Bharat Abhiyan
The Swachh Bharat Abhiyan (Mission) was launched in 2014. The main objectives of the mission include elimination of open defecation, eradication of manual scaveng-ing, modern and scientific municipal solid waste management, to effect behavioral change regarding healthy sanitation practices, capacity building for ULBs, and to create enabling conditions for private participation in capital investment and opera-tion and maintenance. One of the overall objectives is to achieve scientific solid waste management in 4041 cities/towns for 306 million people (TERI, 2015).
2.1.4
Municipal Solid Waste Rules, 2016
In 2016, the MoEF revised the Solid Waste Management Rules after sixteen years. The applicability of the new rules extended beyond municipal areas and to urban agglomerations, census towns, notified industrial townships, areas under the control of Indian Railways, airports, airbase, port and harbor, defense establishments, spe-cial economic zones, State and Central government organizations, places of pilgrims, religious and historical importance.
The Municipal Solid Waste Rules, 2016, has created a provision for making waste processing facilities mandatory in local bodies with a population of 1 million or more within two years. In the case of census towns with a population below 1 million, setting up common, or stand-alone sanitary landfills by, or for all local bodies having 0.5 million or more and for setting up common, or regional sanitary landfills by all local bodies and census towns under 0.5 million will have to be completed in three years. A sanitary landfill is a pit with a protected bottom where trash is buried in layers, compacted (pressed down to make it more solid), and covered. A sanitary landfill can reduce harm from waste that has collected, and is safer than an open dumping site.
2.2
Institutional framework for MSW in India
Figure 2-1 below depicts the institutional framework of municipal solid waste manage-ment in India. The two common methods employed by the ULBs are either handling waste management operations on their own or via a private sector player (private waste management company) through a public private partnership (PPP).
Figure 2-1: Institutional Framework for MSW Management (Athena, 2012) Legend: CPP - Community Participation Partnership, MSW - Municipal Solid Waste, PPP - Public Private Partnership, SPCB - State Pollution Control Board, SWM - Solid Waste Management, ULB - Urban Local Body
2.2.1
Urban local bodies
The responsibility for SWM management lies with the respective urban local bodies (ULBs), consisting of municipal corporations, municipalities, nagar panchayats, etc.
With the implementation of the SWM Rules, 2016, more emphasis has been placed by the Indian government in making sure that household waste is processed or
dis-posed of in a sanitary landfill. There are around 3000 urban local bodies in charge of waste management.
Limitations
Many of the urban local bodies do not have the expertise or the resources to handle SWM as stipulated in the SWM Rules, 2016. This has resulted in many of the ULBs outsourcing their waste management operations to private waste companies.
2.2.2
Private waste management companies
In India, national legislation governs the management of waste by local bodies. While the public policy is passed by the national government, it is the responsibility of the local governments to ensure compliance with the legislation. As a result of these stringency of the national legislation, many municipalities are partnering the private waste management companies via PPP. The private waste companies are hired after a competitive request for proposal (RFP) process where the companies submit blind bids for cost estimates.
There are about 20 private waste management companies in India. Some of them include: A2Z Infrastructure, Mumbai based Essel Infraprojects, Mumbai based Han-jer Biotech, Jindal group’s JITF Urban Infrastructure, Ramky Enviro Engineering Limited, Switzerland based Satarem Enterprises, UAE based Trimex, Delhi based Unity Infraprojects Limited and Mumbai based UPL Environmental Engineering Lim-ited. The market is highly fragmented with a large number of players.
Limitations
The private waste companies are paid according to the tons of waste they collect daily as per their public private partnership contracts. There is a possibility that a given company may try to manipulate the amount of waste collected to garner higher revenue. Contracts need to be negotiated in a manner that creates incentives for the private waste management companies to collect waste and process it in a
scientific manner. An additional concern is that when private companies take over waste management they displace the municipal government employees whom the city was previously paying for waste collection. This could cause social unrest as the workers protest the introduction of operations by the private waste company. The private companies should be encouraged by the municipal corporations to find ways to integrate the existing waste workers into the private waste company’s operations.
2.3
Informal sector
The formal sector in waste management in India is used to describe the activities carried by workers with wage employment of a permanent nature, either with the government or in the private waste management companies. The formal sector is governed by the various waste management rules and legislation passed by the Gov-ernment of India.
The informal sector is defined as unorganized or informal workers lacking em-ployment, work or social security. The informal sector operates outside the legal framework and is often prevalent in developing countries. Most of the recyclable waste is collected by the informal recycling sector in India before it is collected by the formal system. Some estimates indicate that the informal sector recycles 20.7% of recyclables from the formal system (Annepu, 2012). The informal sector includes wastepickers, rag pickers, kabadiwallas, itinerant waste buyers and junk-sellers. Ef-forts have been made by the state governments and non-governmental organizations (NGOs) to integrate the informal workers into the formal system, however there is no national policy governing the informal sector.
2.4
Summary
As seen from the examination of the current waste policies and the institutional frame-work of waste management in India, handling waste is largely the responsibility of the municipal government. It is becoming more common for the municipal government
to outsource its waste handling to a private waste management company through a public private partnership. There is also a large informal sector that operates outside the legal framework, separate from the private waste management company. These stakeholders need to be considered while developing the decision support tool. In the next chapter, we will discuss the various stakeholders and existing policies in Muzaf-farnagar, a representative Indian city, and then calculate the baseline of current waste flows in the city.
Chapter 3
Muzaffarnagar as a representative
Indian city
To investigate the quantitative and qualitative aspects of waste management in India, we chose the city of Muzaffarnagar, located in the state of Uttar Pradesh, in Northern India. In this chapter, we will investigate the current waste system in Muzaffarnagar by collecting waste generation data through waste audits and surveys. Using the data collected, we will construct the current baseline of waste flows. The baseline of waste flows will be used in Chapter 4 to test segregation policies and in Chapter 5 to develop the decision support tool.
3.1
Motivation for studying Muzaffarnagar
We chose Muzaffarnagar as the case study location for a number of reasons. Muzaf-farnagar is located about 125 kilometers north-east of the national capital, Delhi in the Indian state of Uttar Pradesh. It has a population of 392,768 and 68,975 house-holds as per the 2011 census, with a decadal growth rate of 18.42% (Office of the Registrar General and Census Commissioner, India, 2014). As per the 2011 census, there were 497 cities in India that represent 19% of India’s population. A city is de-fined as having a population of more than 100,000 people. 90.5% of Indian cities (350 cities) have populations between 100,000 people and one million people. 108.3 million
people live within the boundaries of these 350 cities, comprising 48% of India’s total urban population (Office of the Registrar General and Census Commissioner, India, 2014). While a number of studies have been conducted studying the waste generated from million-plus urban agglomerations in India, data on waste generation studies from these smaller cities is scarce.
Muzaffarnagar is an important industrial city with sugar, steel and paper being the major industries. More than 40% of the region’s population is engaged in agriculture (Office of the Registrar General and Census Commissioner, India, 2014). According to the World Bank, 51% of India’s population is engaged in agricultural activity, which is defined as individuals dependent on agriculture, hunting, fishing, and forestry for their livelihood (World Bank, 2010). Muzaffarnagar is an accurate representation of the labor composition of India due to the similar proportions of population engaged in agriculture.
The Tata Center and the city of Muzaffarnagar have a long relationship, as the mayor of Muzaffarnagar, Mr. Pankaj Aggarwal, has hosted projects from MIT in the past. Support extended by the local municipal government is crucial in obtaining data, conducting studies and testing policies in the city.
3.2
Muzaffarnagar’s waste system
3.2.1
City-specific waste policy
Under the national Solid Waste Management (SWM) Rules, 2016, the District Mag-istrate or the Deputy Commissioner of the concerned district shall have the overall responsibility for the enforcement of the provisions of the SWM rules within the ter-ritorial limits of their jurisdiction (Government of India, 2016). The Muzaffarnagar municipality does not have any separate waste policy governing waste collection or waste segregation for households and large waste generators.
3.2.2
Background
Until 2010, the Muzaffarnagar municipal waste workers collected waste from house-holds and dumped the waste in a large dumping ground. None of the waste was processed or treated. In 2010, the Muzaffarnagar Municipal Corporation signed a ten year contract with A2Z Infrastructure Limited, a private Indian company, to meet Muzaffarnagar’s waste needs. The contract covered collection, transportation, processing and treatment of waste as an integrated waste management system. House-holds were charged a new fee of Rs. 30 ($0.50) for door-to-door collection. As per the contract, the Muzaffarnagar municipality would pay A2Z a tipping fee per ton of waste collected.
A2Z constructed a waste processing facility at the outskirts of the city, which passes the waste through a series of filters in order to either be composted at the 120 ton capacity composting plant or made into refuse dried fuel (RDF). The remaining waste after being passed through filters and processed would be landfilled.
3.2.3
Logistics
Around 180 door-to-door A2Z waste workers collect waste from approximately 65,000 households in Muzaffarnagar. Though households were expected to separate their organic and inorganic waste at the household level, this was not strictly enforced and the waste was collected unsegregated. The waste workers collect the waste in cycle carts and then dump the collected waste in one of the 45 collection points located throughout the city. Then, A2Z dumpers (each of 7-8 ton capacity) collect the waste from the collection points and transport it to the waste processing facility. Municipal workers also participate in the waste system collection by street sweeping - they also dump the waste at the 45 collection points located throughout the city. A2Z also collects waste door-to-door from commercial establishments in the city. However, large generators such as restaurants and hotel primarily dump their waste directly at the collection points instead of utilizing the door-to-door collection service.
3.2.4
Stakeholder analysis
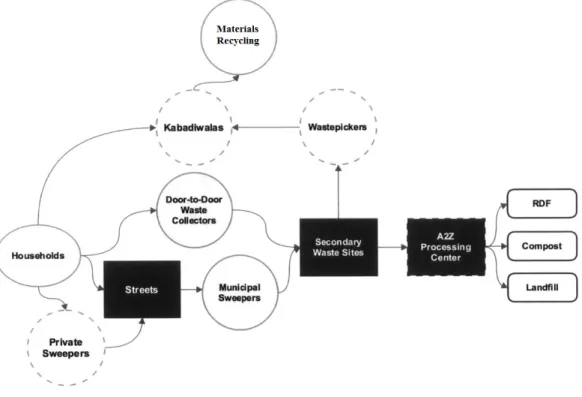
The major stakeholders in the municipal solid waste management system in Muzaf-farnagar include:
1. The Muzaffarnagar municipality, the local municipal government along with the mayor, Mr. Pankaj Aggarwal
2. A2Z Infrastructure Limited, the private waste collection organization, con-tracted by the municipality for a period of ten years (till 2021)
3. Households, who generate waste to be collected by A2Z
4. Large or bulk generators, such as hotels, malls, marriage halls, etc., which generate large amounts of municipal solid waste
5. Kabadiwalas, informal waste collectors who collect recyclables from households 6. Private sweepers, employed on an ad-hoc basis by households to sweep and clean households
The below Figure 3-1 shows how the stakeholders interact with one another:
Muzaffarnagar Municipality
Currently the municipality spends 35% of its total municipal budget on the waste management system. 30% of the budget is used to pay the municipal workers involved in street sweeping while the remaining 5% of the budget covers the municipal tipping fee payment to A2Z. The municipality is responsible for waste management and it pays A2Z, the private waste company, to collect the waste. Currently, the municipality is realizing huge financial losses in supporting the existing waste management system. The municipality could enact a policy such as a waste tax or mandatory household waste separation, to reduce its financial burden. However, if the measures are too stringent, this could have political ramifications for the mayor. The local government has a high degree of influence on the waste system since interventions to improve household waste segregation and adoption of appropriate waste to energy technologies are possible only with the cooperation of the local government.
A2Z Infrastructure Limited
A2Z Infrastructure Limited is a large Indian waste management company. As of 2014, A2Z had contracts with 24 Indian cities to develop and run their MSWM systems. A2Z is mandated by their contract to collect waste in Muzaffarnagar till 2021 and therefore has a monopoly on the control of the operations of collection, transportation and processing of waste in Muzaffarnagar. A2Z has three revenue streams: tipping fees paid by the municipal government, revenue generated from the sale of compost and revenue generated from the sale of RDF. A2Z is currently realizing a financial loss on the waste management operations in Muzaffarnagar. As per their contract, they are allowed to keep whatever profit they make from selling the waste products. However since the households do not give segregated waste, A2Z spends substantial resources separating the waste to make compost and RDF. Also, there have been disputes between A2Z and the municipality regarding payment of the tipping fees.
Households
The households pay a tipping fee to A2Z ($0.50 per month) for their waste manage-ment services. However, some of the households do not use the service and dump their waste in unmarked dumping sites. All the households need to use A2Z’s system for minimum revenue. Though the current waste management system is beneficial to the households as the cost of collection is relatively low, indiscriminate dumping could eventually lead to negative health conditions. Cooperation of households is required to make A2Z’s operations profitable and the system efficient. Currently households do not segregate their waste but measures such as mandatory segregation of waste at the household level would allow the waste system to operate more efficiently.
Large or bulk generators
Large or bulk generators are restaurants, hotels, malls, marriage halls, etc., which generate large amounts of municipal solid waste. Currently, the large generators are the major beneficiaries of a poor waste management system as they dump their waste without extra fees. Most of the bulk generators are not covered by A2Z and they typically dump their waste on the street. Bulk generators, if brought under A2Z’s coverage, will have to pay more fees and hence would oppose any restricting regulations. The waste from the bulk generators is predominately food waste, they can play a central role in city-level composting efforts if they directly give segregated food waste to A2Z.
Kabadiwalas
Kabadiwalas are the informal waste collectors who buy recyclables from households. The recyclables are directly collected from the household and A2Z does not receive a share of the profits since they are removed from the waste stream before reaching A2Z. Households are incentivized to segregate their recyclables as they are paid by the kabadiwalas for them. In turn, the kabadiwalas sell the households bought from the households to large wholesale recyclers.
Private sweepers
Private sweepers are employed on an ad-hoc basis by households to sweep and clean households. Many of the private sweepers were employed as municipal waste workers before A2Z was contracted and they opposed the introduction of A2Z in Muzaffarna-gar. The private sweepers are paid to clear waste from the households but often dump the waste on the streets, instead of dumping trash in A2Z’s 45 designated collection points.
3.2.5
Key issues in Muzaffarnagar’s waste system
There are several issues in Muzaffarnagar’s waste system, affecting the stakeholders involved. Not all households are being served by A2Z and collection is restricted to those households located near the 45 collection points. As a result, there is waste on the streets since some households and bulk generators dump waste instead of using A2Z’s services. Lack of segregation by households forces A2Z to pass the waste through a series of filters, which increases time for processing, electricity usage and costs. The waste system as a whole is financially unsustainable. The municipality spends a substantial portion of its budget on paying fees to A2Z and the municipal waste workers. Several households do not pay collection fees and bulk generators do not pay at all as they dump waste instead of using A2Z’s services. A2Z also has a limited downstream market for non-recyclable by-products such as compost and RDF. This is due to multiple reasons such as lack of education of downstream customers and also lack of consistent quality of these products. These issues, coupled with a lack of information on the waste system performance, makes improvements to the waste system a difficult challenge.
3.3
Baseline of the waste system flows
A2Z collects data on a daily basis on the amount of waste collected from the city. However, there is a lack of bottom-up data about the quantity and composition of
waste generated by the various sources of waste in the city. There is also a lack of data on the destinations of the generated waste. Data on the composition and quantity of waste generated at the municipal level is crucial in order to plan the waste system with the appropriate collection strategies, treatment technologies and system configurations. Though the new Solid Waste Management Rules 2016 stipulate that local bodies should submit annual reports to the State Population Control Board (Government of India, 2016), currently most local bodies do not collect detailed data on the waste system. In order to collect bottom-up data on Muzaffarnagar’s waste system, a variety of methods and data sources were used such as census data, waste audits and surveys.
3.3.1
Approach
In order to calculate the baseline of waste flows in Muzaffarnagar, we used primary and secondary sources of data to estimate the waste generation of the various waste sources and the destinations of waste. First, the waste sources and destinations were identified by interviewing the A2Z management. Then, the quantification and composition of waste from the various waste sources was completed by conducting sample waste audits and surveys. This data was then scaled up to the entire city using demographic data obtained from the 2011 census. The quantification of waste at the destinations of waste was completed using data from the A2Z management. Using the data obtained from the census, income data, waste audits, bulk generator surveys, household surveys and informal sector surveys, we are able to quantify the baseline of daily waste flows in Muzaffarnagar. This baseline can then be used as input for the development of the decision support tool.
3.3.2
Feasibility of the approach
Several baseline data collection and behavior change pilot implementation steps have been carried out with the help of the faculty and students of the Shri Ram Group of Colleges (SRGC), a local college which is our on-the-ground partner in this project.
This involvement with a local partner is necessary due to the limited time spent in India during field visits. The combination of field visits and study conducted by SRGC allows the implementation of system-level modifications throughout the year.
3.3.3
Methods of data collection
Census data
In order to collect information about the demographics and population of Muzaffana-gar, we used data from the 2011 census. Population per ward was obtained from the census. Data from the census was also used to enumerate the number of commercial establishments, restaurants, hotels, etc. in Muzaffarnagar.
Income data
Since the census of India does not capture the income data of households, we used the circle rate data from the municipality as a proxy to estimate the income level of households in a region. Circle rates are a measure of the property values per square kilometer in a neighborhood.
Waste audits
In order to estimate the quantity and composition of waste generated by households, waste audits were conducted in select neighborhoods.
Bulk generator surveys
In order to estimate the quantity of waste generated by bulk generators, surveys of selected bulk generators were conducted. Bulk generator audits were not conducted due to limitations on the resources and time of the SRGC team.
Household surveys
Household surveys were conducted to supplement the waste audit data, in order to quantify the number of people per household and thereby calculate the per capita
waste generation.
Informal sector surveys
Surveys were conducted with the informal sector of door-to-door kabadiwalas, ag-gregators and wholesale recyclers, in order to quantify the recyclable waste collected outside of A2Z’s operations.
3.3.4
Procedure
Household waste audits
The aim of conducting waste audits was to understand the composition and quantity of household waste streams in Muzaffarnagar and compare differences based on income level.
Six neighborhoods of 30 households each were selected. Two higher income neigh-borhoods (New Mandi and Gaushala Road), two middle income neighneigh-borhoods (Gandhi Colony and Teachers Colony) and two lower income neighborhoods (Qidwai Nagar and Kashi Ram Awas) were identified using circle rate data from the municipality and interviews with the mayor and the SRGC research team. However on further com-parison of Muzaffarnagar circle rate data with circle rate data collected from Pune (99acres, 2016), we see that there is not much distinction in income levels between the middle and higher income neighborhoods in Muzaffarnagar. Hence, we removed the higher income neighborhoods from the audit and referred to the middle income neighborhoods as upper income neighborhoods.
Waste was collected from these six neighborhoods over a period of eight weeks spanning from October to December 2015. Waste was collected once a week, usually on the same day of the week, in a large gunny bag by the A2Z collector. The waste bag was then handed over to SRGC. Once the waste was handed over to SRGC, it was taken to a sorting room at SRGC campus. With the help of two trained waste pickers, the waste was sorted into 32 categories as mentioned in the waste audit sheet (Appendix A). Once the waste was sorted, it was weighed and noted down according
to category. The waste was then averaged over the eight weeks for each category.
Bulk generator surveys
Select bulk generators from each of the generation categories including hotels, restau-rants, banquet halls, cinema halls and shopping malls, were selected as survey recip-ients. Ten representative bulk generators of varying scales were selected from each category. Surveys were conducted in order to quantify the daily customer footfall and waste generation (Appendix F). This data was then used to estimate the annual waste generation according to bulk generator category. The number of bulk generators in each category was identified from city-wide surveys as well as census data. The data was then scaled up by using the sample survey data for the entire city.
Household surveys
Household surveys (Appendix B) were conducted in the six neighborhoods where the waste audits were conducted. The surveys were conducted door-to-door to collect demographic information about the number of inhabitants per household, in order to calculate the per capita waste generation from the waste audit data.
Informal sector surveys
Surveys of the door-to-door kabadiwalas, aggregators and wholesale recyclers (Ap-pendix C) were conducted in order to identify the neighborhoods in which they op-erate as well as the composition, value and quantity of waste collected on a monthly basis. The informal sector workers to be surveyed and their locations were identi-fied based on interviews with the households as well as commercial establishments in the area. Fifteen informal sector workers were surveyed in total, five door-to-door kabadiwalas, five aggregators and five wholesale recyclers.
3.3.5
Results
Household waste audit results
As shown in Figure 3-2, we see that the majority of household waste is organic and also the waste generation increases with increase in income. The lower income per capita waste generation is 132 grams/person whereas the upper income waste generation is 201 grams/person.
Figure 3-2: Daily per-capita generation of organic, recyclable and refuse material
Using the circle rate and census data, we can classify the percentage of the pop-ulation in the lower income (41%) and higher income (59%) income groups. This data is then used to calculate the composition of waste for the entire population of Muzaffarnagar. As shown in Figure 3-3, we see that there is a high fraction of or-ganic waste; nearly two-thirds of the total waste is oror-ganic. Also plastic forms the largest recyclable fraction at 9% of the total waste, followed by paper at 6% of the total waste. Other recyclables such as glass and metal are negligible. However, this composition represents the waste collected from households by A2Z. Since households
also give their recyclable waste directly to door-to-door kabadiwalas, the portion of recyclables in the actual household waste may be underrepresented.
Figure 3-3: Composition of residential municipal solid waste
The higher organic fraction in municipal solid waste is similar to studies conducted in other Indian cities (Perlman, 2015). Studies on the composition of municipal solid waste in the USA show that 37% of the municipal solid waste is organic (U.S. EPA, 2014). Appropriate technologies should be considered to utilize the large percentage of organic waste in the Indian household waste stream.
Bulk generator survey results
The bulk generators were classified as large, medium and small based on number of daily customers. From the surveys, we estimate that large bulk generators generate 70 kg of waste per day, medium bulk generators generate 25 kg of waste per day and small bulk generators generate 10 kg of waste per day. The number of bulk generators in each category is identified from city-wide surveys as well as census data.
Household survey results
From the household surveys, the number of people per household in the upper and lower income neighborhoods was identified. In the upper income group, the average number of people per household was 5.6 whereas in the lower income group, the average number of people per household was 6.3. The average number of people per household was used in combination with the data of total waste generated from the waste audits, in order to calculate the per capita waste generation per neighborhood.
Informal sector survey results
Surveys of the door-to-door kabadiwalas, aggregators and wholesale recyclers were used to obtain information about the quantity of recyclables going to the informal sector, which were not passing through A2Z’s waste streams. From surveys, we see that in Muzaffarnagar, there are 500-600 door-to-door kabadiwalas, 150 aggregators and 50-60 wholesale recyclers. The door-to-door kabadiwalas collect 1-2 tons per month of recyclables. The aggregators collect around 10 tons per month of recyclables, whereas the wholesale recyclers collect around 25 ton/month of recyclables.
3.3.6
Quantification of waste flows
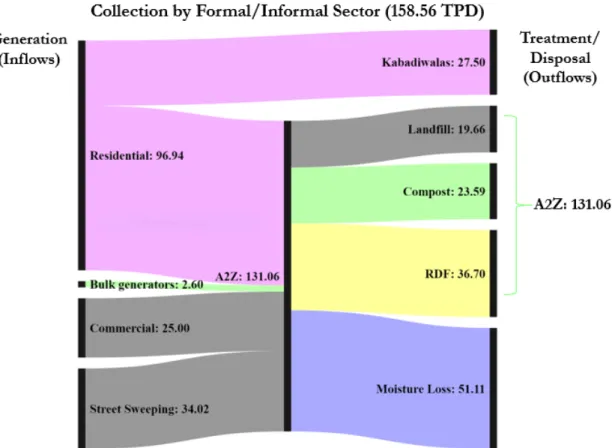
Using the data obtained from the census, income data, waste audits, bulk genera-tor surveys, household surveys and informal secgenera-tor surveys, we are able to quantify the daily waste flows in Muzaffarnagar. The sources of waste include: households (residential), commercial establishments, bulk generators, and street sweeping. The destinations of waste include the kabadiwalas and A2Z. At A2Z, the waste desti-nations are the two by-products: compost and RDF, landfill and moisture loss from composting. Muzaffarnagar’s waste flows can be represented using a Sankey diagram, which we will describe in Figure 3-4 below.
Sources of waste
1. The current 2017 population of Muzaffarnagar is calculated taking the 2011 cen-sus data and using a yearly population growth rate of 1.5% based on historical growth.
2. Using the waste audit data and income data, the waste generated by households that is collected by A2Z is calculated as 69.44 ton/day.
3. Considering the informal sector and assuming that there are 550 door-to-door kabadiwalas collecting 1.5 tons of waste monthly, the amount of waste collected by the kabadiwalas daily is 27.5 ton/day.
4. Using the data gathered from the bulk generator surveys, we estimate that the bulk generators produce 2.6 ton of waste daily.
5. There were 24,114 commercial establishments in Muzaffarnagar as per the 2011 census(Office of the Registrar General and Census Commissioner, India, 2014). Assuming that the commercial establishments grow at a rate proportional to the growth in households and assuming that each establishment generates 1 kg of waste per day, the amount of waste generated is 25 tons/day.
6. Finally, as gathered from interviews with A2Z workers, 75% of the total waste is collected by the A2Z workers whereas 25% of the total waste is collected by the municipal workers. From this estimate, we calculate that waste from street sweeping is 34.02 tons/day.
Destinations of waste
Based on data collected by A2Z on their waste processes and interviews with A2Z management, we estimate that of the total waste going to A2Z, 15% of the waste goes to the landfill, 18% is made into compost, 28% is made into RDF and 39% is lost due to moisture loss.
Muzaffarnagar’s waste flows can be represented using a Sankey diagram as shown in Figure 3-4. The height of the bars corresponds to the amount of waste. The black
Figure 3-4: Sankey diagram representing city-wide waste quantification using surveys and census data
bars represent the nodes - the nodes on the far left represent the waste generation (inflows) and the nodes on the far right represent the waste treatment or disposal (outflows). The nodes in the center represent the collection by the informal sector or A2Z (the formal sector).
3.3.7
Applicability of data collection methods to other cities
in India
In some cities such as Pune, the Municipal Corporation collects detailed annual data on the amount of waste generated by various sources and the waste processing desti-nations of the waste. However in Muzaffarnagar, we have quantified the waste flows based on data collection methods such as surveys, census and income data, which can be easily replicated in other cities in India.
Now that the current baseline of waste flows has been constructed using the data collected, we will use this data in the following chapters. The baseline of waste flows will be used in Chapter 4 to test segregation policies and in Chapter 5 to develop the decision support tool.
Chapter 4
Changing organic waste separation
behavior
In developing countries such as India, organic waste forms a large fraction of the total waste generated by households. Sources of organic waste include food scraps, yard waste, wood and process residues. Unlike recyclables, organic waste is typically not separated by households and is mixed with other types of waste when collected.
This section lists the motivations for collecting separated organic waste, along with an overview of previous studies conducted to increase organic waste separation behavior at the source by households. Using the understanding gathered from liter-ature, a pilot study was conducted to test household behavior change mechanisms. The results of this study and its applicability on a larger scale are also discussed.
4.1
Motivations for separating organic waste
4.1.1
Waste composition
The composition of waste is influenced by many factors, including the level of eco-nomic development, food habits, cultural norms, geographical location, energy sources, and climate. As a country urbanizes and populations become wealthier, consumption of inorganic materials (such as plastics, paper, and aluminum) increases, while the
relative organic fraction decreases (Hoornweg and Bhada-Tata, 2012). Generally, low and middle-income countries have a high percentage of organic matter in the urban waste stream, ranging from 40 to 85% of the total. In India, the household organic waste fraction varies from 40 to 60%, with the organic fraction roughly inversely de-pendent on the population of the city (Kumar et al., 2009). This high proportion of organic waste is ideal for being utilized by waste processing technologies to extract valuable end products.
4.1.2
Waste technologies
The available waste processing technologies used in India can be broadly divided into two categories: biological treatment and thermal treatment. Biological treatment includes aerobic composting, vermi composting and anaerobic digestion. Thermal treatment includes incineration, production of refuse dried fuel (RDF), pyrolysis and organic pelletization. In the biological treatment process, the biodegradable organic portion of waste is broken down by micro-organisms into gaseous products (carbon dioxide, methane gas, etc.) and water molecules leaving behind carbon rich byproduct called compost (CPCB, 2016). In order for biological treatment of the waste to be effective, the organic waste first needs to be separated from the mixed waste. This can be done either manually by the waste collectors or mechanically by passing the waste through a series of filters. Passing the mixed waste through filters involves additional electricity usage and costs, which is a burden at the waste processing plants due to unreliable electricity. There is a potential time and cost savings for the usage of these technologies if the waste is source separated by households.
4.1.3
Waste workers
Waste workers are an alternative to separating the organic waste mechanically. During collection from households, the waste workers can manually separate the household waste in various categories. However, this poses health and safety risks to the workers exposed to unhygienic and toxic waste.
4.1.4
Waste toxicity
In unsegregated waste, the organic waste is contaminated by other fractions of the municipal waste stream. In the case of composting, the quality of the final compost is dependent on the uncontaminated quality of the input organic waste. In order to ensure sale, the compost should be safe to use as well as meet certain quality standards. Studies on heavy metal concentrations in different municipal solid waste compost demonstrate that source separated municipal waste produces a higher quality end product compared to non-source separated municipal solid waste (World Bank, 1997).
4.1.5
Waste emissions
Unsegregated waste is sent to landfills if there is not a proper mechanism to process it. Organic waste in landfills undergoes anaerobic decomposition which produces methane, a harmful greenhouse gas. In some countries, regulators require landfill operators to control methane emissions by installing gas collection systems, however, this is largely absent in India. Globally, landfills are the third largest anthropogenic source of methane, accounting for approximately 11% of estimated global methane emissions in 2010 (U.S. EPA, 2011).
4.1.6
Waste policy
In the Solid Waste Management Rules passed by the Government of India in 2016, waste generators should segregate and store the waste generated in three separate streams namely biodegradable, non biodegradable and domestic hazardous wastes in suitable bins and handover segregated wastes to authorized waste collectors as per the direction or notification by the local authorities from time to time (Government of India, 2016).
4.2
Literature review
Several studies have investigated mechanisms and incentives to affect household waste separation behavior. Most of these studies focused on separation of recyclables, which have a market defined resale value. In England, a study was conducted to compare three behavior change based approaches, which all aimed to increase participation in the recycling collection scheme and to reduce inclusion of non-targeted materials (contamination) (Timlett and Williams, 2008). Three approaches - one doorstepping-based (door-to-door awareness), one incentives-doorstepping-based (reward vouchers) and one de-livering personalized feedback to residents, were carried out. The findings showed that personalized incentives and feedback were highly effective at reducing contami-nation. Both methods resulted in a halving of the number of households setting out contaminants on collection day. The feedback approach was considerably more cost-effective than the other two approaches. In another study based in Italy, researchers examined whether combining non-monetary and monetary incentives increases mu-nicipal solid waste recyclable sorting (Bucciol et al., 2015). They investigated door to door (DtD) collection (versus drop-off), which requires users to separate their waste at home, along with pay-as-you-throw (PAYT) pricing system, that links the cost of the user to the amount of unsorted waste produced. They found that PAYT incen-tive increases the sorted waste ratio (SWR; i.e., the ratio of sorted to total waste) by 17 % which is additive to the effect of the DtD incentive (15.7%). However, they also found that PAYT programs induce illegal dumping: users dump their waste in adjacent towns where communal bins are available in the streets. This result suggests that decisions about the policy programs would benefit from coordination between adjacent municipalities, to avoid this undesired effect.
Some of the studies included both separation of recyclables and organic waste. In China, an incentive-based source separation model was designed and tested where households were rewarded for separating organic waste, government funds were used for waste reduction, and small recycling enterprises promoted source separation. Su-permarkets signed a contract with small recycling enterprises to allow residents to
shop with the bonus obtained for sorting organic waste and recyclables (the bonus was 0.05 CNY kg-1 for organic waste and 0.1 CNY kg-1 for recyclables). After one year of operation, the waste reduction rate under the incentive-based source sep-aration model was 87.3%, whereas in the normal recycling model, where residents sold the recyclables to the rubbish collectors or small recycling stations, the waste reduction rate was 25.4% (Xu et al., 2015).
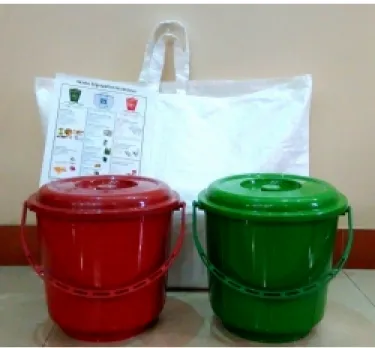
Municipalities in India have tried different schemes to encourage organic waste separation behavior. These mostly involve distributing free collection bins to house-holds, accompanied by a door-to-door awareness campaign. In some instances, the local government conducts the awareness campaign with the help of local NGOs and social workers. In Bengaluru, citizen welfare groups Kasa Mukta Bellandur and the Solid Waste Management Round Table (SWMRT), launched a campaign called ‘2 bin 1 bag’ in 2012.
Figure 4-1: 2 bin 1 bag set (2Bin1Bag, 2017)
Households were given two bins: one red and one green, and a reusable bag, as shown in Figure 4-1 above. Organic or wet waste should be handed over to collectors in the green bin, inorganic or hazardous waste in the red bin, while the reusable bags
were to be used for recyclable or dry waste. The households were asked to separate their waste according to the appropriate bin, and the garbage collector would collect the segregated waste. In 2015, the Karnataka High Court mandated the 2 bin 1 bag system for waste collection and disposal in Bengaluru. It was mandated that all categories of waste generators - residential, non-residential and government offices - should segregate wet, dry and hazardous waste at the source. The Karnataka High Court also directed the municipality to identify violators and impose penalties (Prasad, 2015).
In the energy efficiency field, Opower is a US-based customer engagement platform for utilities which employs behavioral science techniques to affect customers’ energy consumption (Rahim, 2010). The reports include targeted tips that seek to motivate customers to lower their energy consumption to the "normal" neighborhood rate. The reports also feature smiley-face emoticons for the most energy-efficient homes (Schmit, 2010).
As seen from the literature review, household behavior change was affected in three stages: mechanisms, awareness and incentives. Mechanisms include policy measures such as a city-wide policy notification and fines in case of non-compliance. Awareness methods include passive approaches such as advertising on collection vehicles, leaflets and newspaper articles and active approaches such as door-to-door campaigning and presentations in schools. The incentives used are broadly divided into financial and social incentives. Financial incentives include cash incentives or non-cash (in-kind) incentives such as waste for goods exchanges. Social incentives included recognition in community level meetings and feedback given on neighbors separation rate.
4.3
Household behavior change pilot study
Using the insights gathered from the literature review, a pilot study was designed and conducted in two neighborhoods in Muzaffarnagar, to test incentives to increase organic waste separation behavior by households. As seen from the waste audits, a high fraction of the total waste is organic waste. If this waste is separated at
the household level, there is potential for the waste to be utilized in organic waste technologies.
4.3.1
Approach
Two neighborhoods of similar income levels, Gandhi Colony and Teachers Colony, were chosen as the test neighborhoods for the pilot study. In one neighborhood (Gandhi Colony), no feedback was given to the households on their waste separa-tion quantities or separasepara-tion rate. This neighborhood is known as the doorstepping neighborhood. In the other neighborhood (Teachers Colony), feedback was given to the households on a weekly basis for a period of one month. This neighborhood is known as the feedback neighborhood. The steps in conducting the segregation pilot are described below. Finally, an analysis of the benefits and costs of implementing a city-wide segregation policy in the city of Muzaffarnagar is calculated.
4.3.2
Procedure
1. In each neighborhood, a sample of thirty adjacent households was selected. 2. In both neighborhoods, a one day door-to-door awareness campaign was
con-ducted by the mayor of Muzaffarnagar, Mr. Pankaj Aggarwal; Malini Parmar and Shekar Prabhakar, members of the Solid Waste Management Round Table (SWMRT), a Bengaluru-based NGO; local NGOs; and students and faculty of SRGC.
3. The participants distributed two bins (green and red) and one bag to the house-holds free-of-charge and explained the new waste collection system. The bins were given free-of-charge to the households through a seed grant funded by the Tata Trusts. The awareness program was conducted in both Hindi and English and leaflets were handed out along with the two bins and bag kit, as shown in Figure 4-2 below.
Figure 4-2: Door-to-door awareness leaflet (Hindi)
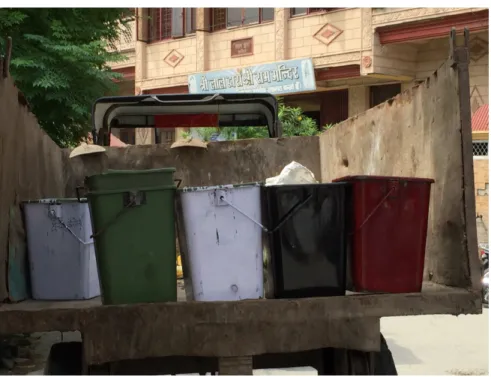
two neighborhoods and take the waste back to the A2Z plant. Four collec-tion bins were placed in the colleccollec-tion trucks (as shown in Figure 4-3) and the waste workers were trained to place the waste in the red, green, white or black bin depending on the contents of the bins (inorganic, organic, recyclable, and unsorted waste respectively).
Figure 4-3: Collection bins
5. In both neighborhoods, waste was collected from the thirty households daily. The waste worker noted if each household was separating its waste into the appropriate bins. The waste collected in each category (organic, inorganic, recyclable and unsorted) per neighborhood was weighed and noted.
4.3.3
Feedback
In the feedback neighborhood, households were given feedback on a weekly basis over the span of one month. The households were given feedback on three measures: how much waste their neighborhood generated in each category compared to the doorstepping neighborhood, how many times per week they segregated their waste and how many times per week their neighbors segregated their waste. The feedback sheet given to the households in the feedback neighborhood is shown in Figure 4-4 below.
Figure 4-4: Feedback sheet
The feedback was done at two levels: comparison with a different neighborhood (the doorstepping neighborhood) and well as comparison within the same neighbor-hood. While comparing the two neighborhoods, the waste quantities generated for the thirty households on a weekly basis in kilograms were compared. While comparing within the same neighborhood, a pie chart and smiley-faces were used to indicate the
weekly frequency of waste separation. The feedback sheet was given to the households in the feedback neighborhood weekly at the end of the collection week on Saturdays.
4.3.4
Results
The weekly household separation rate, i.e., the number of households per neighbor-hood that separated their waste all six days of the week, were noted for each of the neighborhoods and plotted across four weeks.
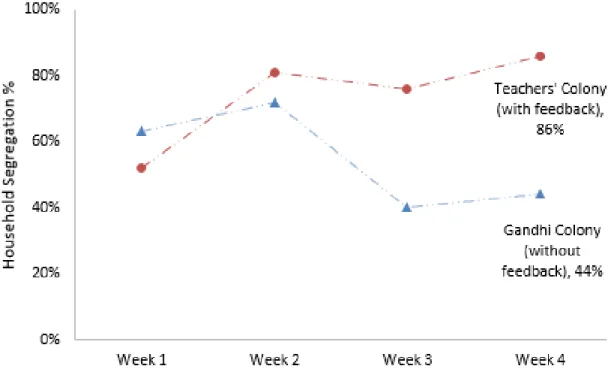
Figure 4-5: Comparison of segregation rate
From the comparison plot, we see that although both the neighborhoods started at a similar segregation rate, the feedback neighborhood had nearly twice the segregation rate than the doorstepping neighborhood, at the end of four weeks.
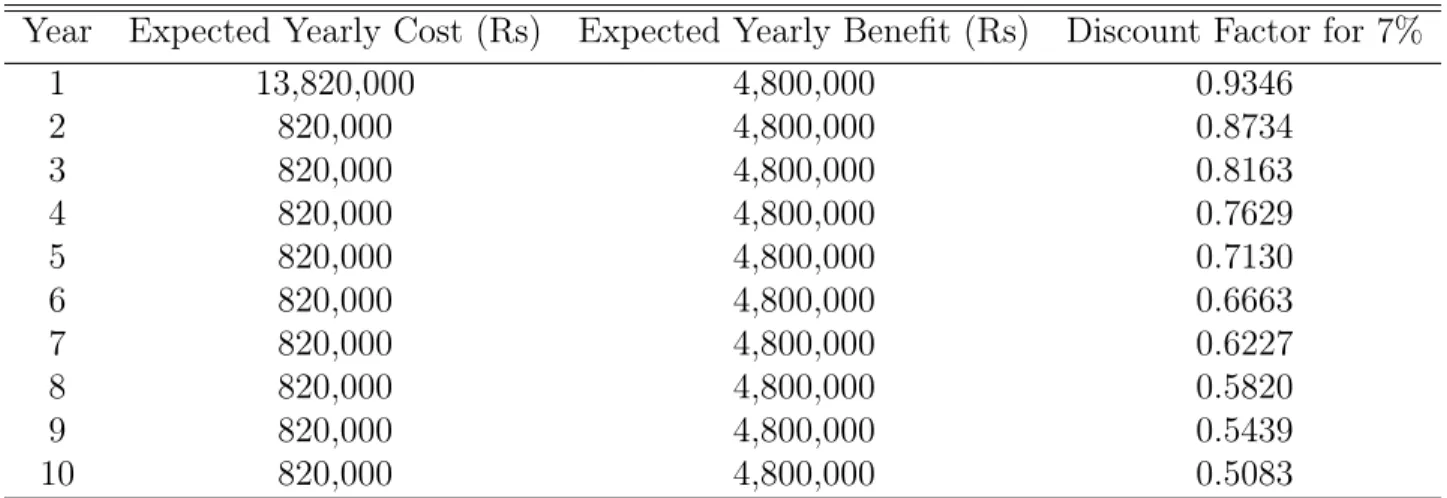
4.3.5
Cost-benefit analysis
An analysis of the benefits and costs of implementing a city-wide segregation policy in the city of Muzaffarnagar, which has a population of about 400,000 people and 65,000 households, was conducted. The cost-benefit analysis would differ depending