Development and Analysis of
Nondestructive Electrokinetic Cartilage Diagnostics by
Robin Christina Evans B.S. Mechanical Engineering
Massachusetts Institute of Technology, 1999
SUBMITTED TO THE DEPARTMENT OF MECHANICAL ENGINEERING IN PARTIAL FULFILLMENT OF THE REQUIREMENTS FOR THE DEGREE OF
MASTER OF SCIENCE AT THE
MASSACHUSETTS INSTITUTE OF TECHNOLOGY JUNE 2001
© 2001 Massachusetts Institute of Technology
Signature of Aiit-r-Certified by:-t, Professor of Ihnical Department of Mechanical Engineering May 23, 2001 Alan J. Grodzinsky and Rinengineering, M.I.T. Accepted by:
Ain A. Sonin Chairman, Departmental Committee on Graduate Students
M OF TECHNOLOGYFAS T
Jul-Development and Analysis of
Nondestructive Electrokinetic Cartilage Diagnostics
by Robin C. Evans
Submitted to the Department of Mechanical Engineering on May 23, 2001 in Partial Fulfillment of the Requirements for the Degree of Master of Science
ABSTRACT
An electrokinetic surface spectroscopy probe has been developed to take advantage of the bioelectrically coupled properties of articular cartilage. The diagnostic instrument delivers a multiwavelength current to the surface of the tissue and changes in measured impedance are correlated with molecular changes and disease progression. Previous work has demonstrated the probe's ability to detect cartilage degradation in enzymatically-degraded models. In this thesis, the probe is further developed and analyzed. It is assessed in the application of diagnosing engineered tissue repair and surgically induced degradation. The effects of cryopreservation techniques on the impedance measurements are studied. Based on previous limitations in the probe design, a novel impedance probe with permanent electrodes is developed and testing using an enzymatic degradation model. The goal of this thesis is to further develop and analyze electrokinetic spectroscopy as a means to nondestructively diagnose the molecular changes in articular cartilage.
Thesis Supervisor: Alan J. Grodzinsky Title: Professor
Acknowledgments
Three cheers for Al, a professor exceptionally dedicated to his students. I learned a new definition of teacher from Al: one who leaves the door to his office open and invites his students to drop by for a meeting "whenever it is good for you". One who is cheerful and motivated at the wee hours of the morning, rolling up his sleeves to work along side you the night before the big DePuy presentation. One who forgives me for backing his car into a fire hydrant (apologies again-aren't you glad I'm going to a country with lots of public transportation?). One who is staying late on a rainy evening to proofread this thesis. One who is thrilled to see our results, excited to answer our questions, pleased to lend out his library and to share his storehouse of knowledge and experience. Thank you for your encouragement and enthusiasm, and thank you for two years of solid academic growth.
Thank you to the lab, for laughs and life lessons learned and excellent cooking and learning to share computers. To Cyndi, avid athlete, collaborator for canine carnage and fellow Switzerland-escapist. Thanks for those times when we'd swivel 'round in our office chairs and discuss the goings-on of the world. And thanks for the company and the histology and even for driving me to the emergency room after that mountain biking trip. Can't wait to visit you in the Alps! To Nora and her multicolored fencing bruises. Thanks for sharing the hugs and the tears. Good luck with fencing-go get those guys! Keep in touch about the heartbreaks and hopes. To Dr. Parth for the late-night therapy sessions. Thank you for your gentle guidance and for helping me to establish a sense of calm in my graduate school experience. To Eliot for encouraging my forray in the the world of bicycling. And electronic circuits. Thank you for answering my calls for help with Dynssap, Dynproc, and demon-possessed computers. To Linda for reminding us about the big world outside the walls of the lab, for introducing me to a humor and compassion uniquely her own. To Gilbert Hung for helping me to burn the midnight oil last year. Thanks for quality conversations and the introduction to henna and Singing Beach. Thank you to UROPs Amanda Yang and Emily Hui. Your assisstance and insights in this project were invaluable and your company and your humor helped preseve my sanity. Best of luck with the rest of your MIT careers! Thank you to Delphine for Death by Chocolate. Yeah! We're done with our theses! Thank you to Jon and John and Alex and Moonsoo and Joonil and Greg for keeping the lab an upbeat and productive place-that is, if you are majoring in video game skills! Thank you guys, for being the expert consulatants and role model researchers. Thank you to HanHwa for keeping this boat afloat!
To my beautiful teammates from MIT Tech Track. Hooray for women's indoor track and San Diego and national qualifiers and sharing long runs and dreams together. Love always. To the gimp squad, a.k.a [email protected], a.k.a. the MIT Outing Club for all intents and purposes. Thanks for long runs around the Charles and for getting my butt out in the woods and up on top of some big, big rocks. To my spectacular brother Justin. It was my privledge to finally get to know you this year. Thanks for the prayers and encouragement and for the times we laughed until we cried. Your presence was such a salvation to me this year. Good luck with three more years in Boston. To my kitty Puff for 19 years and counting of feline devotion. To my parents Mike and Becky Evans for
being the best parents and the best friends a kid could have. Thanks for sustaining me with your emails and prayers and long phone calls. Thanks you for keeping my eyes on the big picture and filling my life with your love. And to Aaron McCabe for a crazy journey I wasn't expecting to take. Here's to the future.
Learning continues for a lifetime:
Have you heard that I am a pool shark? A nice gentleman gave the community house a magnificent pool table and we are proving to be a hot bunch. The same mentioned fellow is giving us precise instruction on how to play the best. We are going to beat all the pool halls in town.
Love, Grandma Joan -my grandmother
"The best thing you've done for me Is to help me take my life less seriously" -Indigo Girls
Funny thing about engineering and grades: I think they are inversely related.. .or at best just completely unrelated.
-Aaron McCabe
My early childhood role models
I'm in the middle of a computer class, so I should probably stop this letter and pay attention!!!!
Contents
Abstract 3
Acknowledgements 5
Contents 7
List of Figures 9
1. Introduction to Articular Cartilage 14
1.1. Cartilage Function 15 1.2. Cartilage Structure 15 1.2.1. Chondrocytes 16 1.2.2. Collagen 16 1.2.3. Proteoglycans 16 1.2.4. Interstitial Fluid 18 1.2.5. Depth-dependent Heterogenity 18 1.3. Cartilage Degradation 19 1.3.1. Acute Trauma 19 1.3.2. Osteoarthritis 20
1.4. Intervention and Treatment 21
1.4.1. Systemic and topical treatments 21
1.4.2. Joint biomechanics alteration 22
1.4.3. Surgical techniques 22
1.4.4. Gene Therapy 23
1.5. Diagnosis 24
1.6. Electromechanical Surface Spectroscopy 25
1.6.1. Development 26
1.6.2. Variable wavelength imaging 26
1.6.3. Collagen degradation model: current generated stress and
impedance 28
1.6.4. Impedance detection of trypsin-induced matrix degradation 30
1.7. Outline of Results 30
2. Electrokinetic Surface Probe in Impedance Modality 32
2.1. System setup 32
2.1.1. Probe construction 32
2.1.2. Sensor Fabrication 33
3. Quantitative Impedance Analysis of Canine Articular Cartilage Tissue
Following Graft Implantation 40
3.1. Introduction 40
3.2. Analysis of Femoral Patellar Graft Tissue 41
3.2.1. Methods 41
3.2.2. Results 45
3.3. Analysis of Patellar Tissue Articulating Against Harvest and Graft Sites 49
3.3.1. Methods 49
3.3.2. Results 50
3.4. Discussion 52
4. Effect Of Cryopreservation on Measured Tissue Impedance 52
4.1. Background 53 4.2. Experimental Procedure 54 4.2.1. Biochemical Analysis 55 4.2.2. Freezing Procedure 56 4.2.3. Data Analysis 58 4.3. Results 60
4.3.1. The Effects of Cryopreservation 60
4.3.2. The Effects of DMSO treatment 66
4.4. Discussion 68
4.4.1. Effects of Cryopreservation 68
4.4.2. Effects of DMSO treatment 68
5. Development of an Arthroscopic Electrokinetic Surface Probe with
Permanent Electrodes 69
5.1. Introduction 70
5.2. Design and construction 71
5.3. Testing of enzymatically degraded tissue 73
5.4. Results 75
5.4.1. Effects of Enzymatic Degradation 77
5.4.2. Impedance Measurements 79
5.5. Discussion 79
5.5.1. Effects of Enzymatic Degradation 79
5.5.2. Impedance Measurements 80
5.5.3. Permanent Electrode Probe Design 80
6. Summary 81
Appendix A Comparison of Degradation in Intact Human Patellar Joint Surfaces at Different Stages of Osteoarthritis via Impedance Spectroscopy 85
A. 1 Introduction 85
A.2 Methods 85
A.3 Results 87
Appendix B New Design for a Handheld Probe Using Current-Generated
Stress Diagnostics 86
B.1 Current-generated Stress 91
B.2 Fabrication and Assembly 91
B.3 New Design for CGS Probe 92
Appendix C Business Plan Summary 95
List of Figures
Figure 1.1. A schematic depicting the three main structural components of cartilage:
chondrocytes, proteoglycans, and collagen fibnls. 16
Figure 1.2. Schematic of proteoglycan, showing hyaluron core and sulfated GAG
chains. 17
Figure 1.3. Electromechanical surface spectroscopy. Probe with excitation electrodes array mounted on cartilage. The arrows show the intra-tissue current density profile
[40] (Adapted from S. Berkenblit[6]). 25
Figure 1.4. Short (A) and long (B) wavelength penetration (Adapted from S. Treppo
[50]). 27
Figure 1.5. Equivalent circuit for a biopotential electrode in contact with an electrolyte, composed of the half-cell potential, the impedance associated with the electrode-electrolyte interface and polarization effects, and the series resistance associated with interface effects and due to resistance in the electrolyte. Adapted from
Neuman [33]. 30
Figure 2.1. The probe body was composed of three main parts: the inner core, the insulating sheath, and the outer stainless steel body. (Adapted from E. Quan [37]) 32 Figure 2.2. Electrode sensor (ES) front and back, showing silver electrodes and
backing plate. [Modified from E. Quan [37]]. 33
Figure 2.3. Schematic of chloridation setup. A redox reaction plates the silver
electrodes with chloride ions. 37
Figure 2.4. External electronics. 38
Figure 2.5. Fabricated, assembled, and chlorided impedance probe. 38 Figure 3.1. The impedance probe being used in situ to measure femoral patellar
groove graft tissue impedance at the Veteran's Association Hospital in Roxbury,
MA. 39
Figure 3.2. Close-up of the impedance probe being used in situ. 39 Figure 3.3. The electrode polarities were configured so that the current penetration
Figure 3.4. Surgical procedure for the harvesting chondrocytes from the trochlear grooves on the left knee, seeding the chondrocytes in collagen matrices, and implanting the graft tissue into surgically constructed defects. 42 Figure 3.5. The impedance probe was used to take reading at the proximal and distal
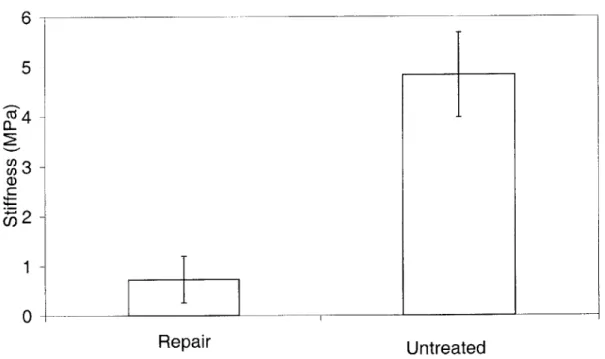
graft sites, and at an adjacent normal tissue site. 43 Figure 3.6. Typical surface textures of distal and proximal repair sites. In the dogs in this study, the distal graft tissue was smoother than that in the proximal graft. 45 Figure 3.7. Equilibrium stiffness. Repair osteochondral cores were much less stiff under equilibrium loading than untreated samples. Adapted from C. Lee. 46 Figure 3.8. Dynamic stiffness. Repair osteochondral cores were much less stiff under low-frequency dynamic loading than untreated samples. Adapted from C. Lee. 47 Figure 3.9. Normal canine femoral patellar groove cartilage (left) and typical graft repair tissue composed primarily of fibrous tissue and fibrocartilage (right). Both
sections stained with Safarin-0. 47
Figure 3.10. Graft tissue had lower impedance than the adjacent normal cartilage. The proximal graft site impedance was significantly lower than that of the adjacent normal, and was also less than that of the distal graft. 48 Figure 3.11. Impedance was measured from the patellae (circled) articulating against the graft site knee (dog's right) and against the harvest site knee (dog's left). 49 Figure 3.12. The hydration and GAG/wet weight content of the patella over the graft site, over the harvest site, and from the control subjects were not statistically
different. 51
Figure 3.13. The impedances of the patella over the graft site, over the harvest site, and from the control subjects were not statistically different. 51 Figure 4.1. Day 1 schematic. The osteochondral plugs were cored and randomly assigned to fresh or frozen groups. The frozen group was further distributed for treatment with or without DMSO. The impedance of the plugs was tested and the fresh group was immediately sliced into 0.7-mm sections and processed for biochemistry. The frozen group was allowed to soak in either 10% DMSO or PBS alone and was then flash frozen in liquid nitrogen and stored for 24 hours at -80' C.
Figure 4.2. Day 2 schematic. The frozen samples were removed from -80' C and allowed to thaw to room temperature for approximately 30 min. in PBS. The impedance of the cores was again measured and both groups were immediately sliced
into 0.7-mm slices and processed for biochemistry. 57
Figure 4.3. Linear depth comparisons of biological properties. 58 Figure 4.4. Depth-averages of the biochemical were calculated for correlation with the
three current density penetration depths. 59
Figure 4.5. Short/long and short/vlong wavelength NI and corresponding
depth-averaged biochemical ratios. 59
Figure 4.6. Linear depth comparison of %GAG/dry weight. No significant difference on a depth-by-depth basis between fresh (Gz) and frozen (Gz). Depth-dependent increase in GAG/dry weight not significant within fresh or frozen tissue. 60 Figure 4.7. Linear depth comparison of % hydration. No significant differences. Decrease in hydration with depth not significant for fresh or frozen tissue. 61 Figure 4.8. Averaged depth comparison of %GAG/wet weight. Trend toward lower %GAG/wet weight in frozen tissue, but no significant differences. 62 Figure 4.9. Averaged depth comparison of % hydration. Trend toward greater %
hydration weight in frozen tissue, but no significant differences. 63 Figure 4. 10.Averaged depth comparison of Normalized Impedance (NI). NI less in frozen than fresh tissue, significant (p < 0.05) differences in the top 0.7-mm,
corresponding to short wavelength. 63
Figure 4.11.Depth ratio comparison of %GAG/wet weight. No significant
differences. 64
Figure 4.12.Depth ratio comparison of % hydration. Significantly lower (p < 0.01)
top/mid section ratio for frozen tissue. 65
Figure 4.13.Depth ratio depth comparison of normalized impedance. Significantly greater (p < 0.01) top/mid section impedance ratio for frozen tissue. 65
Figure 4.14.Averaged depth comparison for %GAG/dry weight of cryopreserved DMSO-treated and untreated tissue samples. No significant differences. 66
Figure 4.15.Averaged depth comparison for %hydration of cryopreserved DMSO-treated and unDMSO-treated tissue samples. Significantly lower (p < 0.05) % hydration in
DMSO-treated samples in top layer. 67
Figure 4.16.Averaged depth comparison for %hydration of cryopreserved DMSO-treated and unDMSO-treated tissue samples. Trend toward lower NI (less increase) in
DMSO-treated samples. 67
Figure 5.1. Permanent electrode probe. Four silver excitation electrodes are insulated from each other by Teflon sheets and from the stainless steel casing by an insulating
epoxy. 72
Figure 5.2. Depth-averages of the biochemical were calculated for correlation with the
three current density penetration depths. 75
Figure 5.3. Significantly less GAG/dry weight in the enzymatically treated tissue than
in the control. 76
Figure 5.4. Percentage GAG per wet weight of enzymatically-treated tissue is significantly less than control tissue. Significance increases with depth. 76 Figure 5.5. Tissue hydration enzymatically-treated tissue compared to control tissue. Enzymatically-treated tissue had a significantly greater hydration near the surface. 77 Figure 5.6. Tissue impedance normalized to buffer impedance for
enzymatically-treated tissue compared to control tissue. 78
Figure 5.7. A positive correlatiQn between hydration and impedance 78 Figure 5.8. A
GAG per wet Figure A.1. [36]. Figure A.2.
negative correlation (r2 = 0.79) between impedance and percentage
weight. Triangles indicate outliers not included in correlation. 79
Short/x-long normalized impedance ratios. Adapted from E. Quan 86
GAG content of Collins graded tissue. Adapted from E. Quan [36].
Figure A.3. Hydration of Collins graded tissue. Adapted from E. Quan [36]. 87 88 Figure A.4.
E. Quan [36].
Normalized impedance of human Collins graded tissue. Adapted from 89
Figure A.5. Short/x-long normalized impedance ratios. Adapted from E. Quan
[36]. 89
Figure B.1. New design for a handheld current-generated stress diagnostic probe. 94
Chapter 1
Introduction to Articular Cartilage
1.1 Cartilage Function
Articular cartilage is a weight bearing, wear-resistant material found in the synovial
joints. Cartilage serves to protect the bone from abrasion and provides cushioning by resisting high tensile, shear and compressive forces and distributing the load to the
subchondral bone [35]. It provides joint congruity and maintenance of low stress between opposing bones. The smooth, highly lubricated surface facilitates movement with little friction between articulating surfaces. The surface of cartilage has a coefficient of friction
that is several times less than that of ice on ice [51]. Its lack of neural, vascular or
lymphatic systems can cause problems for this "wonder material", which otherwise has
high compressive strength and low friction coefficient of this When cartilage is injured,
pain is not directly sensed, nor can the injury be directly healed without a blood source
[35].
1.2 Cartilage Structure
Despite its macroscopically invariant appearance, cartilage is a heterogeneous material whose structural properties depend on the interplay between collagen fibers, proteoglycans, and the fluid phase (figure 1.1). The major macromolecular components of this high modulus connective tissue are the collagen network and the proteoglycan gel in which it is enmeshed. Cartilage is very hydrated, being 80% fluid phase and 20% solid phase. The electrokinetics are a function of the content of tissue, as well as tissue hydration.
1.2.1 Chondrocytes
Chondrocyte cells are enmeshed in the extracellular matrix (ECM). Chondrocytes make up 1-10% of the total dry tissue volume. The cells maintain ECM integrity by mediating the synthesis, secretion, degradation, and turnover of the matrix proteoglycans,
glycoproteins, and collagen fibers [40].
GAG
chain
Choncirocyte--Collagen
Figure 1.1 A schematic depicting the three main structural components of cartilage: chondrocytes, proteoglycans, and collagen fibers. (Adapted from [15]).
1.2.2 Proteoglycans
The solid matrix is highly negatively charged [28] due to the presence of proteoglycans (PGs) that make up 15-20% of the dry weight. The large aggregating proteoglycan called aggrecan (figure 1.2) has 50-100 glycosaminoglycan (GAG) chains, attached to the core
protein, each GAG consisting of an extended chain of repeating disaccharide units containing approximately one negatively charged sulfate group per disaccharide. Strong electrostatic repulsion exists between the negative charges so that the GAG chains bristle from the protein core [29]. Each aggrecan molecule, in turn, is non-covalently bound to a long hyaluronan GAG chain (figure 1.2), forming a PG aggregate that may contain up to
100 aggrecan PG monomers, together weighing approximately 200 MDa.
iidr. rgont
Link prc.vi
~4~a~u~ni~t~ KS-fich mt eux
99
CS = Chondroltin sutate
KS Keratan sulfate
Figure 1.2 Schematic of proteoglycan, showing hyaluron core and sulfated GAG chains (adapted from [15]).
The PGs are important matrix modifiers that create and maintain the water-filled compartments. The high fixed (immobile) charge on these macromolecules attracts counterions. The local high concentration of ions creates an osmotic imbalance and draws water from surrounding areas. The water drawn into the compartments then increases the concentration of macromolecules. The increased molecular concentration may increase reaction rates and promote concentration-dependent reactions [16]. The swelling pressure exerted by the water-filled compartments enables the tissue to resist deformation [2]. Both osmotic swelling and electrostatic repulsion properties of the GAG are essential to the tissue's ability to withstand compressive loads [15].
1.2.3 Collagen
Collagen fibers constitute approximately 50% of the dry weight of articular cartilage [29]. The inextensible three-dimensional lattices of the collagen fibers provide the tissue with its tensile and shear strength. The collagen mesh determines the maximum size of the ECM by trapping and immobilizing the PG molecules. While the water is pulled in by the osmotic swelling pressure of the proteoglycans, the collagen so hinders the expansion and hydration of the tissue that the PG volume is only 20% of its full domain in free solution[2].
1.2.4 Interstitial Fluid
Articular cartilage is roughly 80% water. The interstitial fluid in the tissue carries a light excess of positively charged dissociated ions that maintain electroneutrality at the continuum length scale [28].
1.2.5 Poroelastic Coupling
Cartilage may be modeled as a saturated porous media in which microstructural fluid-solid interactions result in macroscopic coupling between tissue deformation and fluid flow. The electrical, mechanical, and chemical couplings of cartilage tissue are manifested as streaming potentials and streaming currents, electroosmosis, and osmotically induced swelling [28].
1.2.6 Depth-dependent Heterogenity
In adult articular cartilage, the concentration, distribution and macromolecular organization of collagen and PG vary with depth. These into structurally identifiable zones correspond with the distribution of compressive and shearing forces [2].
The superficial zone makes up 5-10% of the total thickness and is characterized by low proteoglycan content and by the collagen fibers that run tangent to the tissue surface. Since the tensile stiffness is proportional to the ratio of collagen and PG concentration, this layer can be seen to have the highest tensile stresses [35]. The properties of the superficial zone allow it to distribute loads evenly over the surface and to resist swelling pressure.
Forty to forty-five percent of the tissue lies in the intermediate layer. Here, one finds an increase in PG concentration, amorphous collagen fibers, and more rounded cells. The next 40-45% of the tissue is designated the deep layer, wherein a high PG content is maintained and the cells are still round. However, the collagen fibers are radially aligned. There is a decline in the tensile stiffness of the deep layer, but it has a greater ability to bear compressive loads [2]. The increase in PG concentration in these layers corresponds with an increase in fixed charge.
At the osteochondral interface is the calcified layer, making up 5-10% of the tissue thickness. In the calcified layer, there is a high concentration of calcium salts and an absence of PG. The collagen fibers are radial and the rounded cells are encased in a calcified cocoon [35]. This layer locks the cartilage to the bone at the chondroosseous junction and functions to convert shear stresses into less damaging compressive forces
[2].
1.3 Cartilage Degradation
1.3.1 Acute TraumaArticular cartilage may be traumatically injured when the knee joint is compressed under heavy load or when angular or shear forces are applied to the surface. The forces may cause softening, fissuring, fragmenting or complete removal of the cartilage and result in pain, swelling, instability and loss of joint mobility [54]. Beyond the initial mechanical
insult, the injurious compression may initiate cell-mediated degradative processes that lead to osteoarthritis (OA). Multiple events such as chondrocyte apoptosis, subchondral microcracks, and joint instability have been linked to the matrix degradation and cell death that are symptomatic of osteoarthritis [34].
1.3.2 Osteoarthritis
A main feature of osteoarthritis is failure of the cartilage's biomechanical properties so that the tissue is unable to withstand high levels of mechanical stress on the joint [49]. Osteoarthritis is the most common form of arthritis, affecting 30-60 million people in the United States. Systemic risk factors include genetics, dietary intake, estrogen use, and bone density, while local biomechanical risk factors include muscle weakness, obesity, and joint laxity [20].
As may be expected from its depth-dependent heterogeneity, cartilage osteoarthritic changes vary with distance from the tissue surface. Surface fibrillation, higher water content, superficial cell necrosis, loss of normal PG orientation, and changes in mineralization characterize OA. There is a net loss of matrix PGs as the chondrocyte-mediated catabolism exceeds replacement by anabolism. This loss unmasks collagen and creates fibrillation at the articular surface. Collagenolytic activity causes cleavage of crosslinks and microfractures of collagen fibrils. The entrapped, underhydrated PGs take up extra water and the tissue swells.
Enzymatic degradation affects both the biomechanical and electromechanical transduction properties of cartilage. When damage occurs in the collagen network, increased tissue swelling results in a lower charge concentration and a possible loss of PG. As PGs are lost, the tissue carries a lower net charge. Once the integrity of the stiff protective outer layer is lost, the underlying tissue is subjected to abnormally high stresses and the degenerative changes extend deeper.
The tissue attempts to repair itself. Osteophyte formation and remodeling at the tidemark are also hallmarks of osteoarthritis. Chondrocytes near the fissures divide and form cell clusters. However, the newly synthesized matrix is ineffective in load bearing [2].
1.4 Intervention and Treatment
In 1743 W. Hunter wrote "ulcerated cartilage is a troublesome thing, once destroyed is not repaired [19]." The avascularity and low cellularity of articular cartilage limits its capacity for repair, and partial thickness defects rarely show signs of healing [13] [31]. While a successful regeneration of cartilage remains elusive, many treatments have been developed to alleviate pain, inhibit further degradation, and stimulate repair. However, valid assessment of these treatments requires nondestructive analysis before, during, and after the therapy, and many require early diagnosis for best results.
1.4.1 Systemic and topical treatments
Mild to moderate osteoarthritic pain may be treated with systemic and topical treatments. Oral medications include non-opiod analgesics and nonsteroidal anti-inflammatory drug (NSAIDS). If the patient does not respond to these medications, more potent but potentially addictive opiod therapy may be applied. Glucosamine and chondroitin supplements have become popular on the consumer market, but there is a lack of a plausible mechanism for therapeutic effect. The NIH is launching the first widespread independent study and results are scheduled to be published in 2004. Topical analgesics are also used to treat mild to moderate pain. Topical creams and gels are most widely prescribed topical treatments for osteoarthritis in the hand or foot [18].
1.4.2 Joint biomechanics alteration
Therapy aimed at altering joint biomechanics may help to decrease the symptoms and progression of osteoarthritis. Studies show that deconditioned muscle, inadequate motion, periarticular stiffness may contribute to signs and symptoms of osteoarthritis [47]. Exercise therapy focuses on (1) range of motion and flexibility exercises, (2) muscle conditioning, and (3) aerobic cardiovascular exercise. Bracing and footwear is another cost-effective and simple alternative to more invasive therapy.
Acupuncture is also gaining acceptance as a nonsurgical treatment. Acupuncture may relieve pain through activation of the neural gate-control system or through the release of neurochemicals. Results from studies are inconclusive, but promising.
1.4.3 Surgical techniques
Surgical treatment of osteoarthritis may be classified as nonbiological or biological treatment. Arthrodesis is a nonbiological treatment in which the affected joints are fused together. While this treatment is usually reserved for small joints, it may also be performed on the hips and knees of small children with unilateral disease [18]. Abrasion arthroplasty and microfracture are techniques that penetrate the subchondral bone in order to promote bleeding and cell infiltration. The repair tissue has been found to fill the defects[32] and to provide symptomatic relief. However, histological analysis has revealed that the repair tissue is composed primarily of fibrous and fibrocartilaginous tissue and hyaline cartilage that lacks normal architecture [45].
Total joint replacement is a widely performed and largely successful surgical treatment. The pain and disability of late-stage osteoarthritis are eliminated and patients return to near-normal function [23][24]. However, the implants have limited durability past 20 years and may limit the activities of more active patients.
The most commonly implemented biological treatments are osteochondral autograft transfers (OATS) and osteochondral allograft reconstructions (OAR). In OATS, a small full thickness defects can be treated by transferring grafts of bone and cartilage from a healthy area in the knee into the defect [54]. The grafts are reportedly taken from "non-functional" areas but that nomenclature is disputed. OAR is a technique of harvesting, testing and preserving bone and articular cartilage from deceased human tissue donors. Grafts up to 4-cm. in diameter have been used to fill femoral condyle surface defects [54]. OAR has been primarily reserved as a limb-sparing procedure for tumor patients and there are considerable infection rates [53].
A variety of matrices, cells, and regulators are being studied for use in tissue engineering. Autologous chondrocyte implantation is currently being engineered on full thickness defects in a weight bearing area of the femoral condyle. A biopsy is obtained arthroscopically from a purportedly "non-functional" area. The cartilage cells are manipulated to replicate matrix, suspended in a liquid medium, and then injected into the defect during a second surgery. While this procedure and many other grafts have shown promise, they still lack the full properties of articular cartilage and have demonstrated only partially integration with host tissue [27], and techniques are currently limited to use on small defects [18]. However, significant symptomatic relief has been provided by the formation of tissue with the cellular, matrix composition, and architecture of fibrocartilage and nonarticular hyaline cartilage [9].
1.4.4 Gene Therapy
A human gene protocol has been developed for rheumatoid arthritis that demonstrates the applicability of orthopedic gene therapy. In this protocol, a gene encoding human interleukin-1 receptor antagonist protein is transferred to the metacarpohalangeal joints. The first patient was treated in July 1996. The experimental data indicates that gene therapy could be beneficial in treating osteoarthritis and cartilage repair. If progress continues smoothly, there could be wide clinical application of gene therapy within 5-10 years [21].
1.5 Diagnosis
This thesis presents the design and analysis of an alternative diagnostic of cartilage degradation. The most prevalently used method of cartilage degradation diagnosis is visual inspection by arthroscopy. This method requires at least a minimal amount of surgical invasion and is only able to detect gross tissue pathology. The physician inspects the surface for roughening, fibrillation, granularity, fissuring, fraying, discoloration, or blistering [10].
Visual inspection is often accompanied by arthroscopic indentation. Physicians palpate the tissue with a blunt indentor and qualitative softness is used an indication of degradation. Dashevsky [10] and Lyrra [29] have developed quantitative indentor probes. However, strain calculations require knowledge of tissue thickness, which must be determined by a second X-ray measurement, and the test provides only mechanical parameters and is not as sensitive as the physiochemical status [40].
Radiography and Magnetic Resonance Imaging have been used to map the three-dimensional geometry and water content of the tissue. These methods are noninvasive and provide significant information, but the details of biochemical degradation are not sufficiently resolvable at the early stages[40]. Blood tests have also shown to reveal signs of osteoarthritis. The partially degraded matrix components diffuse out of the cartilage and into the synovial fluid. The components then enter the lymphatics and eventually reach the circulation [2].
Biochemical analysis may be done on tissue biopsies. GAG assays are performed with dimethylmethylene blue (DMMB) dye to assess PG content, hydroxyproline assays test for collagen cleavage, and the tissue may be lyophilized in order to calculate its water content. While, there is no correlation among these properties in non-OA tissue, the PG content decreases and the water loss increases as OA progresses. However, these are relative compositional changes and no absolute correlation has been established [39]. Moreover, the tissue must be damaged to obtain biopsies.
1.6 Electromechanical Surface Spectroscopy
An electromechanical surface spectroscopy probe has been developed to take advantage of the coupled properties of cartilage tissue. In electromechanical surface spectroscopy, a sinusoidal current applied to surface of another medium and the resultant response is measured. When a sinusoidal current density is applied to the cartilage tissue surface via an excitation electrode array, the fixed negative charge in the matrix is pulled toward the positive electrodes and the intratissue fluid is displaced toward the negative electrode (figure 1.3) [14]. The fluid convection of the counterions separating from the oppositely charged matrix molecules creates a streaming potential. Due to the macroscopic coupling between tissue deformation and fluid flow, the flow produces a mechanical perturbation, which may be measured with a surface stress sensor and recorded as the current-generated stress [5]. The voltage drop across the electrodes may also be measured and the ratio of the voltage and the applied current may be recorded as the impedance.
+SENSOR
CartilageCA
TL G
I]
Boner
Figure 1.3 Electromechanical surface spectroscopy. Probe with excitation electrodes array mounted on cartilage. The arrows show the intra-tissue current density profile [40] (Adapted from S. Berkenblit[6])
1.6.1 Development
Frank [11] developed a uniaxial configuration for cartilage spectroscopy in which current was applied via electrodes on opposite ends of the excised cartilage plug. Sachs [41] later demonstrated in a mathematical model that two silver electrodes placed on the same surface side of cartilage could induce a measurable mechanical response when current was applied. This technique had the advantage of being potentially nondestructive.
Salant [43] and Berkenblit [6] subsequently designed a hand-held spectroscopic probe to produce excitations on the surface of the cartilage tissue with an interdigitated array of electrodes. The probe could measure the bulk material properties of dielectric materials
[55] such as cartilage by applying a spatially and temporally periodic sinusoidal signal and evoking a simultaneous electrical or mechanical response that could be measured at the same surface. The benefits of dielectric spectroscopy in cartilage diagnostics are that it is nondestructive and that varying the imposed spatial wavelength may test different depths of tissue. One may test for spatial inhomogeneities and detect molecular level changes.
1.6.2 Variable wavelength imaging
The variable wavelength imaging was first tested in the current-generated stress modality. A probe was constructed with four independently addressable electrodes. The wavelength was determined by the electrode excitation pattern at the tissue surface. The characteristic depth of penetration of the imposed current density is approximately 1/3 the spatial wavelength of the current [5] so that a short wavelength could assay the superficial region of the tissue, while long wavelength would assay the full thickness. In this manner, one could image depth-dependent focal lesions.
+ +
(~i
-~ -0A1/2
~-(A)
Cartilage
k/2
0'
0
I- /(B)
Cartilage
-(B)
Figure 1.4 Short (A) and long (B) wavelength penetration (Adapted from S. Treppo
[50]).
Calf cartilage was subjected to trypsin digestion as a model of aggrecan degradation. A diffusion chamber was designed to allow the enzyme to contact tissue only at the surface so that a longer exposure time would result in deeper penetration. The probe was used to measure the short and long wavelength stress response of disks before and after trypsin. In the normal tissue, the short wavelength response was approximately half of the long wavelength response, while after a 2-hour trypsin treatment, the short wavelength response decreased significantly compared to long wavelength [5]. This in vitro model system provided controlled PG loss from tissue, and the significant decrease in the measured stress in the enzymatically degraded tissue compared to controls confirmed the sensitivity of current generated stress to monitor molecular level degradation and showed ability of the probe for spatial imaging [4].
1.6.3 Collagen degradation model: current generated stress and impedance
The probe was shown to be able to produce two simultaneously measured outputs to detect controlled degradation in vitro as induced by using matrix metalloproteinases (MMPs) [6]. MMPs have an important role in the degradation and turnover of ECM molecules such as type II collagen and aggrecan. They regulate both normal remodeling and disease progression [44]. Two MMPs in particular, MMP-1 and MMP-13, are found in higher levels in osteoarthritis tissue [7][45]. The spatial and temporal changes in molecular activity caused by MMPs result in functional changes in mechanical and electrical changes. This study measured molecular level changes in collagen-proteoglycan matrix using both current-generated stress and impedance.
Bovine osteochondral cores were placed enzymatically degraded in MMPs for up to 24 hours. They were placed in diffusion chambers that allowed only surface penetration. The bathing medium assayed extent of matrix degradation. An 800 ptm disk removed from top and placed in contact with surface probe. A current density of mA/cm was applied to the surface of the tissue over a frequency range of 0.025-1.0 Hz. The tissue was also stained with monoclonal antibody 9a4 to localize damage to collagen molecules.
It was found that the most intense collagen damage occurred at surface. While the MMP-1 had degraded down to 0.8 mm by 24 hours, the MMP-MMP-13 had only penetrated 50 rim. The release of PG increased with time. The current generated stress was analyzed as a short-wavelength to long wavelength stress response ratio (SR). The SR decreased significantly in MMP-1 by 24 hours at 0.025 Hz, but there was no significant difference for buffer alone or MMP-13. It was seen that the minimum wavelength X = 3.23 insufficient to measure change in MMP-13 using CGS. However, the impedance modality was sensitive to changes even at extreme superficial layer. There was a significant increase in impedance at all frequencies in the long wavelength configuration for both MMP-1 and MMP-13. The most significant increase occurred at greater frequencies. The increase was likely due to decreasing PG content and increased swelling at constant PG.
1.6.4 Impedance detection of trypsin-induced matrix degradation
The first impedance experiments with the handheld probe were conducted on bovine osteochondral cores were exposed to trypsin for 4 hours, with surface-only digestion. Controls were divvied up as either 0-hour trypsin, 24-hour trypsin, or 0, 4, or 24 hours in buffer. The digestion buffer was collected and assayed for PG degradation. The top 1mm of each core was placed in contact with probe at increasing strain at 0, 10, 20, 30, 40, and 50%. Only the two inner electrodes were used to apply a current density of 1 mA/cm2 at 1, 10, 100, and 1000 Hz. Biochemical assays were used to test for hydration and GAG content.
The trypsin treatment significantly reduced GAG content The GAG loss increased with digestion time and was concomitant with a significant increase in hydration. As the applied current frequency increased, the impedance magnitude decreased. As the strain on the tissue increased, there was a monotonic decrease in impedance for all frequencies. The difference in impedance between the control and treated tissue was frequency-dependent. At 1 Hz, the enzymatically-treated tissue had a higher impedance than controls, while at 1000 Hz, control tissue had higher impedance than enzymatically-treated tissue.
This result was due to the frequency-dependence of the electrode-electrolyte interfacial impedance. The interfacial impedance may be modeled as a conductance and resistance in series, so that its magnitude was much greater as low frequencies such as 1 Hz than at higher frequencies such as 1000 Hz. The impedance measurements have since been conducted at frequencies of at least 100 Hz to minimize the affect of the interfacial impedance.
The electric charge distribution at the electrode-electrolyte interface results in a capacitance and a leakage resistance across the charge double-layer, so that the interface can be equated to a resistance Rd and a capacitance Cd in parallel (figure 1.5). The
resistance and impedance may then be lumped into an interface impedance. Subsequent measurements have also been normalized to the impedance of the probe in a buffer solution in order to account for variations in interface conditions.
0
- E
+ hc
Rd Cd Electrode-electrolyte interface
RS Interface effects & electrode resistance 0
Ehc =half-cell potential
Rd =leakage resistance across the double-layer of charge Cd =capacitance across double-layer
R= saline/PBE resistance
Figure 1.5. Equivalent circuit for a biopotential electrode in contact with an electrolyte, composed of the half-cell potential, the impedance associated with the electrode-electrolyte interface and polarization effects, and the series resistance associated with interface effects and due to resistance in the electrolyte. Adapted from Neuman [33].
1.7 Outline of Results
This thesis reports several studies performed using an impedance probe to detect the bioelectric properties of articular cartilage. Attention is paid to molecular-level changes in the matrix that are induced by human osteoarthritis, autologous graft treatment, and enzymatic degradation models. Because of cartilage's heterogeneous composition, the measurements are analyzed for depth-dependent changes that yield more sensitive and detailed information about the state of the tissue. The impedance measurement system is therefore assessed for feasibility as a diagnostic for detection of early-stage degradation and of the efficacy of subsequent repair treatments.
Chapter 2 presents the impedance probe system, including changes made since previous publications. In chapter 3 the impedance probe is used in situ to assess its ability to diagnose graft repair and to detect secondary degradation from the graft therapy. The need to test samples that had previously been frozen was the motivation for the study in chapter 4, in which the effects of cryopreservation on the impedance of cartilage samples is measured. Finally, in chapter 5, a novel impedance probe with permanent electrodes is developed and tested with an enzymatic tissue degradation model. The thesis will be
summarized in chapter 6.
The results of a study on the measurement and comparison of the degradation of intact human patellar joint surfaces at different stages of osteoarthritis are compiled in appendix A. Appendix B contains information about a new design for a handheld spectroscopic probe using current-generated stress (CGS) to diagnose the electrokinetic state of the tissue, and in appendix C is the summary of business plan for the CGS probe.
Chapter 2
Electrokinetic Surface Probe in Impedance Modality
2.1 System setup
2.1.1 Probe constructionA hand-held impedance probe with disposable electrode sensors was used in the
experiments in this thesis, unless otherwise specified. The modular design was composed of disposable sensors mounted onto a cylindrical body with three main parts: the inner core, the insulating sheath, and the outer stainless steel body (figure 2.1).
F-It I__---__
A
[9I!II
.K.
...
__-i
---B
C
Figure 2.1 The probe body was composed of three main parts: the inner core, the insulating sheath, and the outer stainless steel body. (Adapted from E. Quan [37])
A thin disposable laminated electrode structure (ES) was used to apply the current via
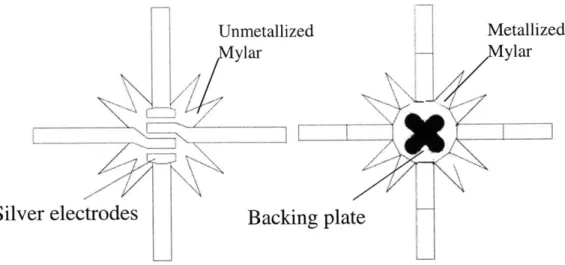
silver excitation electrodes that were photofabricated on an insulating metallized Mylar layer. A backing plate was bonded to the metallized Mylar side of the ES (figure 2.2). The backing plate aligned the ES with a machined recess on the tip of the probe to ensure
that the electrodes were mounted to a flat surface and were properly oriented to the electrical connections.
Unmetallized Metallized
ylar ylar
_/_T
Silver electrodes Backing plate
Figure 2.2 Electrode sensor (ES) front and back, showing silver electrodes and backing plate. [Modified from E. Quar [37]].
The ES was fixed on the tip of a cylindrical torlon core that housed the four individually insulated wires carrying the driving current to embedded copper contacts. A thin cylindrical sheath of delrin was pressed over the ES to stabilize the contact between the silver electrode arms and the copper contacts. The sheath also electrically insulated the ES and the electrical connections on the probe core.
The delrin core sits on a stainless steel body and this inner core subassembly was clamped into a stainless steel outer tube with a screw to create a sealed environment. The steel shell acted as a conductive ground plane that sent extraneous signals to ground. Silicon adhesive was applied after mounting to provide additional sealing at the ES-sheath and ES-sheath-outer tube interfaces.
2.1.2 Sensor Fabrication
Electrode sensor construction
The electrode sensors (ES) were fabricated as previously reported by Treppo [50] and Quan [37]. A 25.4 pm-thick silver foil (Johnson Matthey, Ward Hill, MA) was cut to
11mm2 and a 25.4 tm Mylar polyester film (MADICO, Woburn, MA) was cut to 10 mm2 square. The Mylar was metallized one side with aluminum. The silver film was cut to the size which would allow it to have electrical connection with the brass contacts, and the Mylar film was cut to the size which would allow it to be electrically grounded to the inner core to provide shielding. The surface of the silver was abraded with a slurry powder to remove surface impurities in preparation for the photofabrication and chloridation. A two-part urethane epoxy (Tycel 7000/7200, Lord Corp., Erie, PA), thinned with methyl ethyl ketone, was used to bond the Mylar and silver. Only a thin layer of epoxy was desired, to maintain flexibility. The unmetalized side of the Mylar was bonded to the silver so that the metallized side was grounded through contact with the stainless steel rim of the inner core.
Photofabrication
The electrodes were created through photofabrication. To optimize photofabrication, the ES was cleaned in a mild detergent (Alconox, Alconox Inc, New York, NY), and dipped in 15% nitric acid so the surface would be slightly acidic. The ES was thoroughly rinsed in deionized water (DI) and was convection baked to remove moisture.
An even layer of photoresist polymer (KPR Photoresist, KTI Chemicals, Sunnyvale, CA) was pipetted onto each sensor. The resist allowed to dry for 20-30 minutes and then dried in convection over for another 10 minutes. The ESs with the dried resist layer were placed in registered masks. The masks were placed between two glass plates in exposure apparatus and exposed under UV light for 15 minutes. The unmasked areas were crosslinked under UV light so that they were resistant to chemical etching. The masks and glass plates were wiped carefully to remove dust that could prevent polymer crosslinking and cause holes and cracks in the electrodes. The sensors were then rinsed in a xylene-based developer (KPR Developer, Alphametals, Jersey City, NJ) for a total of a minute, washed in warm tap water and DI water to wash off uncrosslinked photoresist, and blotted dry.
Etching, Stripping, Cutting
Etching dissolved the silver not protected by the crosslinked photoresist. The sensor was blotted dry and mounted in a Teflon holder that exposed the center of the silver in a well. A 55% ferric nitrate etchant was pipetted into the well and agitated for 12-14 minutes.
The etchant was replaced approximately every two minutes to maintain potency. The etching was complete when the silver around the electrode was gone and the Mylar beneath was exposed. The ES was removed and rinsed with DI water.
A toluene-soaked (Mallinckradt, Paris, KY) cotton swab was used to rub off the nonconductive photoresist on the electrodes. The ES was washed again in a gentle cleanser and rinsed in DI water. A sharp scalpel was used to cut the 0.4" wide silver arms and the star-shaped folding pattern.
Assembly
A 0.33-mm backing plate was affixed to the back of the sensor to align the silver electrodes with the probe body electrical contacts and keep the sensors flush against the probe tip. The backing plate rested in the recess when sensor was placed on the probe. A cotton swab was used to hold the sensor in place while the delrin sheath was placed over the head of the probe. The electrical connection between the silver arms of the sensor and the copper tabs on the side of the probe was checked with a multimeter. When the connection was established, a thin layer of silicon adhesive sealant (Superflex Clear RTV Silicone, Loctite Corporation, Rocky Hill, CT) was applied to the sheath-sensor interface. The sheath was then completely pressed over the probe head and the excess sealant was wiped from the electrodes.
The stainless steel outer body was placed over the subassembly and after rechecking for electrical connections, another thin layer of silicone was applied to the stainless steel-sheath interface. All of the parts of the probe were pressed together by tightening a neural nut. The connections were checked again and the sealant was allowed to dry overnight.
Chloridation
The chloridation step plated the silver electrodes with a silver/silver chloride layer by means of a closed-loop electrolytic cell. Applying a silver chloride deposit alters the stabilization of the electrode potential and also the impedance between the electrode and the bathing electrolyte [12].
The magnitude of the interface impedance depends on the thickness of the chloride deposit. Chloridation reduces the interface impedance by creatin an increased surface area. Too much chloride deposit, however, will increase the resistance to current flow. It has been empirically determined that the optimal silver chloridation for minimal electrode-electrolyte impedance occurs at 1000mAs/cm2 [12]. For the four 1.59mm2
electrode configuration on the ES, the current was set to 71 [tA and the reaction was run
for 15 minutes.
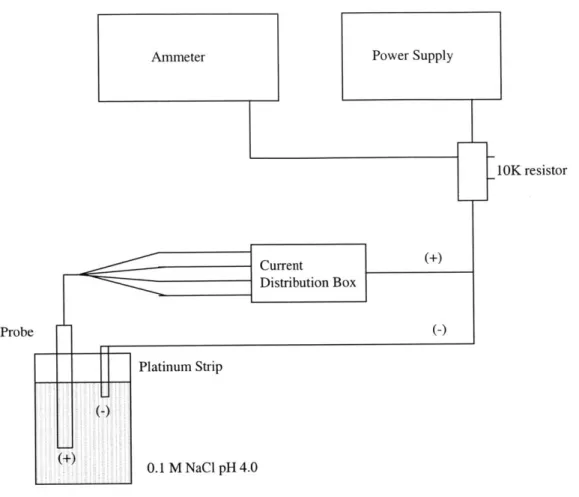
The electrodes were abraded with sandpaper to prevent nonuniform deposit of chloride. The probe tip was then suspended in a chamber with unbuffered 0.1M NaCl pH 4.0. The four electrodes were connected to the positive terminal of a Hewlett Packard 6214A DC power supply in series with a Keithley ammeter and a 10 kohm resister, which approximated a constant-current source. A platinum electrode was suspended in the bath and connected to the negative terminal (figure 2.3). The electrodes were shorted together while the current was then turned on and adjusted to the desired value. When the chloriding was to begin, the short was opened and the current passed through the chloriding bath to create a redox reaction that deposited chloride ions onto the silver electrode.
Ammeter (+) 10K resistor Current W Distribution Box (-) Platinum Strip 0.1 M NaCl pH 4.0
Figure 2.3 Schematic of chloridation setup. A redox reaction plates the silver electrodes with chloride ions.
2.1.3 Hardware setup
The current parameters are determined by computer settings. The operator designates amplitude, frequency, wavelength, and repetitions. This information is sent to the current source and to the electrometer. The current source is powered by an external power supply and delivers the specified current amplitude and frequency to the current distribution box, and provides the electrometer with the measured voltage drop across the electrodes. The current source also communicates with the electrometer for auto-drift correction. The electrometer also sends waveform information to the current distribution box. The current distribution box directs the polarity of the four excitation wires that drive the sensor electrodes (figure 2.4).
Probe
Pbwer Source
CUrrent - Qient/voltage
Distribution PP1
Bot ret source
Wavelength Vn Dr ift Probe 1; Vu Bectronmeter C~n i MLe Carrent paamters
Figure 2.4 External electronics
Figure 2.5. Fabricated, assembled, and chlorided impedance probe. Adapted from E. Quan.
Figure 3.1 The impedance probe being used in situ to measure femoral patellar groove graft tissue impedance at the Veteran's Association Hospital in Roxbury, MA.
Chapter 3
Quantitative Impedance Analysis of Canine Articular
Cartilage Tissue Following Graft Implantation
3.1 Introduction
The aim of this study was to test the probe for potential in vivo measurement of molecular changes in articular cartilage after chondrocyte transplantation. Cultured autologous implantation is one of the most widespread treatments of chondral defects at this time. The efficacy of this treatment is the subject of much debate and studies suggest that the procedure may also have a degenerative effect on the surrounding tissue [27]. However, in situ testing of the effects of the transplant on the donor site and the transplant site has been limited by available technology. The quantitative and nondestructive nature of the probe renders it an improvement over qualitative mechanical probing and the destructive biopsies required for biochemical assays.
The electromechanical surface spectroscopy probe was used in situ to measure the electrokinetic properties of canine cartilage tissue (Figure 3.1). This study had a two-fold objective. The first was to assess the probe device as a diagnostic of tissue repair, and canine repair graft tissue on the femoral patellar groove impedance (Figure 3.2) was compared with histological, mechanical, and electromechanical measurements. Secondly, we wished to further assess the ability of the probe as a diagnostic of tissue degeneration. We measured the degenerative effects of the surgical procedure on untreated, articulating tissue and compared the measured impedance with tissue hydration and GAG content.
3.2 Analysis of Femoral Patellar Graft Tissue
3.2.1 MethodsSurgical Procedure
This animal experiment was approved by the Brockton/West Roxbury VA Animal Care Committee and the surgical procedure was performed using a protocol previously reported [8]. Chondrocytes were harvested from the trochlear ridges of six mature hound dogs. The harvest involved the removal of a strip of tissue approximately 20-25 mm long and 3-5 mm wide down to the tidemark. The cells were cultured in monolayer up to third passage and seeded in N-3- (3-dimethylaminopropyl)-N-ethyl-carbodiimide (EDAC) Cross-linked type II collagen matrices (Chondrocell, Geistlich Biomaterials, Wolhusen, Switzerland), the pore characteristics of which have been previously reported [26]. The matrices were implanted in 4-mm surgically constructed defects in the contralateral joint. The right knee joints of the animals were immobilized for ten days, after which ambulation appeared normal. The animals were sacrificed 15 weeks after implantation
(Figure 3.4).
Impedance Measurements
At necropsy, impedance measurements were taken by placing the electrokinetic probe on the surface of the opened right knee joint. The impedance measurements were made using a 4.5-diameter sensor on the tip of the probe. In this study, the electrodes were configured so that the current penetration depth was 0.7mm as shown in Figure 3.3.
0.7-mm
Figure 3.3 The electrode polarities were configured so that the current penetration was approximately 0.7-mm.
Animals sacrific
at 16 weeks
4-mm diameter d
ect
efects
4-ii
106
cells/disk
EDAC x-linked
porcine type II
collagen matrices
(Lee 2001)
Figure 3.4 Surgical procedure for the harvesting chondrocytes from the trochlear grooves on the left knee, seeding the chondrocytes in collagen matrices, and implanting the graft tissue into surgically constructed defects.
In the short wavelength configuration, for a current density of J = 1.0 mA/cm2, the total driving current amplitude was 31.8 gA. The impedance was then calculated as the ratio of the measured voltage drop across the electrodes to the applied current.
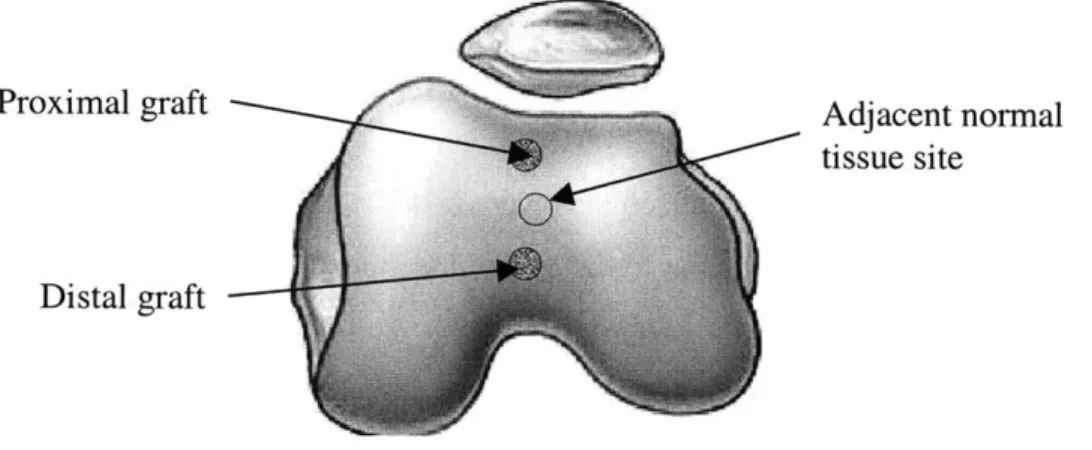
The probe was placed on the surface of the femoral patellar tissue with a 50kPa offset stress. Measurements were taken on the proximal defect, the distal defect, and at an adjacent normal tissue site as outlined in Figure 3.5. Before and after each measurement on the tissue, a measurement was taken in 0.15M PBS to determine the impedance of the interface and the buffer used to hydrate the tissue during the procedure.
Proximal graft Adjacent normal
tissue site
Distal graft
Figure 3.5 The impedance probe was used to take reading at the proximal and distal graft
sites, and at an adjacent normal tissue site.
The impedance was measured on the tissue surface as well as in the buffer solution for reference. The buffer measurement impedances were taken immediately before and after each tissue measurement, averaged together, and the tissue impedance was then normalized to this averaged buffer impedance. The measurements were then grouped by site (proximal, distal, and adjacent normal), and a student t-test was applied to compare each site group. Significance was determined at p<0.05 and p< 0.01. Impedance data is presented below as mean +/- standard error. The averages were taken for each of the three

![Figure 1.2 Schematic of proteoglycan, showing hyaluron core and sulfated GAG chains (adapted from [15]).](https://thumb-eu.123doks.com/thumbv2/123doknet/14731543.573090/17.918.139.771.286.585/figure-schematic-proteoglycan-showing-hyaluron-sulfated-chains-adapted.webp)