HAL Id: hal-00302633
https://hal.archives-ouvertes.fr/hal-00302633
Submitted on 27 Feb 2007HAL is a multi-disciplinary open access
archive for the deposit and dissemination of sci-entific research documents, whether they are pub-lished or not. The documents may come from teaching and research institutions in France or abroad, or from public or private research centers.
L’archive ouverte pluridisciplinaire HAL, est destinée au dépôt et à la diffusion de documents scientifiques de niveau recherche, publiés ou non, émanant des établissements d’enseignement et de recherche français ou étrangers, des laboratoires publics ou privés.
Long-range transport of mineral aerosols and its
absorbing and heating effects on cloud and precipitation:
a numerical study
Y. Yin, Lin Chen
To cite this version:
Y. Yin, Lin Chen. Long-range transport of mineral aerosols and its absorbing and heating effects on cloud and precipitation: a numerical study. Atmospheric Chemistry and Physics Discussions, European Geosciences Union, 2007, 7 (1), pp.3203-3228. �hal-00302633�
ACPD
7, 3203–3228, 2007 Heating effect of mineral aerosols on cloud and precipitationY. Yin and L. Chen
Title Page Abstract Introduction Conclusions References Tables Figures ◭ ◮ ◭ ◮ Back Close
Full Screen / Esc
Printer-friendly Version Interactive Discussion
Atmos. Chem. Phys. Discuss., 7, 3203–3228, 2007 www.atmos-chem-phys-discuss.net/7/3203/2007/ © Author(s) 2007. This work is licensed
under a Creative Commons License.
Atmospheric Chemistry and Physics Discussions
Long-range transport of mineral aerosols
and its absorbing and heating effects on
cloud and precipitation: a numerical
study
Y. Yin and L. Chen
Nanjing University of Information Science and Technology, Nanjing 210044, China
Received: 2 February 2007 – Accepted: 20 February 2007 – Published: 27 February 2007 Correspondence to: Y. Yin (yyatnuist@yahoo.co.uk)
ACPD
7, 3203–3228, 2007 Heating effect of mineral aerosols on cloud and precipitationY. Yin and L. Chen
Title Page Abstract Introduction Conclusions References Tables Figures ◭ ◮ ◭ ◮ Back Close
Full Screen / Esc
Printer-friendly Version Interactive Discussion
Abstract
There have been numerous recent publications showing that mineral dust might be a good absorber for solar radiation in addition to its capability as cloud condensation nuclei (CCN) and ice forming nuclei (IFN), and could lead to reduced cloud cover and precipitation in the region it presents. This effect is investigated using a cloud model
5
with detailed microphysics of both warm and ice phase processes. The model is initial-ized using measured distributions and concentration of mineral dust particles. Our re-sults show that when the dust layer with peak concentration appears at the cloud-base height and below 3 km, where the temperature is warmer than –5◦C, inhibits the devel-opment of cloud particles and precipitation, and together with early activation of larger
10
cloud droplets on giant cloud condensation nuclei, which accelerates drizzle formation through collision coalescence process, reduces the cloud optical depth and albedo. It is also found that only when the dust layer locates at altitudes with temperature colder than –5◦C, mineral aerosols can act as effective ice nuclei and intensify the ice-forming processes. Under this condition, the existence of dust layer can either increase or
de-15
crease cloud optical depth and albedo, depending on the concentration and chemical composition of the absorbing components, or the time the mineral aerosols suspended in the atmosphere.
1 Introduction
In climate modeling, the largest remaining uncertainties arise from the complexities of
20
the influence of tropospheric aerosols on the global climate (IPCC, 2001). Over 50% of the global production of tropospheric aerosol particles consists of mineral aerosols, originating mainly from the deserts and their borders (Andreae et al., 1986). Mineral dust particles, unlike other tropospheric aerosol species, are raised rapidly to high altitudes by extremely high winds occurring over limited regions with very fine grain soil.
25
ACPD
7, 3203–3228, 2007 Heating effect of mineral aerosols on cloud and precipitationY. Yin and L. Chen
Title Page Abstract Introduction Conclusions References Tables Figures ◭ ◮ ◭ ◮ Back Close
Full Screen / Esc
Printer-friendly Version Interactive Discussion
from very specific areas around the globe, it can be transported over long distances (e.g., Prospero, 1999; DeMott et al., 2003; Trochkine et al., 2003; Zhao et al., 2003). During the process of transport, some of the insoluble dust aerosols are coated with sea salt and/or anthropogenic pollutants such as sulfate and nitrate. These interactions cause the aerosols to be more soluble and increased their chance to serve as cloud
5
condensation nuclei (CCN) (Levin et al., 1996). However, the effect of mineral dust on climate is complex and uncertain.
Using satellite observations, Rosenfeld et al. (2001) found that desert dust might suppress precipitation. On the other hand, Wurzler et al. (2000) and Yin et al. (2002) used numerical models to show that giant cloud condensation nuclei (GCCN) including
10
dust coated with soluble material (e.g., sulfate) may actually increase the amount of precipitation in some clouds because of the effective growth of the drops by collection. These latter results were supported by recent remote sensing of dust-cloud interac-tion in the Aral Sea region (Rudich et al., 2002). By using NOAA-AVHRR retrievals, Rudich et al. (2002) showed that large salt-containing dust particles from the Aral Sea
15
interacted with clouds and increased cloud drops to sizes that promote precipitation. In addition, there have been evidence showing that dust particles are efficient ice forming nuclei (IFN). For example, DeMott et al. (2003) measured the IFN concentrations in a dust layer that was transported from Africa to Florida. They showed that between about 1.5 and 4 km altitude the IFN concentrations reached up to 1 cm−3. These values were
20
about 20 to 100 times higher than those measured at lower altitudes in a non-dusty environment at the same location.
Using a numerical model combined with measurements and by including mineral dust as both efficient CCN and IFN, Levin et al. (2005) showed that ignoring the ice-nucleating ability of the mineral dust, but allowing the soluble component of the mixed
25
aerosols to act as GCCN, enhanced the development of the warm rain process in continental clouds. On the other hand, allowing the mineral dust particles to also act as efficient ice forming nuclei (IFN) the amount of rain on the ground was reduced as compared to the case when they were inactive. More recently, Huang et al. (2006a,
ACPD
7, 3203–3228, 2007 Heating effect of mineral aerosols on cloud and precipitationY. Yin and L. Chen
Title Page Abstract Introduction Conclusions References Tables Figures ◭ ◮ ◭ ◮ Back Close
Full Screen / Esc
Printer-friendly Version Interactive Discussion
b) showed using satellite data that cloud water path could be reduced due to mineral dust. Unlike Rosenfeld et al., they attributed this to the absorbing and heating effect of mineral dust. Costa et al. (2006) also indicated by analyzing GOME and GMS satellite data that the mineral dust particles from Asia have lower scattering efficiency, implying that the particles were more absorbing. However, the absorbing and heating effect of
5
mineral dust on cloud microphysical properties and precipitation have rarely studied (Lohmann and Diehl, 2006). The mineral aerosols from the arid and semi-arid areas in East Asia could play an important role in development of clouds and precipitation due to the vast emission and atmospheric loading of mineral dust in this region (e.g. Zhang et al., 2003).
10
In this study, a dynamic cloud model with detailed description of warm and cold cloud microphysics is used to investigate the effects on cloud development and precipitation due to changes in in-cloud thermodynamic structure that occur due to absorbing of solar radiation by dust particles. The intention is to shed some light on the response of microphysical and optical properties of clouds developed under different aerosol
15
conditions to heating rate and the altitude and depth of the absorbing dust layer.
2 A brief description of the cloud model
The dynamic framework of the model is a two-dimensional slab-symmetric non-hydrostatic cloud model (Yin et al., 2000). The vertical and horizontal velocities are calculated based on the stream function and vorticity equation. The other predicting
20
equations for virtual potential temperature, specific vapor perturbation, the specific con-centration of CCN, and the specific mass and number of each species of hydrometeors considered (drops, graupel, ice crystals, and snowflakes) were based on the previous work by Reisin et al. (1996) and Yin et al. (2000, 2002).
The warm microphysical processes included are: nucleation of CCN,
condensa-25
tion and evaporation, collision-coalescence, and binary breakup (Low and List ker-nel). The ice microphysical processes included are: ice nucleation (deposition,
ACPD
7, 3203–3228, 2007 Heating effect of mineral aerosols on cloud and precipitationY. Yin and L. Chen
Title Page Abstract Introduction Conclusions References Tables Figures ◭ ◮ ◭ ◮ Back Close
Full Screen / Esc
Printer-friendly Version Interactive Discussion
condensation-freezing, contact nucleation, and immersion freezing), ice multiplication (Hallett-Mossop mechanism), deposition and sublimation of ice, ice-ice and ice-drop interactions (aggregation, accretion and riming), melting of ice particles, and sedimen-tation of both drops and ice particles. All these microphysical processes are formulated and solved using the method of Multi-Moments (Tzivion et al., 1987, 1989, 1999; Reisin
5
et al., 1996).
Three different types of ice are considered: ice crystals, graupel particles and snowflakes (aggregates of ice crystals). Each particle species is divided into 34 bins, with mass doubling for adjacent bins. The mass of the lower boundary of the first bin and the upper boundary of the last bin for both liquid and solid phases are
10
0.1598×10⁻¹³and 0.17468×10⁻³kg, which correspond to drop diameter of 3.125 and 8063 µm, respectively. The CCN spectrum is divided into 57 bins with a minimum radius of 0.0041 µm.
The grid size of the model is set to 300 m in both horizontal and vertical directions (separate numerical tests using grid sizes of 150 and 200 m showed that except for
15
a two-minute delay in the cloud and rain initiation, the development of cloud proper-ties such as liquid water content, maximum updraft, ice content, were similar to those reported in this paper). The width and height of the domain are 30 and 12 km, respec-tively. The time step for all the processes is 5 s except for diffusive growth/evaporation, where a shorter time step of up to 2.5 s is used.
20
3 Numerical experiments
3.1 Initial thermodynamic profiles
In this paper, a single-cell cloud with moderate instability is considered to be represen-tative of one of the growing cells in a convection complex. The tests presented here mainly concentrates on how the heating released from an absorbing aerosol layer
in-25
fluences the microphysical structure of the cloud and development of precipitation. A 3207
ACPD
7, 3203–3228, 2007 Heating effect of mineral aerosols on cloud and precipitationY. Yin and L. Chen
Title Page Abstract Introduction Conclusions References Tables Figures ◭ ◮ ◭ ◮ Back Close
Full Screen / Esc
Printer-friendly Version Interactive Discussion
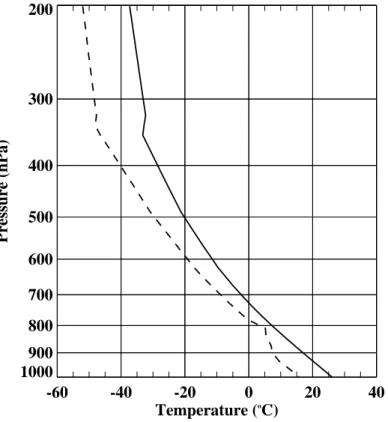
theoretical thermodynamic profile (Fig. 1) which produces a cloud with cloud base at 8–10◦C and top at –25◦C is used to represent the typical initial thermodynamic condi-tions of the clouds (e.g., Cooper and Lawson, 1984; Krauss et al., 1987). In order to initiate the cloud, a temperature perturbation of 2◦
C is applied for one time step at t=0 at a height of 600 m, in the middle of the domain. Therefore the clouds initialized in
5
this study only depend on the instability of the atmosphere, not on the area of the initial disturbance. The possible influence of wind shear is not considered.
3.2 Initial distributions of aerosol particles
The concentrations and size distributions of aerosol particles measured during dust-storm over the Helan Mts. region, northwest China (Niu et al., 2001), are used to
10
initialize the model for a cloud developed over the continent. For comparison, simula-tions with a background aerosol profile, representative of maritime air mass (Jaenicke, 1988), are also carried out. The aerosol particle spectra can be fitted with four and five lognormal distribution functions with the parameters being shown in Table 1.
3.3 Experiments to test aerosol absorbing effect
15
Cheng et al. (2002) investigated the radiative properties of mineral aerosols originated from northwest China. Their results showed that the heating effect of mineral aerosols was most important within the dust layer, with two peak values of net (shortwave plus long-wave) heating rates located close to the top and bottom of the dust layer, re-spectively. In this study, the profiles of the net heating rate obtained by Cheng et
20
al. (2002) are used to represent the typical heating rate resulted from transport of min-eral aerosol. In addition, minmin-eral aerosols interact with other atmospheric pollutants, leading to some of the soluble materials such as sulfate and nitrate, coat at the surface of the mineral particles (e.g., Levin et al., 1996; Zhang et al., 2003). This increases the solubility and scattering efficiency and reduces the absorbing efficiency of the
min-25
ACPD
7, 3203–3228, 2007 Heating effect of mineral aerosols on cloud and precipitationY. Yin and L. Chen
Title Page Abstract Introduction Conclusions References Tables Figures ◭ ◮ ◭ ◮ Back Close
Full Screen / Esc
Printer-friendly Version Interactive Discussion
on the chemical composition of the original particles, but also varies with the time the particles have been suspended in the air, the pollutants they have encountered during transport, and the meteorological conditions under which they are present. In addition, the altitude and the depth of a dust layer may also change with time due to sedimen-tation, dispersion and meteorological conditions. Sensitivity experiments with different
5
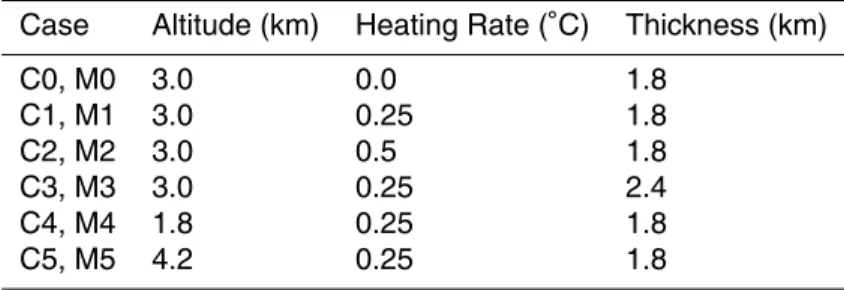
heating rates, altitude and depth of the dust layer are conducted. Table 2 shows the experiments conducted in this study, where C0 and M0 represent, respectively, the continental and maritime cases without absorbing dust layer; C1 (M1) and C2 (M2) represent continental (maritime) cases with different heating rates of 0.25◦C and 0.5◦C, representative of mineral aerosols experienced different aging. The larger value of
10
heating rate is based on the estimate by Cheng et al. (2002) in the dust source region. The real heating effects of mineral dust particles on clouds will therefore be somewhere between the results obtained in C0 (M0) and C2 (M2). Experiments C3 and M3 are continental and maritime cases influenced by a thicker dust layer to reflect dust layers have experienced long-range transport; in cases C4 (M4) and C5 (M5), the effect of
15
changes in the altitudes of dust layer is considered.
4 Results and discussions
4.1 General feature of the reference cases C0 and M0
Figure 2 shows the time evolution of the maximum values of updraft velocity in the reference cases C0 and M0. The time evolution of the maximum updraft velocities is
20
quite similar in both the continental and maritime cases except for the period between 50 and 65 min, during which, the heavier precipitation formed in the maritime case (see Fig. 3) produced a more pronounced downdraft and triggered the development of a secondary cloud on both side of the main convective cell. For the first 28 min an almost constant updraft velocity prevails resulted from the initial impulse. The increase
25
in updraft velocity after that time stems from the onset of condensation and the release 3209
ACPD
7, 3203–3228, 2007 Heating effect of mineral aerosols on cloud and precipitationY. Yin and L. Chen
Title Page Abstract Introduction Conclusions References Tables Figures ◭ ◮ ◭ ◮ Back Close
Full Screen / Esc
Printer-friendly Version Interactive Discussion
of latent heat, with the highest condensation rate at around 45 min (see Fig. 3). The vertical velocity is further enhanced by the latent heat release produced by the onset of ice formation and reached peak development at around 43 min. After 45 min the updraft velocity began to decrease resulted from falling precipitation particles, their mass loading and cooling produced by their evaporation and melting.
5
Cloud droplets start to form after approximately 23 min of modeling time, as can be seen from Fig. 3 which shows the time evolution of the maximum values of water content and number concentration of water droplets, ice crystals and graupel particles in the reference cases C0 and M0. The relatively long time for cloud initialization is related to the small area of initial disturbance as described in the previous section. The
10
cloud base locates at a height between 1.5 and 1.8 km (temperature 8–10◦C) and the top of the fully developed cloud reaches a height between 6.5 and 7.0 km (T ∼-25◦C).
While the maximum liquid water contents (LWC) are similar between the two cases, significant differences exist between the two cases in the time evolution of the other cloud properties. Due to the much higher concentration of aerosol particles, the cloud
15
developed in the continental case (C0) has a much higher droplet concentration than that in the maritime case (M0).
Ice crystal formation started after 34 min of simulation but the concentration re-mained relatively small prior to 40 min (see Fig. 3c, d). After 40 min the concentration of ice crystals increased very rapidly and reached its peak value of 53 l−1around 45 min
20
in the maritime case and 61 l−1 at 51 min in the continental case. Both the ice water content and number concentration of ice crystals in the continental case are higher than that in the maritime case, but the opposite is true for development of graupel particles (Fig. 3e, f) which reached much higher values in the maritime case as com-pared to the continental counterpart. Due to the lower concentration, droplets in the
25
maritime case grew faster and started raindrop formation through collision and coales-cence processes earlier than that in the continental case. This difference in the warm phase microphysics also affected the development of ice particles (see, for example, Yin et al., 2000; Levin et al., 2005). As a result of the differences in development of
ACPD
7, 3203–3228, 2007 Heating effect of mineral aerosols on cloud and precipitationY. Yin and L. Chen
Title Page Abstract Introduction Conclusions References Tables Figures ◭ ◮ ◭ ◮ Back Close
Full Screen / Esc
Printer-friendly Version Interactive Discussion
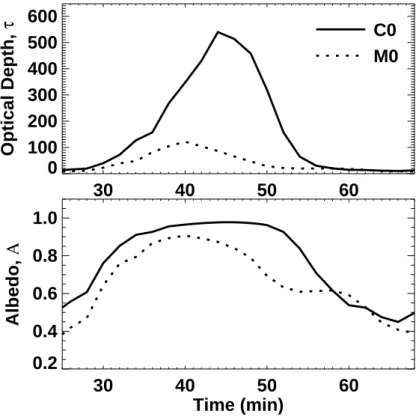
raindrops and graupel particles, the rainfall intensity and precipitation amount on the ground are much larger in the maritime case than in the continental case, whereas the continental case produces a much higher optical depth and albedo, which are shown in Fig. 4, as compared with the maritime case.
4.2 The effect of heating rate of the dust layer
5
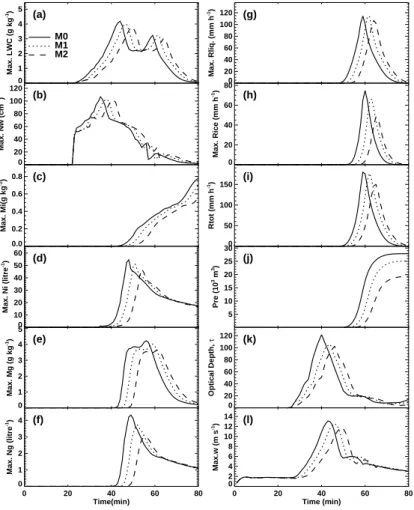
Absorption of shortwave solar radiation by the dust layer leads to heating the atmo-spheric layer where it presents. Figure 5 shows the time evolution of the maximal values of water contents and number concentrations of droplets, ice crystals, graupel particles, liquid- and ice-phase and total rainfall intensity, updraft speed, accumulated precipitation amount on the ground and optical depth of the cloud developed when a
10
dust layer with heating rate of 0.25◦C (C2) and 0.5◦C (C3), respectively, in the conti-nental case. A comparison of case C2 and C3 with the reference case without heating effect from dust (C0), it can be seen that dust-induced heating effect reduces the con-densation efficiencies of hydrometeor, leading to a lower values of liquid water content and number concentrations of cloud droplets. The heating by dust layer also inhibited
15
the development of ice-phase cloud particles (Figs. 5c–f). It is also clear that dust heating postpones the development of both liquid and ice phase precipitation by about 10 min, and also suppresses precipitation amount by about 50% (comparing case C2 and C0). The heating effect of the dust layer also leads to lower optical depth of the cloud due to evaporation of cloud particles. In general, the results obtained here
indi-20
cate that the cloud microphysical structure, optical properties and precipitation all can be more significantly influenced if a strong absorbing dust layer presents, implying that the heating effect of dust layer is more significant close to the source region of the dust particles. These are in consistence with the finding derived from satellite remote sensing (e.g. Huang et al., 2006a, b).
25
Compared to the continental case, the heating effect on maritime clouds due to the presence of a dust layer is less significant (Fig. 6). The cloud and precipitation are postponed by 3 to 6 min when heating rates of 0.25 and 0.5◦C are applied, respectively,
ACPD
7, 3203–3228, 2007 Heating effect of mineral aerosols on cloud and precipitationY. Yin and L. Chen
Title Page Abstract Introduction Conclusions References Tables Figures ◭ ◮ ◭ ◮ Back Close
Full Screen / Esc
Printer-friendly Version Interactive Discussion
and the precipitation amount is reduced by 11% and 28% for these two heating rates.
4.3 Sensitivity to the depth of the dust layer
The depth of the dust layer changes during transport from the source region, due to sedimentation and diffusion of dust particles as well as changes in meteorological con-ditions. Figure 7 shows the specific mass of various hydrometeor particles as a function
5
of altitude and time, for cases of a dust layer located at 3.0 km with depths of 1.8 (case C1) and 2.4 km (case C3), respectively. In both cases the heating rate is 0.25◦C. One can find from this figure that when the depth of the dust layer increases from 1.8 km to 2.4 km, the volume of maximum water content becomes smaller, the peak value ap-pears later, and the persistent time becomes shorter. It is also indicated from this figure
10
(Figs. 7b, c, e, f) even with a heating rate of 0.25◦C, an increase in the depth of the dust layer by 0.6 km may dramatically change the development of ice phase particles and precipitation formation. The specific mass of ice crystals and graupel are reduced by 9 and 20 folds, respectively (compare C3 and C1). These results clearly demonstrate that during transport of dust particles, if the dust layer is thick enough, the heating
ef-15
fect can be dominating and results in different cloud microphysical structure as well as cloud cover. Once again, the effect becomes less pronounced when the similar dust layer present in a marine environment. A comparison of case M3 (with dust layer depth of 2.4 km, not shown here) indicates a decrease in graupel water content by 25% only. 4.4 Sensitivity to the altitude of the dust layer
20
Heating at different height can change the thermodynamic structure of the cloud, per-turbs the microphysical processes of cloud, and may also change the macro-structure of the cloud. This is because that in case with no inverse presence, temperature in clouds usually decreases with height. The presence of a heating layer may change the stability in the cloud and in turn leads to different development of cloud particles and
25
ACPD
7, 3203–3228, 2007 Heating effect of mineral aerosols on cloud and precipitationY. Yin and L. Chen
Title Page Abstract Introduction Conclusions References Tables Figures ◭ ◮ ◭ ◮ Back Close
Full Screen / Esc
Printer-friendly Version Interactive Discussion
of another two cases, C4 and C5, with maximum heating rate located at 1.8 km and 4.2 km, respectively, are compared with that of C1 (3.0 km). It is seen from this figure that hydrometeor developed the earliest in C5 and latest in C4, implying that with the dust layer becoming higher, the heating effect induced by it may accelerate the devel-opment of cloud and precipitation particles. This can even clearly be seen from Fig. 9.
5
It also indicated that heating effect can increase the evaporation efficiency at cloud base, prohibits the conversion of water vapor to condensed water, and therefore, post-pones the production of LWC and droplet concentration. Increase in temperature not only leads to delayed condensation, it also reduces the collision and coalescence ef-ficiency among droplets and reduces precipitation efef-ficiency from both liquid and solid
10
phase particles.
Table 3 shows accumulated precipitation amount on the surface for each case after 80 min of simulation. With increasing of the concentration of absorbing aerosol par-ticles in the atmosphere, the warming effect inside cloud becomes more significant. When dust layer locates at the cloud-base heights, warming-induced evaporation of
15
cloud droplets results in suppression of precipitation; while when the dust layer locates at the heights where ice nucleation is effective, the development of cloud particles and precipitation may be promoted, leading to more precipitation on the ground.
5 Summary and conclusions
The heating effect on cloud and precipitation induced by absorption of solar radiation
20
by transport of mineral aerosols and its sensitivities to the height and depth of the dust layer are discussed. It is found that the heating effect induced by absorbing aerosols varies with the heating rate, which depends on the physical and optical properties of aerosol particles, and height and depth of the dust layer. The possible reasons for these changes are explained based on the microphysical mechanisms operating during the
25
interactions between dust particles and clouds.
When dust layer located below 3 km (∼0◦C) altitude, because the temperature of this 3213
ACPD
7, 3203–3228, 2007 Heating effect of mineral aerosols on cloud and precipitationY. Yin and L. Chen
Title Page Abstract Introduction Conclusions References Tables Figures ◭ ◮ ◭ ◮ Back Close
Full Screen / Esc
Printer-friendly Version Interactive Discussion
level has yet reached that required for ice nucleation, presence of the mineral dust layer may suppress CCN activation and also affect the development of vertical velocity, leading to delayed development of cloud. Absorption of solar radiation and heating by mineral dust reduce the water content and number concentration of cloud particles, and in turn, to a lower optical depth of the cloud. This is in consistence with the findings
5
by Huang et al. (2006b) from retrieval of satellite remote sensing data.
The lower the altitude, the thicker, and with more absorbing components of a dust layer, the stronger of the heating effect is on a cloud. At altitudes with T>–5◦C the presence of a dust layer can lead to less cloud cover, reduces precipitation and optical depth; when the mineral layer is located above the –5◦C level, the dust layer may
10
promote the development of cloud and precipitation.
Acknowledgements. This study was partially funded by the 973 Program of China through
Grant No. 2006CB403706, the National Natural Sciences Foundation of China through Grant No. 40375003 and 40365002, and Jiangsu Key Laboratory of Meteorological Disaster (Nanjing University of Information Science & Technology), China, through Grant No. KLME060209.
15
References
Andreae, M. O., Charlson, R. J., Bruynseels, F., Storms, H., van Grieken, R., and Maenhaut, W.: Internal mixtures of sea salt, silicates and excess sulfate in marine aerosols, Science, 232, 1620–1623, 1986.
Cheng, T. and Shen, Z.: The radiative forcing of atmospheric dust in northwest China, Plateau
20
Meteorology, 21(5), 473–478, 2002.
Cooper, W. A. and Lawson, R. P.: Physical interpretation of results from the HIPLEX-1 experi-ment, J. Climate Appl. Meteorol., 23, 523–540, 1984.
Costa, M. J., Sohn, B. J. , Levizzani, V., and Silva, A. M.: Radiative forcing of Asian dust determined from the synergized GOME and GMS satellite data – A case study, J. Meteorol.
25
Soc. Jpn., 84, 85–95, 2006.
DeMott, P. J., Sassen, K., Poellot, M. R., et al.: African dust aerosols as atmospheric ice nuclei, Geophys. Res. Lett., 30(14), 1732, doi:10.1029/2003GL017410, 2003.
ACPD
7, 3203–3228, 2007 Heating effect of mineral aerosols on cloud and precipitationY. Yin and L. Chen
Title Page Abstract Introduction Conclusions References Tables Figures ◭ ◮ ◭ ◮ Back Close
Full Screen / Esc
Printer-friendly Version Interactive Discussion Huang, J., Minnis, P., Lin, B., et al.: Possible influences of Asian dust aerosols on cloud
prop-erties and radiative forcing observed from MODIS and CERES, Geophys. Res. Lett., 33, L06824, doi:10.1029/2005GL024724, 2006a.
Huang, J., Lin, B., Minnis, P., et al.: Satellite-based assessment of possible dust aerosols semi-direct effect on cloud water path over East Asia, Geophys. Res. Lett., 33, L19802,
5
doi:10.1029/2006GL026561, 2006b.
Intergovernmental Panel on Climate Change (IPCC), World Meteorological Office, United Na-tions Environmental Programme, 2001: Summary for Policymakers.
Jaenicke, R.: Aerosol physics and chemistry, in Ladolt-Boernstein: Zahlenwerte und Funk-tionen aus Naturwissenschaften und Technik, vol. 4b, edited by: Fischer G., 391– 457,
10
Springer-Verlag, New York, 1988.
Krauss, T. W., Bruintjes, R. T., Verlinde, J., and Kahn, A.: Microphysical and radar observations of seeded and unseeded continental cumulus clouds, J. Climate Appl. Meteorol., 26, 585– 606, 1987.
Levin, Z., Ganor, E., and Gladstein, V.: The effects of desert particles coated with sulfate on
15
rain formation in the eastern Mediterranean, J. Appl. Meteorol., 35, 1511–1523, 1996. Levin, Z., Teller, A., Ganor, E., and Yin, Y.: On the interactions of mineral dust, sea salt particles
and clouds – Measurements and modeling study from the MEIDEX campaign, J. Geophys. Res, 110, D20202, doi:10.1029/2005JD005810, 2005.
Lohmann, U. and Diehl, K.: Sensitivity Studies of the Importance of Dust Ice Nuclei for the
20
Indirect Aerosol Effect on Stratiform Mixed-Phase Clouds, J. Atmos. Sci, 63, 968–982, 2006. Niu, S., Zhang, C., and Sun, J.: A observational study of the particle spectra of dust aerosol
over the Helan Mts. Region, Chinese J. Atmos. Sci., 25(2), 243–252, 2001.
Prospero, J. M.: Long range transport of mineral dust in the global atmosphere: Impact of African dust on the environment of the southeastern United States, Proc. Nat. Acad. Sci.,
25
96, 3396–3403, 1999.
Pruppacher, H. R. and Klett, J. D.: Microphysics of Clouds and Precipitation, D.Reidel, 714pp, 1997.
Reisin, T., Levin, Z., and Tzivion, S.: Rain production in convective clouds as simulated in an axisymmetric model with detailed microphysics. Part I: Description of the model, J. Atmos.
30
Sci., 53, 497–519, 1996.
Rosenfeld, D., Rudich, Y., and Lahav, R.: Desert dust suppressing precipitation: A possible desertification feedback loop, Proc. Natl. Acad. Sci. U. S. A., 98(11), 5975–5980, 2001.
ACPD
7, 3203–3228, 2007 Heating effect of mineral aerosols on cloud and precipitationY. Yin and L. Chen
Title Page Abstract Introduction Conclusions References Tables Figures ◭ ◮ ◭ ◮ Back Close
Full Screen / Esc
Printer-friendly Version Interactive Discussion Rudich ,Y., Khersonsky, O., and Rosenfeld, D.: Treating clouds with a grain of salt, Geophys.
Res. Lett., 29(22), 2060, doi:10.1029/2002GL016055, 2002.
Trochkine D., Iwasaka, Y., Matsuki, A., et al.: Mineral aerosol particles collected in Dunhuang, China, and their comparison with chemically modified particles collected over Japan, J. Geo-phys. Res., 108(D23), 8642, doi:10.1029/2002JD003268, 2003.
5
Tzivion, S., Feingold, G., and Levin, Z.: A efficient numerical solution to the stochastic collection equation, J. Atmos. Sci., 44, 3139–3149, 1987.
Tzivion, S., Feingold, G., and Levin, Z.: The evolution of raindrop spectra. Part II: Collisional collection/breakup and evaporation in a rainshaft, J. Atmos. Sci., 46, 3312–3327, 1989. Tzivion, S., Reisin, T., and Levin, Z.: A numerical solution of the kinetic collection equation
10
using high spectral grid resolution: A proposed reference, J. Comput. Phys., 148, 527–544, 1999.
Wurzler, S., Reisin, T. G., and Levin, Z.: Modification of mineral dust particles by cloud pro-cessing and subsequent effects on drop size distributions, J. Geophys. Res., 105(D4), 4501– 4512, 2000.
15
Yin, Y., Levin, Z., Reisin, T. G., et al.: The effect of giant cloud condensation nuclei on the development of precipitation in convective clouds – A numerical study, Atmos. Res., 53, 91– 116, 2000.
Yin, Y., Wurzler, S., Levin, Z. et al.: Effects on precipitation and cloud optical properties, J. Geophys. Res., 107(D23), 4724, doi:10.1029/2001JD001544, 2002.
20
Zhang, X. Y., Gong, S. L., Shen, Z. X., et al.: Characterization of soil dust aerosol in China and its transport and distribution during 2001 ACE-Asia: 1. Network observations, J. Geophys. Res., 108(D9), 4261, doi:10.1029/2002JD002632, 2003.
Zhao, T. L., Gong, S. L., Zhang, X. Y., and McKendry, I. G.: Modeled size-segregated wet and dry deposition budgets of soil dust aerosol during ACE-Asia 2001: Implications for
trans-25
ACPD
7, 3203–3228, 2007 Heating effect of mineral aerosols on cloud and precipitationY. Yin and L. Chen
Title Page Abstract Introduction Conclusions References Tables Figures ◭ ◮ ◭ ◮ Back Close
Full Screen / Esc
Printer-friendly Version Interactive Discussion
Table 1. Parameters of the aerosol particle distributions.
Mode i ni Ri logσi Continental 1 40 000 0.006 0.30 with dust 2 3930 0.03 0.30 3 15 0.45 0.15 4 80 0.90 0.20 Maritime 1 133 0.0039 0.657 with dust 2 66.6 0.133 0.21 3 3.06 0.29 0.396 4 80 0.90 0.20 3217
ACPD
7, 3203–3228, 2007 Heating effect of mineral aerosols on cloud and precipitationY. Yin and L. Chen
Title Page Abstract Introduction Conclusions References Tables Figures ◭ ◮ ◭ ◮ Back Close
Full Screen / Esc
Printer-friendly Version Interactive Discussion
Table 2. Cases for sensitivity run.
Case Altitude (km) Heating Rate (◦C) Thickness (km)
C0, M0 3.0 0.0 1.8 C1, M1 3.0 0.25 1.8 C2, M2 3.0 0.5 1.8 C3, M3 3.0 0.25 2.4 C4, M4 1.8 0.25 1.8 C5, M5 4.2 0.25 1.8
ACPD
7, 3203–3228, 2007 Heating effect of mineral aerosols on cloud and precipitationY. Yin and L. Chen
Title Page Abstract Introduction Conclusions References Tables Figures ◭ ◮ ◭ ◮ Back Close
Full Screen / Esc
Printer-friendly Version Interactive Discussion
Table 3. Integrated precipitation amount on the ground.
case Prec. Amount (m3) Case Prec. amount (103m3)
C0 3,127 M0 27.88 C1 2,578 M1 25.03 C2 1,672 M2 19.11 C3 62 M3 12.02 C4 1,718 M4 26.29 C5 3,248 M5 27.53 3219
ACPD
7, 3203–3228, 2007 Heating effect of mineral aerosols on cloud and precipitationY. Yin and L. Chen
Title Page Abstract Introduction Conclusions References Tables Figures ◭ ◮ ◭ ◮ Back Close
Full Screen / Esc
Printer-friendly Version Interactive Discussion -60 -40 -20 0 20 40 Temperature (o C) 1000 900 800 700 600 500 400 300 200 Pressure (hPa)
Fig. 1. Initial vertical profiles of temperature (solid line) and dew point temperature (dashed
ACPD
7, 3203–3228, 2007 Heating effect of mineral aerosols on cloud and precipitationY. Yin and L. Chen
Title Page Abstract Introduction Conclusions References Tables Figures ◭ ◮ ◭ ◮ Back Close
Full Screen / Esc
Printer-friendly Version Interactive Discussion 0 20 40 60 80 Time (min) 0 2 4 6 8 10 12 14 Max.w (m s -1 )
C0
M0
Fig. 2. Time evolution of the maximum vertical velocity in the reference cases C0 and M0 (refer
the text for definition of the cases).
ACPD
7, 3203–3228, 2007 Heating effect of mineral aerosols on cloud and precipitationY. Yin and L. Chen
Title Page Abstract Introduction Conclusions References Tables Figures ◭ ◮ ◭ ◮ Back Close
Full Screen / Esc
Printer-friendly Version Interactive Discussion 0 1 2 3 4 5 Max. LWC (g kg -1) C0 M0 (a) 0 200 400 600 800 Max. Nw (cm -3) (b) 0.0 0.2 0.4 0.6 0.8 1.0 Max. Mi(g kg -1) (c) 0 20 40 60 Max. Ni (litre -1) (d) 0 20 40 60 80 Time(min) 0 1 2 3 4 5 Max. Mg (g kg -1) (e) 0 20 40 60 80 Time(min) 0 1 2 3 4 Max. Ng (litre -1) (f)
Fig. 3. The peak values of the number concentration and specific mass of drops, ice crystals,
ACPD
7, 3203–3228, 2007 Heating effect of mineral aerosols on cloud and precipitationY. Yin and L. Chen
Title Page Abstract Introduction Conclusions References Tables Figures ◭ ◮ ◭ ◮ Back Close
Full Screen / Esc
Printer-friendly Version Interactive Discussion
30
40
50
60
0
100
200
300
400
500
600
Optical Depth,
τ
C0
M0
30
40
50
60
Time (min)
0.2
0.4
0.6
0.8
1.0
Albedo,
Α
Fig. 4. Variation with time of the optical depth and albedo of cases C0 and M0.
ACPD
7, 3203–3228, 2007 Heating effect of mineral aerosols on cloud and precipitationY. Yin and L. Chen
Title Page Abstract Introduction Conclusions References Tables Figures ◭ ◮ ◭ ◮ Back Close
Full Screen / Esc
Printer-friendly Version Interactive Discussion 0 1 2 3 4 5 Max. LWC (g kg -1) C0 C1 C2 (a) 0 200 400 600 800 Max. Nw (cm -3) (b) 0.2 0.4 0.6 0.8 1.0 Max. Mi(g kg -1) (c) 0 20 40 60 Max. Ni (litre -1) (d) 0.0 0.5 1.0 1.5 Max. Mg (g kg -1) (e) 0 20 40 60 80 Time(min) 0.0 0.5 1.0 1.5 2.0 2.5 Max. Ng (litre -1) (f) 0 20 40 60 80 Time (min) 0 2 4 6 8 10 12 14 Max.w (m s -1) (l) 100 200 300 400 500 Optical Depth, τ (k) 2 4 6 8 10 Max. Rliq. (mm h -1) (g) 0.1 0.2 0.3 0.4 0.5 0.6 Max. Rice (mm h -1) (h) 2 4 6 8 10 Rtot (mm h -1) (i) 0.5 1.0 1.5 2.0 2.5 3.0 Pre (10 3 m 3) (j)
Fig. 5. Time evolution of maximum values of (a) liquid water content , (b) number
concentra-tions of drops, (c) water content of ice crystals, (d) number concentraconcentra-tions of ice crystals, (e) water content of graupel particles, (f) number concentration of graupel particles, precipitation rate from (g) liquid phase, (h) ice phase, and (i) the total condensate, (j) the integrated precipi-tation amount on the ground, (k) the cloud optical depth, and (l) the maximum vertical velocity, at the main updraft core for different heating rate in the continental cloud.
ACPD
7, 3203–3228, 2007 Heating effect of mineral aerosols on cloud and precipitationY. Yin and L. Chen
Title Page Abstract Introduction Conclusions References Tables Figures ◭ ◮ ◭ ◮ Back Close
Full Screen / Esc
Printer-friendly Version Interactive Discussion 0 1 2 3 4 5 Max. LWC (g kg -1) M0 M1 M2 (a) 0 20 40 60 80 100 120 Max. Nw (cm -3) (b) 0.0 0.2 0.4 0.6 0.8 Max. Mi(g kg -1) (c) 0 10 20 30 40 50 60 Max. Ni (litre -1) (d) 0 1 2 3 4 5 Max. Mg (g kg -1) (e) 0 20 40 60 80 Time(min) 0 1 2 3 4 Max. Ng (litre -1) (f) 0 20 40 60 80 Time (min) 0 2 4 6 8 10 12 14 Max.w (m s -1) (l) 0 20 40 60 80 100 120 Optical Depth, τ (k) 0 20 40 60 80 100 120 Max. Rliq. (mm h -1) (g) 0 20 40 60 80 Max. Rice (mm h -1) (h) 0 50 100 150 Rtot (mm h -1) (i) 5 10 15 20 25 30 Pre (10 3 m 3) (j)
Fig. 6. Similar as in Fig. 5, but for the maritime cloud.
ACPD
7, 3203–3228, 2007 Heating effect of mineral aerosols on cloud and precipitationY. Yin and L. Chen
Title Page Abstract Introduction Conclusions References Tables Figures ◭ ◮ ◭ ◮ Back Close
Full Screen / Esc
Printer-friendly Version Interactive Discussion 0 20 40 60 80 0 2 4 6 8 10 12 Height(km) 0.010.10 1.002.00 3.00 Drop Max= 4.01 g kg-1 C1 (a) 0 20 40 60 80 0 2 4 6 8 10 12 0.01 0.10
Ice Cry. Max= 0.81 g kg-1
C1 (b) 0 20 40 60 80 0 2 4 6 8 10 12 0.01 0.01 0.10 1.00 Groupel Max=1.33 g kg-1 C1 (c) 0 20 40 60 80 Time(min) 0 2 4 6 8 10 12 Height(km) 0.01 0.10 1.00 2.00 Drop Max= 2.43 g kg-1 C3 (d) 0 20 40 60 80 Time(min) 0 2 4 6 8 10 12 0.01
Ice Cry. Max= 0.09 g kg-1
C3 (e) 0 20 40 60 80 Time(min) 0 2 4 6 8 10 12 0.01 Groupel Max=0.07 g kg-1 C3 (f)
Fig. 7. The specific masses of drops, ice crystals, and graupel particles, at the main updraft
ACPD
7, 3203–3228, 2007 Heating effect of mineral aerosols on cloud and precipitationY. Yin and L. Chen
Title Page Abstract Introduction Conclusions References Tables Figures ◭ ◮ ◭ ◮ Back Close
Full Screen / Esc
Printer-friendly Version Interactive Discussion 1 102 104 10-6 10-4 10-2 100 dM/dD (g kg -1 µ m -1) Drop 44 min X: 15. km H: 4.2 km C1 C4 C5 1 102 104 10-6 10-4 10-2 100 Ice Cry. 52 min X: 15. km H: 6.0 km 1 102 104 10-6 10-4 10-2 100 Groupel 60 min X: 15. km H: 4.2 km 1 102 104 Diameter (µm) 10-6 10-4 10-2 100 102 dN/dD (cm -3 µ m -1) 1 102 104 Diameter (µm) 10-6 10-4 10-2 100 102 1 102 104 Diameter (µm) 10-6 10-4 10-2 100 102
Fig. 8. Size distribution functions of drops, ice crystals, and graupel particles at selected times
and locations in cases C1, C4 and C5.
ACPD
7, 3203–3228, 2007 Heating effect of mineral aerosols on cloud and precipitationY. Yin and L. Chen
Title Page Abstract Introduction Conclusions References Tables Figures ◭ ◮ ◭ ◮ Back Close
Full Screen / Esc
Printer-friendly Version Interactive Discussion 40 50 60 70 80 0 2 4 6 8 10
Max. Precip. Rate from Liquid-phase (mm h
-1 ) C1 C4 C5 40 50 60 70 80 Time (min) 0.0 0.1 0.2 0.3 0.4 0.5 0.6
Max. Precip. Rate from Ice-phase (mm h
-1) 40 50 60 70 80 0 2 4 6 8 10 12
Total Precip. Rate (mm h
-1) 40 50 60 70 Time (min) 0 1 2 3 Precip. Amount (10 3 m 3 )
Fig. 9. Time evolution of precipitation rate from liquid phase, ice phase, and the total
con-densate, as well as the integrated precipitation amount on the ground, in case C1, C4 and C5.