HAL Id: emse-00714703
https://hal-emse.ccsd.cnrs.fr/emse-00714703
Submitted on 5 Jul 2012HAL is a multi-disciplinary open access archive for the deposit and dissemination of sci-entific research documents, whether they are pub-lished or not. The documents may come from teaching and research institutions in France or abroad, or from public or private research centers.
L’archive ouverte pluridisciplinaire HAL, est destinée au dépôt et à la diffusion de documents scientifiques de niveau recherche, publiés ou non, émanant des établissements d’enseignement et de recherche français ou étrangers, des laboratoires publics ou privés.
The impact of an uranium mining site on the stream
sediments (Crucia mine, Romania)
Lucian Petrescu, Essaïd Bilal, Luisa Iatan
To cite this version:
Lucian Petrescu, Essaïd Bilal, Luisa Iatan. The impact of an uranium mining site on the stream sediments (Crucia mine, Romania). XIX Congress of the Carpathian Balkan Geological Association, Thessalonique, Grèce, 23 au 26 septembre 2010, Sep 2010, Thessalonique, Greece. �emse-00714703�
Scientific Annals, School of Geology, Aristotle University of Thessaloniki
Proceedings of the XIX CBGA Congress, Thessaloniki, Greece Special volume 100 121-126
Thessaloniki 2010
THE IMPACT OF A URANIUM MINING SITE ON THE STREAM
SEDIMENTS (CRUCEA MINE, ROMANIA)
Petrescu L. 1, Bilal E. 2, Iatan L.E. 1
1
University of Bucharest, Faculty of Geology et Geophysics, Department of Mineralogy, 1 N.Balcescu Ave., 010041 Bucharest,
Romania; [email protected]
2
Ecole Nationale Supérieure des Mines, Département GENERIC, 158 cours Fauriel, 42023 Saint Etienne, France;[email protected] Abstract: XRF methods were used to evaluate the impact of uranium mine dumps on the stream
sedi-ments from Crucea region (Romania). In order to estimate the natural and anthropogenic inputs of ra-dioactive and heavy metals in the sediments, normalization to Al was applied. The pollution degree of the bottom sediments show that U, Th and Pb reach medium and punctual high values, while the rest of the elements appears in concentrations close to the background or lower. The measurements carried out in the surroundings of a local uranium mine show that the impact of Crucea mine on water quality downstream of mining area is insignificant.
Keywords: impact of mine wastes, stream sediments, uranium, thorium
1. Introduction
Uranium and thorium are omnipresent in our hu-man environment. Various anthropogenic activities involving the processing or use of uranium rich-materials in may modify the natural abundance of uranium in stream sediments. These activities in-clude various mining operations and the industrial processing for the manufacturing of nuclear fuel and of other products.
Between 1962 and 2004, the National Company of Uranium (former Romanian Autonomous Admini-stration for Rare Metals), mined over 1,200,000 tones of pitchblende ore in the East Carpathians. Traditional mining methods rely on the relocation of large volumes of mineralized and waste rock. These intensive mining operations have created over 30 solid radioactive mining wastes in Crucea-Botusana area (Bistrita Mountains).
In this paper we present data from four main tribu-taries of Bistrita River (i.e. Crucea, Troaca Gava-nului, Gavan and Cracul Rau creeks) and from two sampling points locating in the upper course of this main stream (one point located downstream and the other located upstream of the confluence with Crucea creek). The aim of this paper is to investi-gate the impact of mining activities on the stream sediments in the area.
2. The study area 2.1. Geography
The study concerns the uranium mineralization lo-cated within Crucea ore deposit, in the East Carpa-thians, Romania. The uranium ore deposit found in the eastern part of the Bistrita Mountains (40 km southeast of the town of Vatra Dornei) in the headwaters of Crucea, Lesu and Livezi valleys. At present, this is the largest uranium mine in the country. In the past, the mining area covered 18 km2, but was gradually overtaken by logging ac-tivities.The area has a steep mountainous relief cut by narrow valleys. The surface streams are tribu-taries of Bistrita River.
2.2. Geological background
The host rocks belong to the Crystalline-Mesozoic zone of the northern part of the East Carpathians. The uranium mineralization is confined to a body of brecciated retrometamorphic micaschists, con-taining carbonates and clay minerals. The richest uranium mineralization is associated with four NW-SE faults with E or W strike. Most mineral-ized areas occur along fractures, thus denoting a significant structural control over the emplacement of the ore-bodies. Uranium ore bodies form dark-grey lenses or veinlets with thicknesses ranging from decimetres to meters. Primary mineralization consists of pitchblende U3O8 included in bitumen.
The intimate association between pitchblende and bitumen is characteristic to this uranium ore de-posit. The sulphide content is lower than 10% and consists of pyrite, marcasite, chalcopyrite, and mi-nor galena, sphalerite, arsenopyrite and tetrahedrite in a carbonate gangue. The mineralization is con-sidered to be of hydrothermal origin (Petrescu, 2004).
The geochemical background of uranium in the surrounding area is lower than 3-mg·g-1, whereas in the mining area, it reaches 5.39-mg·g-1 in the waste rocks (rocks with sub-economic mineraliza-tion) and 7.26-mg·g-1 in soils (Petrescu and Bilal, 2007).
The exploration and mining works include thirty-two adits, situated between 780 and 1040 m above sea level. Radioactive waste resulted from mining are disposed next to the mining facilities (Petrescu and Bilal, 2007). The waste rock was disposed in piles of variable sizes that are spread over an area of 364,000 m2. The average geochemical content of the waste rocks is similar to that of the ore. The average particle size of the waste material is large (>5 cm). Older dumps (18) have been already natu-rally reclaimed by forest vegetation, which played an important role in stabilizing the waste dump cover and in slowing down the uranium migration processes.
3. Material and methods
The sediment samples were collected at seventeen sampling points (e.g. 1, 3, 6, 11, 16, 19, 23, 25, 27, 29, 32, 33, 35, 41, 43 and 45) (Fig.1) from the bot-tom of the stream waters. To ensure the representa-tivity of samples, bulk sediments were obtained by mixture of several cores collected. The pool of se-diments were collected by manual coring (0–5-cm) from the moist shore and stored in glass jars. They were dried in an oven at 50°C for 48 hr, ground us-ing an agate grinder to pass a 100-μm sieve and analyzed for the following:
3.1. Total elemental concentration
The total metal concentrations of bottom sediments were determined using a SRS3400 Bruker AXS wavelength dispersive X-Ray fluorescence spec-trometer (WD-XRF). Thus, 1.3-gram of calcinated powder was added to 1.3-g of oxides (lithium ni-trate) and 6.5-g of flux (lithium tetraborate 20%, li-thium metaborate 80 %) and then mixed in a cruci-ble that is placed in an automated fusion-fluxing device. The fusion is performed at 1100°C. The
cooling is forced to avoid crystallization, and then fused beads with a vitreous, homogeneous struc-ture and flat surface were obtained. The detection limits, in mg·g-1, were: 4 for U, 5 for Th, 5 for Pb and 10 for V.
3.2. Statistical data analysis
The reliability of the chemical analyses was calcu-lated from the four duplicate samples with the analysis of variance. The F-ratio, which is a meas-ure of the ratio of total data variance to error va-riance (sample inhomogeneity, analytical error) and which has to be > 4 to be significantly high at the 99% level of confidence, was >1000 for Ca, Cr, Cu, Mn, Pb, V, Na and Zn, >100 for U, Th, Sr, Al, Co, Fe, K, P and Mg and 54 and 32 for Si and Ni respectively. Hence, any pattern or absence of pattern of any of these elements in the data set is not due to analytical or sampling error.
Single correlation analysis was performed to assess relationship among heavy elements concentration. Linear correlation coefficients (r) were calculated between the different samples parameters. For each correlation, statistical significance (p-value) was determined. Traditionally, results that yield p-value < 0.05 are considered borderline statistically significant, i.e. the probability of concluding that two variable are different when they are actually the same is ≤5%.
The STATISTICA 7.1 for Windows (StatSoft®) program was used for the statistical analyses men-tioned above.
4. Results and discussion
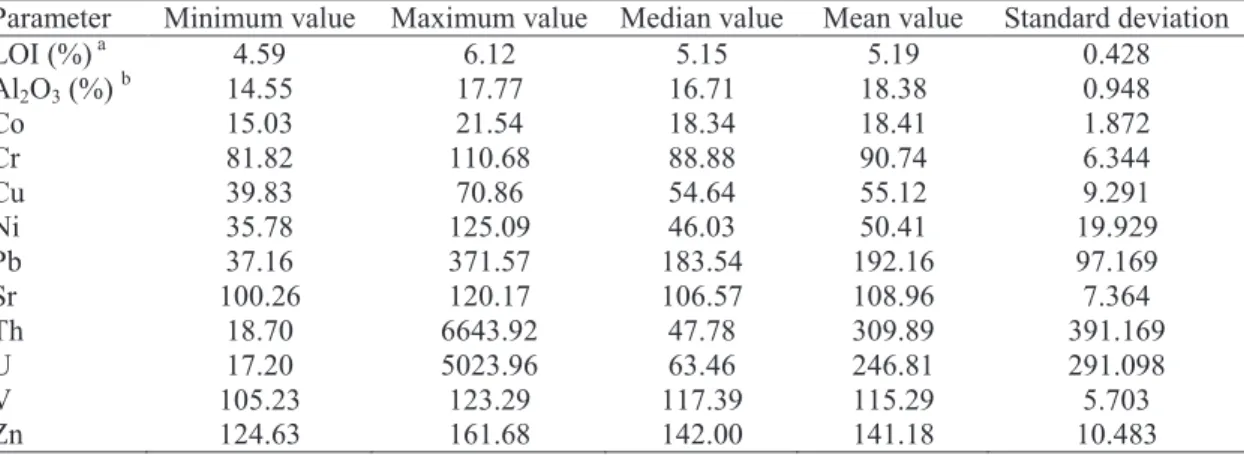
Table 1 shows levels of heavy metals, aluminum oxides and total organic matter (lost on ignition = LOI) found in bottom sediments sampled at the sixteen stations.
In all the areas, similar variations in the concentra-tions of uranium and thorium in sediment samples were observed. The bottom sediment samples col-lected from mining area show a wide range of total uranium content from 17.20 to 5023.96-mg·g-1 with a mean value of 246.81-mg·g-1 (dry wt.) (Fig.2). Total thorium concentration in sediments collected from Crucea site ranged from 18.70 to 6643.92-mg·g-1 with an average of 391.17-mg·g-1 (dry wt.) (Fig.2). This indicates that the adsorption of the radioactive elements by the sediments is high and variable, influenced by the ore dump – sample relationship. There is a decrease in the
con-centrations of U and Th in the stream sediments downstream from the Crucea uranium ore (Fig.2). The fate and transport of uranium is governed by its oxidation state, which is either hexavalent (U(VI)) or tetravalent (U(IV)). When mine wastes containing low-grade uranium mineralization are exposed to surface waters containing carbonate ions, the pitchblende is altered, uranium (IV) oxi-dizing to uranyl carbonates, without producing any megascopically observable changes. This can be il-lustrated by the following equation:
U3O8 + 2H2O + 9 CO32- → 3[UO2(CO3)3]4- + 4OH + 2e
-A previous study performed in this area (Petrescu and Bilal, 2006) showed that in the pH range of waters from Crucea area, more than 85% of the uranium was present as the carbonate complexes UO2(CO3)22-, UO2CO3(OH)3-, UO2CO3 and
UO2(CO3)34- and 17% as the hydroxide complexes
UO2(OH)2. The anionic carbonate complexes are
extremely important because they increase ura-nium mobility by limiting the extent of uraura-nium adsorption in oxidized waters and by increasing the solubility of uranium minerals (Langmuir, 1997). Strong correlation of uranium with thorium in the sediments (r = 1; n = 17; p < 0.0001) suggests that unspecific co-precipitation dominates over selec-tive adsorption according to valence and ion siz-ing.
The lack of correlation between uranium and va-nadium in sediments samples (r = 0.16; n = 17; p < 0.0001) is related to ore type. In the Crucea ura-nium mineralization the vanadium concentration range between 60.7 – 335.9-mg·g-1 and we can state that the surrounding rocks are the source of
this element. This affirmation confirms the absence of the uranium minerals with vanadium (such as carnotite). Through the weathering of the rocks, vanadium migrates as vanadic acid and in super-gene conditions this metal easily concentrates in clay minerals and oxy-hydroxides.
In order to estimate the natural and anthropogenic
inputs of actinides and heavy metals into sedi-ments, their total concentrations were correlated with Al concentration. Since Al originated from the natural background it was chosen as the norma-lizing factor. These data are presented in Table 2. It can be seen that only vanadium shown a linear
relationship with the concentration of Al, fact indi-cates his natural background origin. For the rest of selected elements their origin was anthropogenic. This indicates the impact of mining waste disposal on the environment.
The total concentrations shown in Table 1 have been used for the determination of the degree of
pollution with radioactive and heavy metals. At this time, no regulations exist for levels of heavy metals in sediments; however several sets of sedi-ment quality criteria have been reported. Thus, the pollution degree of the sediments was classified using the geo-accumulation index (Igeo), which is
Table 1. Statistics of parameters for bottom sediments samples (n = 17) collected in Crucea region (mil-ligrams per gram mg·g-1 except LOI a and Al2O3 b).
Parameter Minimum value Maximum value Median value Mean value Standard deviation
LOI (%) a 4.59 6.12 5.15 5.19 0.428 Al2O3 (%) b 14.55 17.77 16.71 18.38 0.948 Co 15.03 21.54 18.34 18.41 1.872 Cr 81.82 110.68 88.88 90.74 6.344 Cu 39.83 70.86 54.64 55.12 9.291 Ni 35.78 125.09 46.03 50.41 19.929 Pb 37.16 371.57 183.54 192.16 97.169 Sr 100.26 120.17 106.57 108.96 7.364 Th 18.70 6643.92 47.78 309.89 391.169 U 17.20 5023.96 63.46 246.81 291.098 V 105.23 123.29 117.39 115.29 5.703 Zn 124.63 161.68 142.00 141.18 10.483
Table 2. Relationships between selected elements and aluminum in bottom sediments from Crucea area (p < 0.001).
Element Co Cr Cu Ni Pb Sr Th U V Zn
r (for 4 degrees of freedom) 0.54 0.54 0.50 0.18 (-)0.23 0.17 0.13 (-)0.24 0.97 (-)0.08
P 1 P 3 P 6 P 9 P 1 1 P 1 6 P 1 9 P 2 3 P 2 5 P 2 7 P 2 9 P 3 2 P 3 3 P 3 5 P 4 1 P 4 3 P 4 5 S a mple 0 1 0 0 0 2 0 0 0 3 0 0 0 4 0 0 0 5 0 0 0 6 0 0 0 7 0 0 0 C o n ce n tr a ti o n ( m g /g ) U Th M e a n ; W h is k e r: M e a n ± 0 . 9 5 C o n f. In t e rva l
Fig. 2. Variations in actinide concentrations in bottom sediments along Crucea zone. For location of sampling sites see Fig. 1.
applied for separate element characteristic in the examined sediments and determines the contribution of each element to overall sediment contamination. Igeo was calculated as follows:
Igeo = log2 [Cn/(1.5Bn)] (Pinto et al., 2004),
were: Cn = total element concentration (mg·g-1);
Bn = background concentration for each element
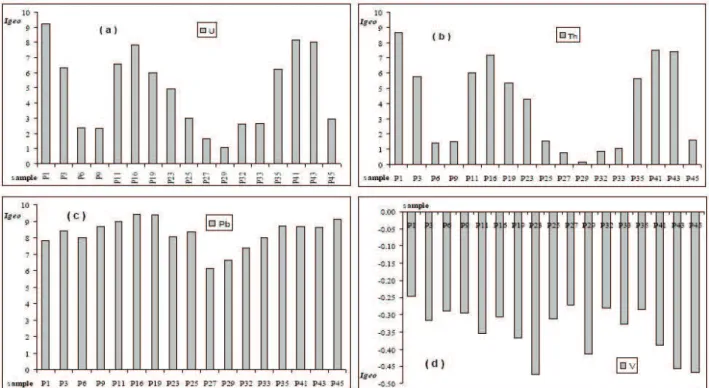
(mg·g-1).Therefore, based on the concentration le-vels of these metals, the stream sediments are cate-gorized into seven classes, with the “0” class cor-responding to the values close to the geochemical background. The background concentrations were taken from Petrescu and Bilal (2007)(Table 3). The pollution degree of the bottom sediments is shown in Table 4. The Igeo of U, Th and Pb
presents medium and punctual high values that represent sediments belonging to classes of strong to extreme pollution (Igeo > 6). A proportion of
47.05% of Th and U concentration values are cate-gorized into the highest pollution class (Igeo class 6)
(Fig.3,a,b), while the rest of the elements presents concentration close to the background values or
lowers (Fig.3,d). These high concentrations of U, Th and Pb are distributed preferentially in the proximities of 5, 8, 9 and 1bis mine dumps. Table 4 also shows that Igeo of U and Th from the
sedi-ments taken from downstream of the mineralized zone (P27 and P29) are lower than those taken from the mineralized areas. This indicates that ura-nium and thorium are not very mobile in the waters and that these elements are precipitated close to the mining dumps.
5. Conclusions
The knowledge concerning uranium and thorium concentration in stream sediments is essential for predicting natural actinide migration and for draft-ing strategies concerned with the rehabilitation of contaminated sites.
The pollution degree of the bottom sediments shows that U, Th and Pb are characterized by medium and punctual high values, while the rest of the elements are in concentration close to the background values or lower.
Table 3. The background level (mg·g-1) for selected elements (Petrescu and Bilal, 2007). Element Background level (mg·g-1) Element Background level (mg·g-1)
Cu 13.63 Pb 0.36
Th 10.87 Co 14.36
Sr 107.66 Ni 19.30
U 5.39 Cr 73.58
Zn 66.38 V 97.44
Although neither U nor Th have an appreciable “exchangeable” fraction, the isolation of specific U- and Th-rich sediment fractions helped to identi-fy connections between bioavailability and genesis of sediments, which control the natural cycling of U and Th. However, if the geochemical conditions it happens to be changes, the surface sediments could act as a future source of actinides and heavy metals to the above water body.
The measurements carried out in the surroundings of a local uranium mine show that the impact of Crucea mine on sediment quality downstream of mining area is insignificant.
Acknowledgements
This work was supported by MIRA Project 050094501 of the Rhone-Alpes Region (France). The inorganic chemical components were deter-mined at Département GENERIC of the Ecole Na-tionale Supérieure des Mines, Saint Etienne (France). The authors thank Dr. Jacques Moutte and Frederic Gallice for technical assistance. Thanks are due to Dr. G. Ilinca (University of Bu-charest) for the reading of the manuscript and for the helpful suggestions. Also, we would like to thank anonymous reviewers for their constructive inputs.
References
Langmuir D., 1997. Aqueous environmental chemistry. Prentice Hall, Upper Saddle River, New Jersey, 600 pp.
Petrescu L., 2004. The impact of the environment of the uranium mine dumps from Crucea and Botusana ore deposit (Bistritei Mountains, Romania): PhD thesis, Department of Mineralogy, University of Bucharest, 196 p. (in Romanian with English abstract).
Petrescu L., Bilal E., 2006. Speciation of natural nium and thorium in surface waters around a ura-nium mine (Bistrita Mts., Romania). Geochimica et Cosmochimica Acta, vol. 70, issue 18, supplement 1, pp. A486
Petrescu L., Bilal E., 2007. Environmental impact as-sesment of a uranium mine, East Carpathians, Ro-mania: Metal distribution and partitioning of U and Th. Carpathian Journal of Earth and Environmental Sciences, vol. 2/1, pp. 39-50.
Pinto M.M.S.C., Silva M.M.V.G., Neiva A.M.R., 2004. Pollution of water and stream sediments associated with the Vale De Abrutiga Uranium Mine, Central Portugal. Mine, Water and the Environment, v. 23, pp. 66-75.
Table 4. The geo-acumulation index in bottom sediments for selected elements. Sample Cu Th Sr U Zn Pb Co Ni Cr V S1 1.76 8.67 -0.66 9.28 0.63 7.84 -0.05 0.35 -0.21 -0.25 S3 1.31 5.76 -0.60 6.37 0.39 8.42 -0.10 0.67 -0.34 -0.32 S6 0.96 1.42 -0.50 2.41 0.44 7.99 -0.22 2.11 0.00 -0.29 S9 1.50 1.52 -0.55 2.37 0.56 8.70 -0.13 0.80 -0.31 -0.29 S11 1.00 5.99 -0.67 6.60 0.50 9.00 0.00 0.83 -0.34 -0.36 S16 1.63 7.19 -0.60 7.82 0.70 9.44 -0.29 0.75 -0.23 -0.31 S19 1.42 5.39 -0.68 6.00 0.52 9.42 -0.13 0.93 -0.23 -0.37 S23 0.99 4.30 -0.67 4.95 0.39 8.02 -0.52 0.54 -0.43 -0.47 S25 1.79 1.55 -0.44 2.98 0.51 8.35 -0.20 0.84 -0.22 -0.31 S27 1.37 0.78 -0.49 1.68 0.32 6.12 -0.27 0.58 -0.34 -0.27 S29 1.31 0.20 -0.51 1.09 0.38 6.65 -0.46 0.31 -0.34 -0.41 S32 1.49 0.87 -0.43 2.61 0.39 7.37 0.00 0.60 -0.25 -0.28 S33 1.60 1.11 -0.44 2.69 0.45 8.01 -0.24 0.66 -0.28 -0.33 S35 1.66 5.62 -0.48 6.28 0.52 8.73 -0.26 0.69 -0.32 -0.28 S41 1.50 7.53 -0.67 8.15 0.60 8.70 0.00 0.52 -0.31 -0.39 S43 1.32 7.42 -0.69 8.04 0.56 8.64 0.00 0.57 -0.33 -0.46 S45 1.38 1.61 -0.63 2.97 0.64 9.10 -0.39 0.77 -0.37 -0.47