HAL Id: inserm-02019336
https://www.hal.inserm.fr/inserm-02019336
Submitted on 14 Feb 2019
HAL is a multi-disciplinary open access
archive for the deposit and dissemination of
sci-entific research documents, whether they are
pub-lished or not. The documents may come from
teaching and research institutions in France or
abroad, or from public or private research centers.
L’archive ouverte pluridisciplinaire HAL, est
destinée au dépôt et à la diffusion de documents
scientifiques de niveau recherche, publiés ou non,
émanant des établissements d’enseignement et de
recherche français ou étrangers, des laboratoires
publics ou privés.
Impact of body composition on outcome in patients with
early breast cancer
Elise Deluche, Sophie Leobon, Jean Claude Desport, Laurence Venat-Bouvet,
Julie Usseglio, Nicole Tubiana-Mathieu
To cite this version:
Elise Deluche, Sophie Leobon, Jean Claude Desport, Laurence Venat-Bouvet, Julie Usseglio, et al..
Impact of body composition on outcome in patients with early breast cancer. Supportive Care in
Cancer, Springer Verlag (Germany), 2018, 26 (3), pp.861-868. �10.1007/s00520-017-3902-6�.
�inserm-02019336�
ORIGINAL ARTICLE
Impact of body composition on outcome
in patients with early breast cancer
Elise Deluche1&Sophie Leobon1&Jean Claude Desport2&Laurence Venat-Bouvet1&
Julie Usseglio1&Nicole Tubiana-Mathieu1
Received: 4 April 2017 / Accepted: 13 September 2017 / Published online: 25 September 2017 # The Author(s) 2017. This article is an open access publication
Abstract
Purpose We investigated the impact of body composition on outcomes of patients with early breast cancer. Skeletal muscle mass, visceral adipose tissue (VAT), subcutaneous adipose tissue (SAT), and muscle fat infiltration or inter-muscular ad-ipose tissue areas (IMAT), obtained by computed tomography (CT), were assessed.
Methods A total of 119 female patients who had breast cancer were included in this retrospective study. The total skeletal muscle and fat tissue areas were evaluated in two adjacent axial slices obtained at the third lumbar vertebra by CT used for disease staging. The women were assigned to either a sarcopenia or non-sarcopenia group based on their skeletal muscle index (cut-off 41.0 cm2/m2). They also were classified into high and low VAT/SAT ratio groups and assigned to either the high or low IMAT index group. The association of the body composition parameters and prognosis was statistically analyzed.
Results Among the 119 evaluable patients, 58 were sarcopenic (48.8%), 55 (46.2%) had a high VAT/SAT ratio, and 62 (52.1%) had a high IMAT index. Median follow-up was 52.4 months. Multivariate analysis revealed sarcopenia and IMAT index as independent prognostic factors for disease-free survival (p = 0.02 and p = 0.04, respectively) and overall survival (p = 0.05 and p = 0.02, respectively). BMI was not significantly associated with disease-free surviv-al, but a trend was observed (p = 0.09).
Conclusions Sarcopenia and IMAT index are independent prognostic factors in early breast cancer; therefore, assessing body composition could be a simple and useful approach to integrate into patient management.
Keywords Early breast cancer . Prognosis . Sarcopenia . Body composition
Introduction
Breast cancer is the most frequent cancer in women and one of the most common causes of cancer-related death among wom-en in the world [1]. In addition to traditional prognostic factors (e.g., tumor size, lymph node status, tumor histology), new clinical or biological markers are the goal of ongoing searches to improve management of this disease.
Body composition seems to be a factor of interest in oncol-ogy and refers to the amount and distribution of lean tissue and adipose tissue in the human body. Different parameters can be evaluated to assess body composition, but the best-known parameter is body mass index (BMI), defined as weight/ height2 (kg/m2) [2]. It has been commonly used to assess nutritional status in cancer, but the role of this anthropometric tool in breast cancer is unclear. Some studies have shown that overweight and obesity are strong risk factors for breast cancer [3], and they are described as prognostic factors for disease recurrence and shorter overall survival (OS) compared to normal-weight patients [4–6]; however, other studies have not confirmed the prognostic role of BMI in breast cancer [7–9].
BMI thus seems insufficient on its own. For example, sarcopenic obesity refers to obese cancer patients who lose muscle mass but for whom the weight loss may be masked by excess fat mass if BMI is considered on its own [10]. Other
* Elise Deluche
elise.deluche@chu-limoges.fr
1
Department of Medical Oncology, University Hospital, 2 Avenue Martin Luther King, 87042 Limoges Cedex, France
parameters that are more representative of body composition have been highlighted thanks to the development of image analysis methods such as computed tomography (CT) scans [11]. Among the compartments that can be distinguished on CT, skeletal muscle mass (SMM), visceral adipose tissue (VAT), subcutaneous adipose tissue (SAT), and muscle fat infiltration or inter-muscular adipose tissue areas (IMAT) have been analyzed [12].
Body composition is an important feature because it affects the efficacy and toxicity of chemotherapy in different cancers [13,14] and is associated with patient outcomes [15,16]. In breast cancer [17], some studies have analyzed the association between body composition and outcomes or toxicities in var-ious situations [18–21].
The objective of this work was to investigate the impact of body composition on outcomes in patients with early breast cancer for whom a CT scan was performed because of aggres-sive clinico-pathological characteristics.
Material and methods
Patients
This retrospective study was performed at Limoges University Hospital on patients treated from March 2007 to June 2016. They were selected from the institution’s database according to all following criteria: (1) Patients had early breast cancer for which a CT scan was performed for staging because of aggres-sive clinico-pathological characteristics; (2) CT scan imaging was performed in the hospital before the beginning of chemo-therapy and images were saved in the institution’s radiology database; (3) clinico-pathological data, including age, meno-pausal status, anthropometric measures, tumor characteristics, and treatment, had to be available and were extracted from the medical records and electronic database. Patients whose breast cancer was diagnosed as metastatic were excluded.
Clinical data were collected in accordance with French bio-ethics laws regarding patient information and consent. Patients also sign informed consent for use of data from bio-logical samples and collections at the beginning of their med-ical care. The use of retrospective and prospective data from the BRTSBRegional solid tumors base^ was validated by the ethics committee.
Anthropometric measures
Weight and height were recorded according to standard methods at the first appointment. Weight was measured by a nurse using the same portable digital scale (Tanita, Tokyo, Japan). Only the first weight was considered for the study. Nurses also measured height using a stadiometer (± 0.5 cm). BMI was calculated and the median BMI was used for the
study. Because of the small sample size, BMI was dichoto-mized as < 25 kg/m2(underweight or normal) and≥ 25 kg/m2 (overweight or obese), as in other studies [13,22].
CT scan imaging
CT scans were performed in patients with aggressive clinico-pathological factors prior to the beginning of chemotherapy and according to French recommendations [23].
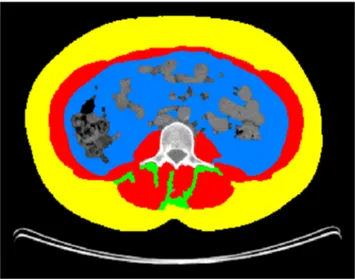
With standard operating procedures [24], SMM, VAT, SAT, and IMAT were assessed using the average of measurements on two adjacent axial slices at the third lumbar vertebra (L3) (Fig. 1). To evaluate SMM, the following parameters were analyzed: the masses of the psoas, quadratus lumborum, transversus abdominis, external and internal obliques, rectus abdominis, and erector spinae muscles. The fat present in the psoas was not taken into account for VAT and defining IMAT. The measured total cross-section (cm2) was normalized for meters squared (m2), expressed in units of cm2/m2, and report-ed respectively as the SMM, VAT, SAT, and IMAT indexes. Images were analyzed using Slice-O-Matic software (v. 4.3 Tomovision, Montreal, Canada).
Because of the lack of consensus, we defined cut-offs as previously reported:
& L3 skeletal muscle index < 41.0 cm2
/m2 defined sarcopenia [15–17,25];
& the cut-off points for the VAT, SAT, and the IMAT indexes were based on the median [26]; and
& VAT/SAT ratio was calculated for each patient, and we divided patients according to the 50th percentiles of the VAT/SAT ratio [27].
Fig. 1 Axial CT image of the third lumbar vertebral region with corresponding highlighted body composition in patients: skeletal muscle mass (SMM) in red, visceral (VAT) in blue, subcutaneous (SAT) fat tissues in yellow, and muscle fat infiltration (IMAT) in green
Statistical analysis
All data were collected and analyzed using STATVIEW® software (SAS Institute, Inc., Cary, NC, USA). Quantitative results were given as median ± SD and qualitative results as percentages. The significance of the difference in the variables among the groups was calculated using the chi-square test. Medians were compared with the nonparametric Mann– Whitney U test for ordinal variables. Overall survival (OS) was calculated from the date of diagnosis to the date of death from any cause or the date of last follow-up. Disease-free survival (DFS) in months was calculated from the date of diagnosis until disease progression or relapse. Survival curves were obtained using the Kaplan–Meier technique. Relevant variables associated with OS and DFS were examined using univariable and, where applicable, multivariable Cox propor-tional hazards regression. For the multivariable models, a univariable inclusion criterion of p≤ 0.2 was used. All statis-tical tests had a level of significance established at p < 0.05.
Results
Clinico-pathological characteristics
A total of 119 patients for whom all inclusion criteria were gathered were included in this study. Clinico-pathological data are presented in Table1. The median age was 56.0 years (range 21–87 years). Patient characteristics were analyzed ac-cording to body composition parameters: sarcopenia (SMM < 41.0 cm2/m2), VAT/SAT ratio, and IMAT. Of the 119 evaluable patients, 58 were sarcopenic (48.8%) and 61 were non-sarcopenic (51.2%) without any significant differences in clinico-pathological characteristics between the two populations.
Fifty-five patients (46.2%) had a high VAT/SAT ratio, and 64 patients (53.8%) had a low VAT/SAT ratio. The difference in clinico-pathological characteristics was the age and the menopausal status: patients with a high VAT/SAT ratio were older (p < 0.0001) and more often postmenopausal (p < 0.0001).
Sixty-two patients (52.1%) had a high IMAT index and 57 patients (47.9%) a low IMAT index. Patients with a high IMAT index were older (p < 0.0001) and had more tumors with lymph node involvement (p = 0.01).
Anthropometric results
Anthropometric results are shown in Table2.
Patients with sarcopenia compared to patients without sarcopenia had lower BMI (p < 0.0001), SMM index (p < 0.0001), and especially lower SAT (p < 0.0001) and VAT (p = 0.002) indexes. The IMAT index was higher in the
sarcopenia group (p = 0.04); however, VAT/SAT ratio was similar in the two groups (p = 0.5).
The median SAT was 85.9 ± 3.3 cm2/m2, and the median VAT was 41.1 ± 2.2 cm2/m2. In the group with a low VAT/SAT ratio compared to the group with a high VAT/SAT ratio, the SAT index was similar but VAT index was higher (p < 0.0001). BMI and SMM index were independent of VAT/SAT ratio, and the IMAT index was higher in the group with a high VAT/SAT ratio (p = 0.002).
The median IMAT index was 3.5 ± 0.2 cm2/m2. A high IMAT index was associated with a high VAT index (p = 0.008), a high VAT/SAT ratio (p = 0.03), and sarcopenia (p = 0.03) whereas BMI and the SAT index were similar.
Obese patient characteristics according to sarcopenia Among the 119 patients studied, 70 patients were with an excess of weight (BMI ≥ 25 kg/m2). According to the predefined cut-off values, 22 patients were considered with sarcopenia. Obese/overweight patients with sarcopenia were older (p = 0.01) and more postmenopausal (p = 0.009). BMI was higher in this group (p = 0.02) as SAT index (p = 0.04).
The other parameters were comparable between sarcopenic-obese/overweight patients and patients without sarcopenia.
Considering body composition parameters, no sarcopenia and IMAT index < 4.4 cm2/m2 were significantly associated with better PFS and OS in univariate analysis. On multivariate analysis, only sarcopenia was found to be independently as-sociated with poor PFS (hazard ratio (HR) 0.3. Confidence interval (CI) 0.1–0.9; p = 0.03).
Anthropometric parameters and outcomes
The results of the univariate and multivariate analyses of DFS and OS are shown in Table 3. Median follow-up was 52.4 (2.0–108.4) months.
Disease-free survival
The median DFS was 17.5 (2.0–49.4) months. There were 25 relapses (21%) with 9 local relapses and 22 metastases. In the univariate analysis, sarcopenia, BMI, VAT index, IMAT in-dex, and VAT/SAT ratio were associated with DFS and were thus included in the multivariate model. In the multivariate analysis, only two factors were significantly associated with DFS: sarcopenia and IMAT index. No sarcopenia was signif-icantly associated with better DFS (HR 0.3; 95% CI 0.1–0.8; p = 0.02) and IMAT index > 3.5 cm2/m2with worse DFS (HR 2.8; 95% CI 1.0–7.8; p = 0.04). BMI was not significantly associated with DFS, but we observed a trend towards signif-icance (p = 0.09) (Fig.2). BMI is not expressed in Fig.2.
Ta b le 1 C linico-pathological charact er is tic s o f the 1 1 9 p ati ents Cr ite ria A ll pa tie nts W ith out sa rcopen ia W ith sarcopenia p W ith a h igh V A T /SA T ra ti o W ith a low V A T /SA T ra ti o p W ith a h igh IMA T index W ith a low IMA T index p Number (%) 1 19 6 1 (51.2%) 58 (48.8%) 55 (46.2%) 64 (5 3.8%) 62 (52.1%) 57 (47.9%) Age (years ) (min-max) 5 6.0 (21 –87) 5 4. 0 (21 –87) 56.0 (27 –83) 0.3 63.0 (34 –83) 47.0 (21 –87) < 0 .0 001 62.5 (34 –83) 48.0 (21 –87) < 0 .0 001 Menopau sal status; n (% ) Postmeno pausal 7 1 (59.5) 3 6 (60.0) 35 (60.0) 0.9 47 (85.0) 23 (3 6.0) < 0 .0 001 45 (72.5) 25 (44.0) 0.8 Premenopaus al 4 8 (40.5) 2 5 (40.0) 23 (40. 0) 8 (15.0) 41 (6 4.0) 17 (27.5) 32 (56.0) E stro g en re cept o r sta tus; n (% ) a Positive 8 8 (74.0) 4 6 (75.0) 42 (73.0) 0.8 3 9 (70.0) 49 (7 6.0) 0.3 4 6 (75.0) 42 (73.5) 0.8 Negative 3 0 (26.0) 1 5 (25.0) 15 (27.0) 16 (30.0) 14 (2 4.0) 15 (25.0) 15 (26.5) Progesterone re ceptor status a; n (% ) Positive 6 4 (55.0) 3 6 (59.0) 28 (49.0) 0.2 2 6 (47.0) 38 (6 0.0) 0.1 3 2 (52.5) 32 (56.0) 0.6 Negative 5 4 (45.0) 2 5 (41.0) 29 (51.0) 29 (53.0) 25 (4 0.0) 29 (47.5) 25 (44.0) HE R2; n (%) b Positive 1 1 (9.5) 7 (1 1 .4) 4 (7 .0) 0.4 3 (5.5) 8 (13 .0) 0.1 5 (8 .5) 6 (1 1.0) 0.7 Negative 1 05 (90.5) 5 4 (88.6) 51 (93.0) 51 (85.5) 54 (8 7.0) 54 (91.5) 51 (89.0) Cli n ic al tumor si ze < 2 cm 2 3 (19.0) 8 (13.0) 15 (26.0) 0.07 10 (18.2) 13 (2 0.3) 0.7 1 1 (17.7) 12 (21.1) 0.6 ≥ 2 cm 9 6 (81.0) 5 3 (87.0) 43 (74.0) 45 (81.8) 51 (7 9.7) 51 (82.3) 45 (78.9) SBR g rade c 1 3 (2.5) 2 (3.5) 1 (1 .8) 0 .2 0 (0) 3 (13 .0) 0 .1 1 (1 .6) 2 (3 .0) 0.7 2 7 2 (60.5) 4 0 (70.1) 32 (58.2) 38 (70.0) 34 (5 3.0) 38 (62.0) 34 (64.0) 3 3 7 (14.3) 1 5 (26.4) 22 (40.0) 15 (30.0) 22 (3 4.0) 18 (36.4) 19 (33.0) L ymph nodes; n (% ) Negative 3 5 (29.4) 2 1 (34) 14 (24) 0.2 15 (27.0) 20 (3 1.25) 0.8 12 (19.0) 23 (40.5) 0.0 1 Positive (< 3) 4 7 (39.4) 2 5 (41) 22 (38) 23 (42.0) 24 (3 7.5) 25 (40.5) 22 (40.5) Posit ive (≥ 3) 3 7 (31.2) 1 5 (25) 22 (38) 17 (31.0) 20 (3 1.25) 25 (40.5) 12 (19.0) Neoadjuvant chemotherapy; n (% ) 5 5 3 4 (62) 21 (38) 0.3 23 (42.0) 32 (5 0.0) 0.3 26 (42.0) 29 (50.0) 0.1 Pathological complete response d yes /no 1 7/36 1 2/22 5/14 0.5 6/16 11/20 0.5 6/19 11/17 0.2 Adjuvant chemotherapy alone; n (% ) 6 4 (54) 2 7 (44) 37 (64) 0.2 32 (58.1) 32 (5 0.0) 0.0 7 36 (58.0) 28 (49.1) 0.3 Adjuvant radiotherapy; n (% ) 1 07 (90.0) 5 6 (91.0) 51 (87.0) 0.4 51 (87.0) 56 (9 2.0) 0.3 51 (87.0) 56 (92.0) 0.3 p -v alue st at isti cal ly signi fic ant at the 0 .0 5 level SBR :S ca rf f– Bloom –R ichards on; BMI , b ody mas s index; VA T : v isceral adipose tissu e; SA T : subcutaneo us adipose tissu e; IMA T : m u scle fat in fil tr ati on a One m issing datum b Three m issin g data poin ts c S even m issing data points d T w o m iss ing data p o ints
Overall survival
The median OS was 52.4 (2.0–108.4) months with 22 deaths (18.4%). Among the body composition parameters, sarcopenia, IMAT index, and VAT/SAT ratio were associated with OS in the univariate analysis. In the multivariate analysis, only two parameters were significantly associated with worse OS: no sarcopenia (HR 0.3; 95% CI 0.1–0.99; p = 0.05) and IMAT index > 3.5 cm2/m2 (HR 3.6; 95% CI 1.2–10.8; p = 0.02) (Fig.2). BMI is not expressed in Fig.2.
Discussion
Our study highlighted two parameters of the body composi-tion, sarcopenia and the IMAT index, are significantly associ-ated with DFS and OS in patients with breast cancer. Patients with sarcopenia and a high IMAT index (> 3.5 cm2/m2) had a poor prognosis.
Among body composition features, sarcopenia has emerged as a common parameter in many cancers [25]. To our knowledge, only one study has determined the prevalence of sarcopenia in adjuvant breast cancer [19]; Villaseñor et al. found that 15.9% of sarcopenic patients (n = 471) had been diagnosed with stage I–IIIA breast cancer. We found a higher prevalence of sarcopenia (47.8%), probably because of the imaging method used for sarcopenia evaluation; Villaseñor et al. used dual X-ray absorptiometry scans whereas we used CT scans. Both methods were validated, but a CT scan allows for more accurate evaluation of sarcopenia [28]. Moreover, measurement of body composition using CT scans is easier and more reproducible, as previously reported [17,29].
In addition, we found that sarcopenia was an independent factor in poor DFS and OS, as in other studies focusing on breast [19] and other cancers [17]. Villaseñor et al. reported that sarcopenia (< 5.45 kg/m2) was associated with an in-creased risk of overall mortality in adjuvant breast cancer sur-vivors (HR 2.86; 95% CI 1.67–4.89), but breast cancer-specific mortality was not statistically increased (HR 1.95; 95% CI 0.87–4.35).
In the neoadjuvant breast cancer setting, sarcopenia has been associated with OS but not with DFS [18], and Iwase et al. reported that the distant DFS (DDFS) did not differ significantly between the two groups [21]. The main difficulty in the study of sarcopenia is an assortment of definitions with a variety of cut-offs. A European working group on sarcopenia recommends incorporating both muscle mass and muscle function into the definition of sarcopenia [30]. Our study was retrospective, so it was not possible to evaluate muscle function (strength or performance) to define sarcopenia, which was defined only by CT scan, as is com-monly accepted [17]. Ta b le 2 Anthropometric results for the 11 9 patients included in this study Criteria A ll patients W ithout sarcopenia W ith sarcopenia p W ith a h igh VA T /S A T ra ti o W ith a low VA T /S A T ra ti o p W ith a h ig h IM A T in de x W ith a low IMA T index p P ati en ts w ith BMI < 25 kg/m2 (n = 49) Pa tie nts w it h BMI ≥ 25 kg/m2 (n = 70) p W eight (kg) 68.0 ± 1.4 77.4 ± 16.6 64.6 ± 12.1 < 0 .0001 70.0 ± 1.9 67.0 ± 2.1 0 .2 73 .0 ± 2 .1 67.0 ± 1.8 0 .1 56.0 ± 0.9 78.0 ± 1.5 < 0 .001 BMI (k g /m 2 ) 26.6 ± 0.50 28.7 ± 4.4 23.5 ± 5.7 < 0 .0001 27.2 ± 0.7 25.5 ± 0.6 0 .2 27 .0 ± 0 .7 26.0 ± 0.6 0 .1 22.2 ± 0.2 29.7 ± 0.5 < 0 .001 SMM index (cm 2 /m 2 ) 42.30 ± 0 .7 47.0 ± 5.1 37.1 ± 4.0 < 0 .0001 43.1 ± 1.0 41.2 ± 0.9 0 .7 40 .6 ± 0 .9 43.5 ± 1.0 0 .2 38.4 ± 0.8 45.4 ± 0.9 < 0 .001 Sarcopenia n (%) 26 (47.2) 32 (50.0) 0.7 36 (58.0) 22 (3 8.6) 0.03 35 (71.4) 22 (31.4) < 0 .001 SA T in d ex (c m 2 /m 2 ) 85.9 ± 3.3 99.7 ± 4.4 69.5 ± 4.3 < 0 .0001 85.8 ± 4.0 86.5 ± 5.2 0 .6 87 .8 ± 4 .6 84.3 ± 4.6 0 .1 60.4 ± 3.3 101.0 ± 4.0 < 0 .001 V A T index (cm 2 /m 2 ) 41.1 ± 2.2 44.7 ± 3.1 29.8 ± 2.9 0.002 52.0 ± 3.1 26.6 ± 2.4 < 0 .0001 45 .6 ± 3 .2 31.6 ± 2.7 0.008 23.7 ± 1.9 52.0 ± 2.7 < 0 .001 V A T/SA T ratio 0.46 ± 0.02 0.49 ± 0.02 0.42 ± 0.02 0.5 0.6 ± 0.01 0.3 ± 0.03 < 0 .0001 0.5 ± 0.04 0.4 ± 0.03 0.03 0.41 ± 0.02 0.53 ± 0.02 0.0029 IMA T index (cm 2 /m 2 ) 3 .5 ± 0 .2 3.3 ± 0.3 3 .9 ± 0 .3 0.04 4.0 ± 2.6 3 .3 ± 2 .2 0.002 4.7 ± 0.3 2 . 5 ± 0 .1 <0 .0 0 0 1 3.4 ± 0.3 3 .6 ± 0 .3 0.2 A llr es u lt sa ree x p re ss edi nm ed ia n± S D BM I, body mass index; SMM : skele tal m usc le m ass; VA T : v isceral adipos e tiss u e; SA T : subcutaneous adipos e tiss ue; IMA T : m u scle fat in fi ltr ati o n
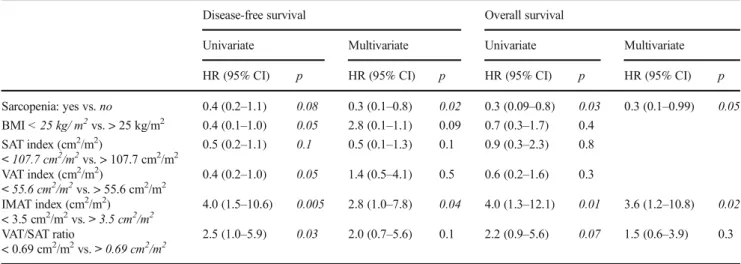
Table 3 Univariate and multivariate analyses of body composition parameters for DFS and OS (n = 119) Disease-free survival Overall survival
Univariate Multivariate Univariate Multivariate HR (95% CI) p HR (95% CI) p HR (95% CI) p HR (95% CI) p Sarcopenia: yes vs. no 0.4 (0.2–1.1) 0.08 0.3 (0.1–0.8) 0.02 0.3 (0.09–0.8) 0.03 0.3 (0.1–0.99) 0.05 BMI < 25 kg/ m2vs. > 25 kg/m2 0.4 (0.1–1.0) 0.05 2.8 (0.1–1.1) 0.09 0.7 (0.3–1.7) 0.4 SAT index (cm2/m2) < 107.7 cm2/m2vs. > 107.7 cm2/m2 0.5 (0.2–1.1) 0.1 0.5 (0.1–1.3) 0.1 0.9 (0.3–2.3) 0.8 VAT index (cm2/m2) < 55.6 cm2/m2vs. > 55.6 cm2/m2 0.4 (0.2–1.0) 0.05 1.4 (0.5–4.1) 0.5 0.6 (0.2–1.6) 0.3 IMAT index (cm2/m2) < 3.5 cm2/m2vs. > 3.5 cm2/m2 4.0 (1.5–10.6) 0.005 2.8 (1.0–7.8) 0.04 4.0 (1.3–12.1) 0.01 3.6 (1.2–10.8) 0.02 VAT/SAT ratio < 0.69 cm2/m2vs. > 0.69 cm2/m2 2.5 (1.0–5.9) 0.03 2.0 (0.7–5.6) 0.1 2.2 (0.9–5.6) 0.07 1.5 (0.6–3.9) 0.3
BMI: body mass index; VAT index: visceral adipose tissue; SAT index: subcutaneous adipose tissue; IMAT index: muscle fat infiltration
866 Support Care Cancer (2018) 26:861–868
Fig. 2 Disease-free survival and overall survival of patients with breast cancer based on skeletal muscle mass index (or sarcopenia) and muscle fat infiltration (IMAT) index (n = 119)
In our study, the threshold value for sarcopenia was near that of Fabbro et al. (41.0 cm2/m2 in the current work vs. 38.5 cm2/m2) [17]. There is no gold standard for defining the optimal cut-off of sarcopenia in breast cancer, so we relied on prospective data and meta-analyses in different cancers. The cut-off predominantly found was fixed at 41.0 cm2/m2 [15–17,25].
The effect of the combination of sarcopenia and obesity (sarcopenic obesity) has been examined in different cancers, suggesting that sarcopenia is an independent prognostic factor of lower survival in obese patients with cancer as we showed despite our small population [3–6]. Prado et al. reported that in patients (n = 250) with gastrointestinal cancer or lung cancer, obese patients with sarcopenia had an increased risk of mor-tality (HR 4.2; 95% CI 2.4–7.2) compared to obese non-sarcopenic patients [15]. In pancreatic cancer, Tan et al. re-ported that sarcopenia was an independent predictor of mor-tality among overweight/obese patients (n = 111) (HR02.07; 95% CI, 1.23–3.50) [13].
At least, different studies show that maintaining physical exercise has positive effects and decreases sarcopenia espe-cially in elderly patients [31,32]. The fight against sarcopenia thus requires an effective screening but also by the implemen-tation of physical activity.
We found IMAT as an independent prognosis factor of survival in breast cancer patients. We evaluated IMAT sepa-rately from other parameters, as did van Dijk et al. [33]. A recent study reported that high inter-muscular adipose tissue content was predictive of an unfavorable prognosis in hepato-cellular carcinoma [34], but to our knowledge, the current work is the first to report a relationship between IMAT and outcomes in breast cancer.
The other parameters we examined (BMI and VAT/SAT ratio) were not associated with outcomes. The median values of VAT and SAT were taken into account because they were previously implicated as prognostic in metastatic colorectal cancer [26]. To our knowledge, only one study has evaluated the relation among VAT, SAT, and outcomes in advanced breast cancer [21]. In that study conducted in 172 patients with breast cancer treated in a neoadjuvant setting, the DDFS was signifi-cantly worse for the high VAT group (VAT≥ 100 cm2), but high SAT (SAT≥ 100 cm2) was not associated with DDFS and OS. These thresholds were based on the guideline for screening metabolic disease created by the Japan Society for the Study of Obesity [35]. In other cancers, the impact of VAT and SAT remains unclear, and the variation in cut-offs can explain the difference among all studies [36]. Moreover, there are differ-ences between the two groups considering the menopausal sta-tus. It is indicated that menopause causes changes in body com-position with increased visceral fat comcom-position as Iwase et al. showed [1]. The authors reported that subcutaneous fat area and visceral fat area increased significantly and skeletal muscle area decreased significantly after menopause (all p < 0.05).
The limitations of our study are its retrospective nature and the relatively small number of patients. According to recom-mendations, CT scans are not systematically used to assess extension in breast cancer. In order to study specifically body composition, instead of including all patients with early breast cancer, we selected patients who had an initial CT assessment and were probably more severe. Finally, our multivariate anal-ysis included only body composition criteria.
Conclusion
Our results suggest that the evaluation of body composition, especially sarcopenia and IMAT index based on CT scan anal-ysis, is worth including in breast cancer management. We propose a prospective study integrating CT imaging and func-tional tests to validate the prognostic role of the two parame-ters in early breast cancer in a larger population of patients.
Compliance with ethical standards Clinical data were collected in accordance with the French bioethics laws regarding patient information and consent.
Conflict of interest The authors declare that there are no conflicts of interest.
Open Access This article is distributed under the terms of the Creative Commons Attribution-NonCommercial 4.0 International License (http:// creativecommons.org/licenses/by-nc/4.0/), which permits any noncom-mercial use, distribution, and reproduction in any medium, provided you give appropriate credit to the original author(s) and the source, pro-vide a link to the Creative Commons license, and indicate if changes were made.
References
1. Stewart B, Wild CP et al (2014) World cancer report 2014 2. Senesse P, Bachmann P, Bensadoun RJ et al (2014) Clinical
nutri-tion guidelines of the French Speaking Society of Clinical Nutrinutri-tion and Metabolism (SFNEP): summary of recommendations for adults undergoing non-surgical anticancer treatment. Dig Liver Dis. https://doi.org/10.1016/j.dld.2014.01.160
3. De Pergola G, Silvestris F (2013) Obesity as a major risk factor for cancer. J Obes 2013:291546.https://doi.org/10.1155/2013/291546 4. Arce-Salinas C, Aguilar-Ponce JL, Villarreal-Garza C et al (2014) Overweight and obesity as poor prognostic factors in locally advanced breast cancer patients. Breast Cancer Res Treat 146:183–188.https://doi.org/10.1007/s10549-014-2977-8 5. Herlevic VC, Mowad R, Miller JK et al (2015) Breast cancer
out-comes in a population with high prevalence of obesity. J Surg Res 198:371–376.https://doi.org/10.1016/j.jss.2015.03.088
6. von Drygalski A, Tran TB, Messer K et al (2011) Obesity is an independent predictor of poor survival in metastatic breast cancer: retrospective analysis of a patient cohort whose treatment included high-dose chemotherapy and autologous stem cell support. Int J Breast Cancer 2011:1–8.https://doi.org/10.4061/2011/523276 7. Chan DSM, Vieira AR, Aune D et al (2014) Body mass index
review and meta-analysis of 82 follow-up studies. Ann Oncol 25:1901–1914. https://doi.org/10.1093/annonc/mdu042
8. Cecchini RS, Swain SM, Costantino JP et al (2016) Body mass index at diagnosis and breast cancer survival prognosis in clinical trial populations from NRG Oncology/NSABP B-30, B-31, B-34, and B-38. Cancer Epidemiol Prev Biomark 25:51–59.https://doi. org/10.1158/1055-9965.EPI-15-0334-T
9. Gennari A, Amadori D, Scarpi E et al (2016) Impact of body mass index (BMI) on the prognosis of high-risk early breast cancer (EBC) patients treated with adjuvant chemotherapy. Breast Cancer Res Treat 159:79–86. https://doi.org/10.1007/s10549-016-3923-8
10. Prado CMM, Lieffers JR, McCargar LJ et al (2008) Prevalence and clinical implications of sarcopenic obesity in patients with solid tumours of the respiratory and gastrointestinal tracts: a population-based study. Lancet Oncol 9:629–635.https://doi.org/ 10.1016/S1470-2045(08)70153-0
11. Mitsiopoulos N, Baumgartner RN, Heymsfield SB et al (1998) Cadaver validation of skeletal muscle measurement by magnetic resonance imaging and computerized tomography. J Appl Physiol Bethesda Md 85:115–122
12. Rutten IJ, Dijk DP, Kruitwagen RF et al (2016) Loss of skeletal muscle during neoadjuvant chemotherapy is related to decreased survival in ovarian cancer patients. J Cachex Sarcopenia Muscle 7:458–466.https://doi.org/10.1002/jcsm.12107
13. Anandavadivelan P, Brismar TB, Nilsson M et al (2016) Sarcopenic obesity: a probable risk factor for dose limiting toxicity during neo-adjuvant chemotherapy in oesophageal cancer patients. Clin Nutr 35:724–730.https://doi.org/10.1016/j.clnu.2015.05.011
14. Antoun S, Borget I, Lanoy E (2013) Impact of sarcopenia on the prognosis and treatment toxicities in patients diagnosed with cancer. Curr Opin Support Palliat Care 7:383–389.https://doi.org/10.1097/ SPC.0000000000000011
15. Lodewick TM, van Nijnatten TJA, van Dam RM et al (2015) Are sarcopenia, obesity and sarcopenic obesity predictive of outcome in patients with colorectal liver metastases? HPB 17:438–446.https:// doi.org/10.1111/hpb.12373
16. Martin L, Birdsell L, Macdonald N et al (2013) Cancer cachexia in the age of obesity: skeletal muscle depletion is a powerful prognos-tic factor, independent of body mass index. J Clin Oncol Off J Am Soc Clin Oncol 31:1539–1547.https://doi.org/10.1200/JCO.2012. 45.2722
17. Shachar SS, Williams GR, Muss HB, Nishijima TF (2016) Prognostic value of sarcopenia in adults with solid tumours: a meta-analysis and systematic review. Eur J Cancer Oxf Engl 57: 58–67.https://doi.org/10.1016/j.ejca.2015.12.030
18. Fabbro ED, Parsons H, Warneke CL et al (2012) The relationship between body composition and response to neoadjuvant chemo-therapy in women with operable breast cancer. Oncologist 17: 1240–1245.https://doi.org/10.1634/theoncologist.2012-0169 19. Villaseñor A, Ballard-Barbash R, Baumgartner K et al (2012)
Prevalence and prognostic effect of sarcopenia in breast cancer survivors: the HEAL Study. J Cancer Surviv 6:398–406
20. Wong AL, Seng KY, Ong EM et al (2014) Body fat composition impacts the hematologic toxicities and pharmacokinetics of doxo-rubicin in Asian breast cancer patients. Breast Cancer Res Treat 144:143–152.https://doi.org/10.1007/s10549-014-2843-8 21. Iwase T, Sangai T, Nagashima T et al (2016) Impact of body fat
distribution on neoadjuvant chemotherapy outcomes in advanced breast cancer patients. Cancer Med 5:41–48.https://doi.org/10. 1002/cam4.571
22. Antoun S, Bayar A, Ileana E et al (2015) High subcutaneous adipose tissue predicts the prognosis in metastatic castration-resistant prostate cancer patients in post chemotherapy setting. Eur J Cancer Oxf Engl 51:2570–2577.https://doi.org/10.1016/j. ejca.2015.07.042
23. Cutuli B, Giard-Lefevre S, Antoine M et al (2012) Cancer du sein infiltrant non métastatique - questions d’actualités (synthèse) 82. www.e-cancer.fr/content/download/95914/1021156/file/ RECOSEININFILT12.PDF
24. Shen W, Punyanitya M, Wang Z et al (2004) Total body skeletal muscle and adipose tissue volumes: estimation from a single ab-dominal cross-sectional image. J Appl Physiol Bethesda Md 97: 2333–2338.https://doi.org/10.1152/japplphysiol.00744.2004 25. Shachar SS, Deal AM, Weinberg M et al (2016) Skeletal muscle
measures as predictors of toxicity, hospitalization, and survival in patients with metastatic breast cancer receiving taxane based che-motherapy. Clin Cancer Res Clincanres.https://doi.org/10.1158/ 1078-0432.CCR-16-0940
26. Guiu B, Petit JM, Bonnetain F et al (2010) Visceral fat area is an independent predictive biomarker of outcome after first-line bevacizumab-based treatment in metastatic colorectal cancer. Gut 59:341–347.https://doi.org/10.1136/gut.2009.188946
27. Moon H-G, Ju Y-T, Jeong C-Y et al (2008) Visceral obesity may affect oncologic outcome in patients with colorectal cancer. Ann Surg Oncol 15:1918–1922
28. Yip C, Dinkel C, Mahajan A et al (2015) Imaging body com-position in cancer patients: visceral obesity, sarcopenia and sarcopenic obesity may impact on clinical outcome. Insights Imaging 6:489–497.https://doi.org/10.1007/s13244-015-0414-0 29. Sottier D, Petit J-M, Guiu S et al (2013) Quantification of the
vis-ceral and subcutaneous fat by computed tomography: interobserver correlation of a single slice technique. Diagn Interv Imaging 94: 879–884
30. Cruz-Jentoft AJ, Baeyens JP, Bauer JM et al (2010) Sarcopenia: European consensus on definition and diagnosis report of the European working group on sarcopenia in older people. Age Ageing 39:412–423.https://doi.org/10.1093/ageing/afq034 31. Fielding R, Kirn D, Koochek A et al (2016) PT02.5: impact of a
structured physical activity program and nutritional supplementa-tion on regional body composisupplementa-tion: results from the Vitality, Independence, and Vigor in the Elderly 2 Study (VIVE2). Clin Nutr 35:S25.https://doi.org/10.1016/S0261-5614(16)30294-1 32. Janssen I, Heymsfield SB, Ross R (2002) Low relative skeletal
muscle mass (sarcopenia) in older persons is associated with func-tional impairment and physical disability. J Am Geriatr Soc 50: 889–896
33. van Dijk DPJ, Bakens MJAM, Coolsen MME et al (2016) Low skeletal muscle radiation attenuation and visceral adiposity are as-sociated with overall survival and surgical site infections in patients with pancreatic cancer. J Cachexia Sarcopenia Muscle.https://doi. org/10.1002/jcsm.12155
34. Kim TY, Kim MY, Sohn JH et al (2014) Sarcopenia as a useful predictor for long-term mortality in cirrhotic patients with ascites. J Korean Med Sci 29:1253–1259.https://doi.org/10.3346/jkms. 2014.29.9.1253
35. Matsuzawa Y (2002) New criteria forBobesity disease^ in Japan: the Examination Committee of Criteria forBObesity Disease^ in Japan, Japan Society for the Study of Obesity. Circ J Off J Jpn Circ Soc 66:987–992
36. Xiao J, Mazurak VC, Olobatuyi TA et al (2016) Visceral adiposity and cancer survival: a review of imaging studies. Eur J Cancer Care (Engl).https://doi.org/10.1111/ecc.12611