HAL Id: insu-00955423
https://hal-insu.archives-ouvertes.fr/insu-00955423
Submitted on 4 Mar 2014HAL is a multi-disciplinary open access archive for the deposit and dissemination of sci-entific research documents, whether they are pub-lished or not. The documents may come from teaching and research institutions in France or abroad, or from public or private research centers.
L’archive ouverte pluridisciplinaire HAL, est destinée au dépôt et à la diffusion de documents scientifiques de niveau recherche, publiés ou non, émanant des établissements d’enseignement et de recherche français ou étrangers, des laboratoires publics ou privés.
Dawei Hu, Ling Li, Mahmoud Idir, Abdelwahid Mellouki, Jianmin Chen,
Véronique Daële, Hui Chen, Mathieu Cazaunau, Benoit Grosselin, Yujing Mu,
et al.
To cite this version:
Dawei Hu, Ling Li, Mahmoud Idir, Abdelwahid Mellouki, Jianmin Chen, et al.. Size Distribution and Optical Properties of Ambient Aerosols during Autumn in Orleans, France. Aerosol and Air Quality Research, 2014, 14, pp.744-755. �10.4209/aaqr.2013.07.0252�. �insu-00955423�
Copyright © Taiwan Association for Aerosol Research ISSN: 1680-8584 print / 2071-1409 online
doi: 10.4209/aaqr.2013.07.0252
Size Distribution and Optical Properties of Ambient Aerosols during Autumn in
Orleans, France
Dawei Hu
1,2, Ling Li
2, Mahmoud Idir
1, Abdelwahid Mellouki
1,3*, Jianmin Chen
2,3*,
Véronique Daële
1, Hui Chen
1,2, Mathieu Cazaunau
1, Benoit Grosselin
1, Yujing Mu
4,
Xinming Wang
5, Jinhe Wang
1,21
Institut de Combustion, Aérothermique, Réactivité et Environnement, ICARE-CNRS/OSUC, 45071 Orléans cedex 02, France
2
Shanghai Key Laboratory of Atmospheric Particle Pollution and Prevention (LAP3), Department of Environmental Science & Engineering, Fudan University, Shanghai 200433, China
3
School of Environmental Science & Engineerinsg, Shandong University, Shandong 250100, China
4
Research Center for Eco-Environmental Sciences, Chinese Academy of Sciences, Beijing 100085, China
5
Chinese Acad Sci, State Key Lab Organ Geochem, Guangzhou Inst Geochem, Guangzhou 510640, China
ABSTRACT
A new highly sensitive cavity ring-down spectrometer (CRDS) system was designed and assembled to determine the aerosol extinction coefficient (bext) at 532 nm. The performance of the CRDS was tested by the monodisperse polystyrene
latex spheres (PSL) particles with diameters between 200 and 500 nm. By comparing the tested results with Mie theory curve, the uncertainty of the newly developed CRDS system was determined to be < 3%. Simultaneous measurements of the size distribution and extinction coefficient of ambient aerosols were conducted in Orleans, France, from 26th October to 21st December 2012 by using a scanning mobility particle sizer (SMPS) coupled to the CRDS system. For the non-dehydrated aerosols measured from 26th October to 4th November, the average bext has been found to be 41 ± 35 Mm–1. For
the dehydrated aerosols measured from 7th November to 21st December, bext expresses a good agreement with the particle
number (N) and volume (V) concentration, the average values of bext, N and V are 36 ± 31 Mm–1, 3300 ± 2700 cm–3 and
3.1 ± 2.8 × 10⁹ nm3/cm3, respectively. Further analysis of the particle size distribution reveals that car and boiler emissions maybe the main aerosol sources in Orleans. In addition, back trajectory results indicate that the air parcel transported from Atlantic Ocean may play a role in cleaning up the ambient air in Orleans.
Keywords: CRDS; Optical properties; Size distribution; Orleans-France.
NTRODUCTION
Aerosol particles influence climate both directly, by scattering and absorbing solar radiation (Charlson et al., 1992; Haywood and Shine, 1997), and indirectly, by acting as cloud condensation nuclei (CCN) with subsequent effects on the albedo and lifetime of clouds (Kaufman et al., 2005). In addition, aerosol particles affect visibility (Vis) and air quality, such as the haze and dust storm events (Fu
et al., 2010; Han et al., 2012; Huang et al., 2012; Wang et al., 2012; Yang et al., 2012; Zhang et al., 2012; Kang et al., 2013; Park and Cho, 2013; Park et al., 2013). Different
investigations suggest that the visibility, as the most readily
*
Corresponding author.
Tel.: +33-238257612; Fax: +33-238696004
E-mail address: mellouki@cnrs-orleans.fr;
jmchen@fudan.edu.cn
perceived impact of air pollution, is highly dependent on the particle size and optical properties, and can be calculated by particle extinction coefficient (bext), i.e., Vis = 3.912/bext
(Seinfeld and Pandis, 2006; Li et al., 2011).
Because of the evidence of their role in climate change and visibility, the study of the optical properties of atmospheric aerosols has received on enormous interest in the last years. Recently, cavity ring-down spectroscopy (CRDS) has been introduced as a robust and complimentary method to in situ measurement of the aerosols extinction coefficient (Smith and Atkinson 2001; Thompson et al., 2002; Strawa
et al., 2003; Pettersson et al., 2004; Moosmuller et al., 2005;
Strawa et al., 2006; Baynard et al., 2007; Riziq et al., 2007; Lang-Yona et al., 2009; Radney et al., 2009; Sakamoto et
al., 2009; Li et al., 2011; Qiu et al., 2012; Khalizov et al.,
2013). CRDS is not only used in laboratory to measure the optical properties of inorganic aerosols (Bulatov et al., 2002; Riziq et al., 2007), secondary organic aerosols (Nakayama
et al., 2010b; Redmond et al., 2011; Nakayama et al., 2012;
al., 2008; Xue et al., 2009; Khalizov et al., 2009; Qiu, et al., 2012; Khalizov et al., 2013), but has also been employed
for field campaigns in many different places of the world. For example, Nakayama et al. (2010a) measured the aerosol optical properties in central Tokyo during summertime using CRDS, a nephelometer and a particle/soot absorption photometer (PSAP). The average bext, bsca (scattering
coefficient) and babs (absorption coefficient) at 532 nm were
determined to be 144.7 ± 85.2, 130 ± 81.4 and 13.6 ± 9.2 Mm–1, respectively, and bext expressed a good agreement
with bsca + babs values during this observations. In the United
States, the same phenomenon, i.e., excellent agreement between bext (CRDS) and that derived from combining
nephelometer scattering and PSAP absorption (bsca + babs),
was also observed in Oklahoma (Strawa et al., 2006). For other cities of the United States, Langridge et al. (2011) designed a multi-wavelength 8-channels CRDS system and measured the multi-wavelength aerosol extinction under dry and elevated RH conditions in California. Thompson et
al. (2002), by measuring the aerosol optical properties in
Florida from 4th May to 3rd July, 2001 have reported the average extinction coefficient of 80.4 Mm–1 for 510 nm and 87.0 Mm–1 for 578 nm. In China, the first CRDS system used to investigate the aerosol optical properties was designed and assembled by Li et al. (2011). They found that the maximum aerosol extinction coefficient reached up to 2 × 10³ Mm–1 from 28th May to 2nd June, 2009 in Shanghai and that the visibility derived from CRDS (Vis = 3.912/bext)
was in good agreement with that reported by Shanghai Meteorological Bureau. Recently, the same authors reported that the particle water-soluble inorganic ions (WSI), especially SO42–, NO3–, Cl– and NH4+, have a good correlation with
scattering coefficient in urban Shanghai (Li et al., 2013). As mentioned above, although the CRDS system has been extensively used in the world, to our knowledge, most of aerosol optical studies conducted in Europe were performed
using the conventional techniques, such as: nephelometer, PSAP and Aethalometer (Vrekoussis et al., 2005; Bryant et
al., 2006; Kalivitis et al., 2011; Esteve et al., 2012), hence,
up to now, there are no publications about the use of CRDS to measure the extinction coefficient of ambient aerosols in Europe. Since the aerosol extinction coefficient is a function of the particle size, simultaneous observations of the particle size distribution and extinction coefficient will provide a good way for a better understanding of the optical properties of aerosols.
In this study, a pulsed CRDS instrument for measuring extinction coefficient of atmospheric aerosols was developed. First, the instrument was validated using monodisperse laboratory-generated polystyrene latex spheres (PSL) particles. It was then coupled to a SMPS for simultaneous measurements of the extinction coefficient and size distribution at the CNRS campus in Orleans-France during the autumn of 2012.
EXPERIMENTAL
Sampling Site and Period
The measurements presented in this study were made during the period 26th October–21st December, 2012 at the campus of the Centre National de la Recherche Scientifique (CNRS) in Orleans, France (47°50 16.80 N, 1°56 39.34 E). As shown in Fig. 1, Orleans city is located in the central France, about 120 km southwest of Paris. Typical average concentrations in Orleans for O3 (52.8 ± 12.7 µg/m3), NO2
(24.0 ± 14.4 µg/m3), NO (4.3 ± 3.4 µg/m3), PM2.5 (18.0 ±
5.9 µg/m3), and PM10 (13.1 ± 5.9 µg/m3) have been measured
by LigAir (http://www.ligair.fr/) from May 2012 to March 2013. Our sampling site, positioned at the CNRS campus, about 8 km south of the Orleans city center, is mostly surrounded by residential dwellings. There are no obstructing buildings around the sampling site within 50 m. During the
measurement, CRDS and SMPS sampled the ambient aerosols from an inlet located 1 m above the roof of the site (~3.5 m above the ground).
This study has been conducted during two different periods under different conditions. The first one, the non-dehydrated condition was from 26th October to 4th November where the extinction coefficient was measured from the ambient air. This represents ‘real’ atmospheric conditions for the aerosols and the resulting extinction coefficient. The data recorded by the weather station at the same sampling site reveal that the RH of the ambient air during this period was in the range 0.54–1.00 with a mean value of 0.86. The second period, the dehydrated condition was from 7th November to 21st December, where the study was conducted to investigate the particle size distribution effect on the aerosol extinction coefficient after removing the interference from relative humidity. In this study, the sampled ambient aerosols were flowed through a silica drier before entering into the CRDS and SMPS. During this measurement, the dessicant was replaced 2 times per week and the RH of the sample before and after changing the dessicant was monitored for each replacement. The recorded data reveal that the RH of the dehydrated aerosol was less than 15%.
Experimental setup
The experimental setup consists of a combination of a SMPS and a CRDS. The SMPS has been described in detail elsewhere (Heim et al., 2004). Therefore, only a brief description is presented here. In the SMPS system used in this work (TSI Inc., USA), the particles are firstly neutralized with Kr85 diffusion charger and size selected using a differential mobility analyzer (DMA, Model 3081). The selected monodisperse particles subsequently goes to a butanol-based condensation particle counter (CPC, Model 3022A), which determines the particle concentration at that size. In this study, the detectable aerosol mobility diameters range from 10.7 to 487.3 nm with a sheath and sample flow rates of 5 LPM and 0.5 LPM, respectively. The total counting time required for each sample is about 130 s, consisting of a 120 s up scan and a 10 s retrace. Before measurements,
SMPS has been calibrated by the PSL particles.
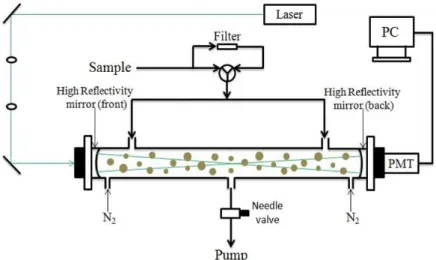
The CRDS system is shown schematically in Fig. 2. The instrument constructed in our group is similar in design to that developed by Li et al. (2011). Laser light at 532 nm, generated by a pulsed Nd:YAG laser (EXPL-532-200-E, Spectra-Physics Inc., USA), is firstly introduced into a cavity cell and then bounced numerous times between two highly reflective mirrors (532 nm center wavelength, 99.997% reflectivity, 1m radius of curvature, ATFilms Inc., USA). Each time the pulse interacts with the back mirror, a small amount of light (e.g., 0.003%) leaks out. This light is collected and detected with a photomultiplier tube (PMT, R928, Hamamatsu Inc., Japan). Data acquisition was performed using a 100 MHz Digital card (NI PXIe-1073, USA) and control programs have been written in LabVIEW software. Since the intensity of the transmitted light is proportional to that of the trapped light, the time decay of the light intensity inside the cavity can be determined by monitoring the transmitted signal. The decay time is calculated by using non-linear fitting procedure. The temporal resolution was 1 ms and the data was averaged for every 10 s. After obtaining the decay time of the cavity filled with (τ) and without (τ0)
aerosols, the aerosol extinction coefficient (bext) can be
calculated according to the following equation:
0 1 1 ( ) ext L b cl (1)
where L is the length between the mirrors (m), l is the effective sample path length (m), c is the speed of light (m/s). To ensure good mixing and even concentration of the particles inside the cavity, the aerosol flow enters the cavity from the two inlets near the mirrors and exits the cavity from the outlet in the middle of the cavity. Meantime, to prevent mirror contamination by deposition of aerosols, a small purge flow of dry particle-free nitrogen (0.03 LPM) is introduced in front of each mirror. In our CRDS system, the distance between the two mirrors is 68 cm and the length of the cavity occupied by particles during the flow is about 63 cm. The minimal detectable extinction coefficient (bext min) can be calculated by the following equation:
min min 2 0 ext L b cl (2)
where Δτmin is the detection limitation of the decay time.
During the experiment, τ0 is 30 µs and the Δτmin is 0.1 µs,
resulting the bext min = 4.0×10⁻⁷ m-1.
During the experiment, the aerosol flow was 2 LPM, resulting a residence time of around 32 s. In addition, to avoid the interferences from NO2 and other absorbing trace
gas species, the blank checks of the CRDS system were performed automatically by turning the 3-way electric valves to the filter direction to measure the bext of the particle-free
ambient air every 2 h.
Validation of the CRDS System
To test the performance of the CRDS system developed during the present work, the optical properties of the monodisperse PSL (Duke Inc.) particles with diameters of 200, 269, 300, 400, 450 and 500 nm were monitored. During the calibration experiment, PSL particles produced by the aerosol generator (Model 3076, TSI Inc., USA), are firstly dried to a low RH (RH < 15%) and then fed into the SMPS system in order to select PSL particles of a certain “dry” size. Afterwards the size-selected PSL particles are first drawn into CRDS and then to the CPC (Model 3022A, TSI Inc., USA) to measure the bext and number concentration
respectively. To expand the detectable particle size range of SMPS system, the PSL particle sample was diluted with filtered air before entering into the CPC. In addition, for each calibration experiment the PSL number concentration at the CRDS inlet and outlet were measured by CPC to calculate the loss of PSL when they pass through the CRDS cavity. The PSL number concentration used in this paper has been corrected by the dilution rate and the loss of PSL along the cavity.
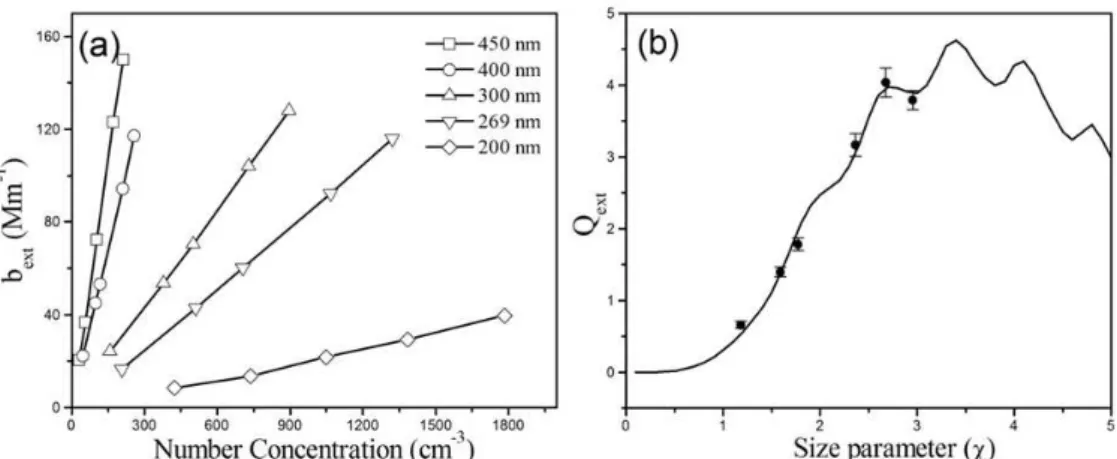
As shown in Fig. 3(a), the measured extinction coefficients show a linear fitting with the number concentration for each PSL particles. According to Fig. 3(a), the extinction efficiency (Qext) of PSL particles at 532 nm can be determined by the
following equation: 2 ( / 4) ext ext b Q N D (3)
where N and D are the particle number concentration and particle diameter, respectively.
Fig. 3(b) shows the Qext of PSL particles as a function of
size parameter χ (χ = πD/λ). Points are determined using the Eq. (3) and the curve is obtained from Mie theory using refractive index of 1.598 + 0.00i reported by Boundy and Boyer (1952). As expected, the measured extinction efficiency values are in good agreement with the theoretical curve, the average deviation between the measured and theoretical Qext is within ± 3%. This result indicates that
our CRDS system, if we do not consider the uncertainty in the size of particles and the particle number density, could measure an extinction coefficient with errors less than 3%.
RESULTS AND DISCUSSION
Extinction Coefficient of the Non-dehydrated Ambient Aerosols
To study the real aerosol optical properties in Orleans, the extinction coefficient of the non-dehydrated ambient aerosols was measured from 26th October to 4th November 2012. As shown in Fig. 4(a), the average (dashed line) and maximum extinction coefficient values during this period were 41 ± 35 and 400 Mm–1. This result is comparable with those observed (Table 1), for example, in Eastern Mediterranean from July 2001 to January 2007 (the average value of bsca (543 nm) and babs (565 nm) are 40.3 ± 27.1
and 5.4 ± 3.7 Mm–1, Kalivitis et al., 2011), and Western Mediterranean from March 2006 to December 2010 (the average value of bsca at 550 nm is 80 ± 50 Mm–1, Esteve et
al., 2012), but much lower than those observed in Tokyo
(the average value of bext at 532 nm is 144.7 ± 85.2 Mm–1,
Nakayama et al., 2010a) and Shanghai (the average value of bsca and babs at 532 nm is 332 ± 217 and 85 ± 60 Mm–1,
Li et al., 2011). Furthermore, it is noteworthy that the air quality during 1st to 4th November period (noted as “clean days”) is much better than the other days. Indeed, further
Fig. 3. (a) Extinction coefficient (bext) at 532 nm measured as a function of particle number concentration of PSL at different
sizes; (b) The extinction efficiency (Qext) as a function of size parameter (χ) of PSL at 532 nm, the curve is obtained from
Fig. 4. (a) Extinction coefficient (bext) of the non-dehydrated ambient aerosols. (b) The air parcel backward trajectories
arriving at 500 m above ground level at Orleans from 26th October to 4th November, 2012.
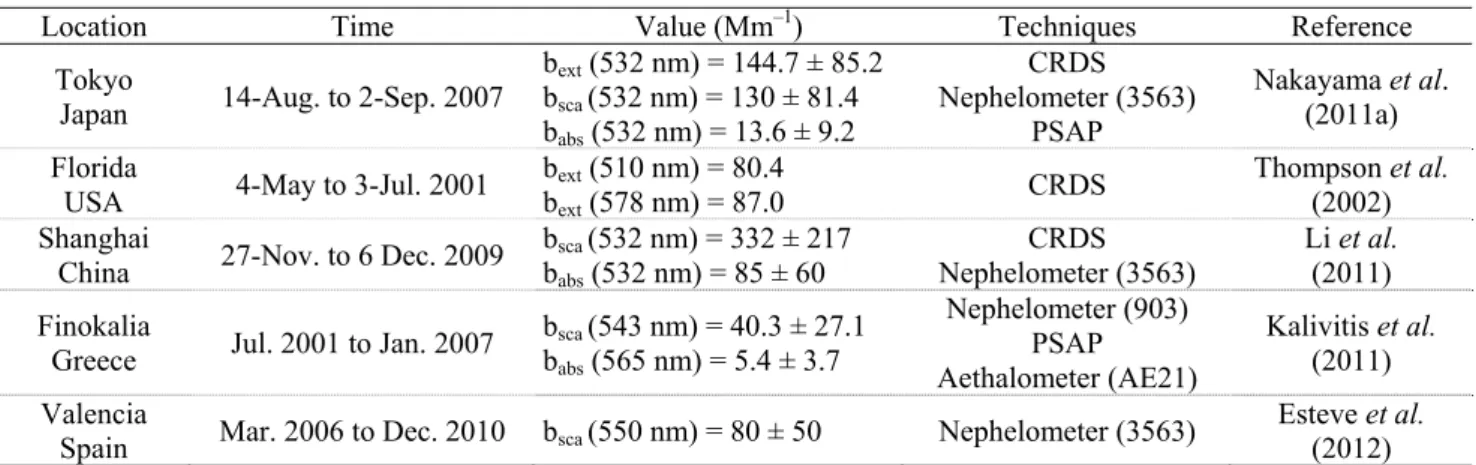
Table 1. Summary of the reported atmospheric aerosol optical property measurement studies.
Location Time Value (Mm–1) Techniques Reference
Tokyo
Japan 14-Aug. to 2-Sep. 2007
bext (532 nm) = 144.7 ± 85.2 bsca (532 nm) = 130 ± 81.4 babs (532 nm) = 13.6 ± 9.2 CRDS Nephelometer (3563) PSAP Nakayama et al. (2011a) Florida
USA 4-May to 3-Jul. 2001
bext (510 nm) = 80.4
bext (578 nm) = 87.0 CRDS
Thompson et al. (2002) Shanghai
China 27-Nov. to 6 Dec. 2009
bsca (532 nm) = 332 ± 217 babs (532 nm) = 85 ± 60 CRDS Nephelometer (3563) Li et al. (2011) Finokalia
Greece Jul. 2001 to Jan. 2007
bsca (543 nm) = 40.3 ± 27.1 babs (565 nm) = 5.4 ± 3.7 Nephelometer (903) PSAP Aethalometer (AE21) Kalivitis et al. (2011) Valencia
Spain Mar. 2006 to Dec. 2010 bsca (550 nm) = 80 ± 50 Nephelometer (3563)
Esteve et al. (2012) analysis reveals that the average bext for the “clean days” is
only 10 ± 7 Mm–1, about 6 times lower than that observed from 26th to 31st October 2012.
Fig. 4(b) displays the air parcel backward trajectory curves (calculated by HYSPLIT trajectory model, NOAA, http://ready.arl.noaa.gov/HYSPLIT.php) during the sampling time over Orleans. It can be noticed that the air parcel comes from the Atlantic Ocean for the “clean days”, while
it comes from interior regions for the other days. This result suggests that the air parcel transported from Atlantic Ocean may improve the air quality of Orleans through advection or wet deposition.
Size Distribution and Extinction Coefficient of the Dehydrated Ambient Aerosols
and volume (V) concentration of the dehydrated ambient aerosols from 7th November to 21st December, 2012 in Orleans. It can be seen that the extinction coefficient exhibit the same trend with the particle number and volume concentration during the whole observation period. The average values of bext, N and V were 36 ± 31 Mm–1, 3300 ±
2700 cm–3 and 3.1 ± 2.8 × 10⁹ nm3/cm3, respectively. Moreover, the correlation plots of bext with particle number
concentration (10.7 nm < Dp < 487.3 nm and 100 nm < Dp <
487.3 nm) were presented as an inset in Fig. 5(b). It reveals that the correlation of bext with the number concentration for
particles larger than 100 nm (100 nm < Dp < 487.3 nm, R =
0.89) is better than that with the total particle number concentration (10.7 nm < Dp < 487.3 nm, R = 0.69). During
these measurements, 15th and 16th December were selected
as the “clean days”, the average bext, N and V for these two
days are only 7 ± 3 Mm–1, 1100 ± 500 cm–3 and 3.8 ± 2.5 × 10⁸ nm3/cm3, respectively, about 6, 3 and 9 times lower than that of the other days. However, it can be clearly observed that on 24th November the values measured for the extinction coefficient (622 Mm–1), number concentration (38000 cm–3) and volume concentration (5.2 × 10¹⁰ nm3/cm3) were higher compared to the other days. This typical event will be discussed in details later.
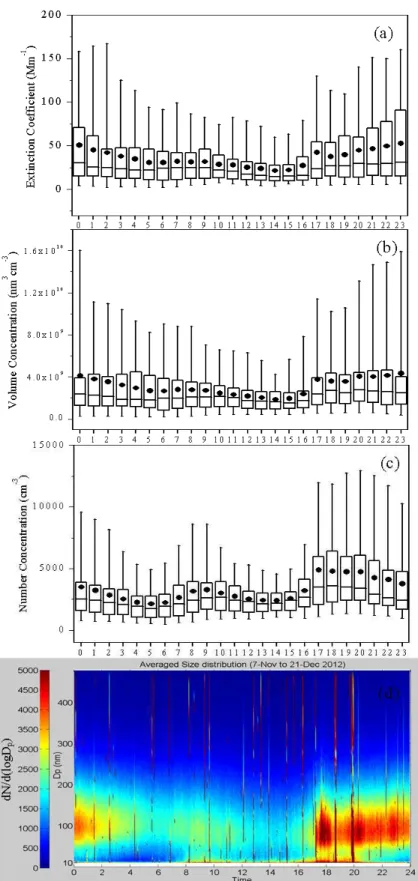
Figs. 6(a), 6(b) and 6(c) show the statistic diurnal variation of the bext, V and N. In this “box” diagrams, the mean is
represented by dots. The dividing segment in the box is the median. The top box limit represents the 75th percentile and the bottom box limit represents the 25th percentile. The error bars are related to the percentiles 95th and 5th. In these
Fig. 5. (a) Extinction coefficient, (b) number and (c) volume concentration of the dehydrated ambient aerosols in Orleans
Fig. 6. (a) Statistic diurnal variation of the particle extinction coefficient. (b) Statistic diurnal variation of the particle
volume concentration. (c) Statistic diurnal variation of the particle number concentration. (d) One-day averaged particle size distribution derived from 7th November to 21st December, 2012.
figures, bext and V show a similar trend. Furthermore, bext,
V and N exhibit a clear daily pattern, with two peaks at 9:00 and 17:00 hrs. This daily variability is typical of urban areas,
and is mostly due to the car emissions during the rush hours (Esteve et al., 2012). In addition, it is important to note that bext and V express a clear increase trend even after
the second rush hour (19:00 to 24:00), while N decreases during this period. A reasonable explanation for this result is that the particle size is larger during the night time.
To further explain the diurnal variation of bext, V and N,
one-day averaged particle size distribution derived from 7th November to 21st December, 2012 is presented in Fig. 6(d). As expected, two high particle concentration events with particle size less than 40 nm were observed at 9:00 and 18:00, which confirms that, during the day time, car emissions are the main source of ambient aerosols near the measurement site. During the night, the concentrations of
the large particles (≈ 100 nm) increased abruptly at 18:00 and this high concentration persisted until midnight. That is why bext and V express a clear increase trend even after
the second rush hour (19:00 to 24:00). It is believed that the most possible source of these large particles could be the residential heating in the area.
During the measurements, a typical episode (Fig. 5), i.e., a sharp clean process, was observed on 24th November (Saturday). As it can be seen in Figs. 7(a) and 7(b), bext, V
and N only express one peak during this weekend, and the maximum values reached up to 622 Mm–1, 5.2 × 10¹⁰ nm3/cm3
Fig. 7. (a) Extinction coefficient, volume and number concentration of the dehydrated ambient aerosols. (b) Size distribution
of the dehydrated ambient aerosols. (c) The air parcel backward trajectories arriving at 500 m above ground level at Orleans from 24th to 25th November, 2012.
and 38000 cm–3, respectively, at 17:40. Interestingly, unlike the results expressed in Fig. 6(d), this high pollution event did not persist during the whole night, bext ,V and N
decreasing dramatically to 39 Mm–1, 4.7 × 10⁹ nm3/cm3 and 4700 cm–3 only 50 minutes later. Further analysis of this clean process was conducted by looking at the air parcel backward trajectory curves during this weekend (Fig. 7(c)). This figure shows that the air parcel over Orleans shifts clearly from interior regions to Atlantic oceans after 17:00
(UTC time, corresponding to 18:00 in Orleans). This result further indicates that the air parcel transported from Atlantic Ocean could play a role in “cleaning up” the air over the measurements site area.
Typical Analysis the Cleaning-effect of Atlantic Air Parcel
Fig. 8(a) illustrates the aerosol extinction coefficient, particle number and volume concentration and PM10
concentration measured from 8th to 21st December 2012. It
Fig. 8. (a) Extinction coefficient, number concentration, volume concentration and PM10 concentration of the dehydrated
ambient aerosols. (b) Size distribution of the dehydrated ambient aerosols. (c) The air parcel backward trajectories arriving at 500 m above ground level at Orleans from 8th to 21st December, 2012.
shows that the aerosol extinction coefficient exhibits the same trend with PM10 (R = 0.79, the inset plot in Fig. 8(a)),
particle volume and number concentration. However, in some special conditions (brown cycle marked in Fig. 8(a)), no clear change was observed for bext and even particle
number concentration exhibits a small peak. Deep analysis reveals that all those peaks occur in the rush hour, particles from car emissions are too small (less than 40 nm, Fig. 8(b)) to increasing the bext.
As shown in Figs. 8(a) and 8(b), there are some clean days during this period, such as 14–17, 20 December, 2012. Fig. 8(c) gives the air parcel backward trajectories curves during this period over Orleans. As expected, the air parcel comes from the Atlantic oceans for all those clean days, while from interior regions for the other days. This confirms the previous hypothesis of the cleaning effect of air parcel transported from Atlantic Ocean.
CONCLUSIONS
In this study, a pulsed CRDS instrument for measuring extinction coefficient of atmospheric aerosols was developed. The instrument was validated using monodisperse PSL particles. Meantime, size distribution and optical properties of ambient aerosols were measured from 26th October to 21st December, 2012 in Orleans, France, by using a SMPS coupled to the developed CRDS system. For the non-dehydrated aerosols, the average extinction coefficient at 532 nm is 41 ± 35 Mm–1. For the dried aerosols, extinction coefficient expresses a good agreement with the particle number and volume concentration, and the average values of bext, N and V are 36 ± 31 Mm–1, 3300 ± 2700 cm–3 and 3.1
± 2.8 × 10⁹ nm3/cm3, respectively. One-day averaged particle size distribution derived from 7th November to 21st December, 2012 reveals that vehicle and boiler emissions maybe the main ambient aerosol sources near this specific measurement site. In addition, we found that the air parcel was coming from the Atlantic oceans for all clean days, while it was from interior regions for the other days, implying the air parcel transported from Atlantic Ocean could clean the air of Orleans city.
ACKNOWLEDGMENTS
This work was supported by FP7 project (AMIS, No.PIRSES-GA-2011), Region Centre-France and Labex VOLTAIRE (ANR-10-LABX-100-01). Dawei Hu thanks Shanghai Tongji Gao Tingyao Environmental Science & Technology Development Foundation for a fellowship support.
REFERENCES
Baynard, T., Lovejoy, E.R., Pettersson, A., Brown, S.S., Lack, D., Osthoff, H., Massoli, P., Ciciora, S., Dube, W.P. and Ravishankara, A.R. (2007). Design and Application of a Pulsed Cavity Ring-Down Aerosol Extinction Spectrometer for Field Measurements. Aerosol Sci.
Technol. 41: 447–462.
Boundy, R.H. and Boyer, R.F. (1952). Its Polymers, Copolymers and Derivatives, Reinhold Publishing Corporation, New York.
Bryant, C., Eleftheriadis, K., Smolik, J., Zdimal, V., Mihalopoulos, N. and Colbeck, I. (2006). Optical Properties of Aerosols Over the Eastern Mediterranean.
Atmos. Environ. 40: 6229–6244.
Bulatov, V., Fisher, M. and Schechter, I. (2002). Aerosol Analysis by Cavity-Ring-Down Laser Spectroscopy,
Anal. Chim. Acta 466: 1–9.
Charlson, R.J., Schwartz, S.E., Hales, J.M., Cess, R.D., Coakley J.A., Hansen, J.E. and Hofmann, D.J. (1992). Climate Forcing by Anthropogenic Aerosols. Science 255: 423–430.
Esteve, A.R., Estelles, V., Utrillas, M.P. and Martinez-Lozano, J.A. (2012). In-Situ Integrating Nephelometer Measurements of the Scattering Properties of Atmospheric Aerosols at an Urban Coastal Site in Western Mediterranean. Atmos. Environ. 47: 43–50.
Fu, Q.Y., Zhuang, G.S., Li, J.A., Huang, K., Wang, Q.Z., Zhang, R., Fu, J., Lu, T., Chen, M., Wang, Q.A., Chen, Y., Xu, C. and Hou, B. (2010). Source, Long-range Transport, and Characteristics of a Heavy Dust Pollution Event in Shanghai. J. Geophys. Res. 115: D00K29.
Han, S.Q., Bian, H., Zhang, Y.F., Wu, J.H., Wang, Y.M., Tie, X.X., Li, Y.H., Li, X.J. and Yao, Q. (2012). Effect of Aerosols on Visibility and Radiation in Spring 2009 in Tianjin, China. Aerosol Air Qual. Res. 12: 211–217. Haywood, J.M. and Shine, K.P. (1997). Multi-spectral
Calculations of the Direct Radiative Forcing of Tropospheric Sulphate and Soot Aerosols Using a Column Model. Q. J. R. Meteorolog. Soc. 123: 1907–1930. Heim, M., Kasper, G., Reischl, G.P. and Gerhart, C.
(2004). Performance of a New Commercial Electrical Mobility Spectrometer. Aerosol Sci. Technol. 38: 3–14. Huang, K., Zhuang, G., Lin, Y., Fu, J.S., Wang, Q., Liu, T.,
Zhang, R., Jiang, Y., Deng, C., Fu, Q., Hsu, N.C. and Cao, B. (2012). Typical Types and Formation Mechanisms of Haze in an Eastern Asia Megacity, Shanghai. Atmos.
Chem. Phys. 12: 105–124.
Kalivitis, N., Bougiatioti, A., Kouvarakis, G. and Mihalopoulos, N. (2011). Long Term Measurements of Atmospheric Aerosol Optical Properties in the Eastern Mediterranean. Atmos. Res. 102: 351–357.
Kang, H.Q., Zhu, B., Su, J.F., Wang, H.L., Zhang, Q.C. and Wang, F. (2013). Analysis of a Long-lasting Haze Episode in Nanjing, China. Atmos. Res. 120: 78–87. Kaufman, Y.J., Koren, I., Remer, L.A., Rosenfeld, D. and
Rudich, Y. (2005). The Effect of Smoke, Dust, and Pollution Aerosol on Shallow Cloud Development over the Atlantic Ocean. Proc. Nat. Acad. Sci. U.S.A. 102: 11207–11212.
Khalizov, A.F., Xue, H.X., Wang, L., Zheng, J. and Zhang, R.Y. (2009). Enhanced Light Absorption and Scattering by Carbon Soot Aerosol Internally Mixed with Sulfuric Acid. J. Phys. Chem. A 113: 1066–1074.
Khalizov, A.F., Lin, Y., Qiu, C., Guo, S., Collins, D. and Zhang, R.Y. (2013). Role of OH-initiated Oxidation of Isoprene in Aging of Combustion Soot. Environ. Sci.
Technol. 47: 2254–2263.
Langridge, J.M., Richardson, M.S., Lack, D., Law, D. and Murphy, D.M. (2011). Aircraft Instrument for Comprehensive Characterization of Aerosol Optical Properties, Part I: Wavelength-dependent Optical Extinction and Its Relative Humidity Dependence Measured Using Cavity Ringdown Spectroscopy. Aerosol
Sci. Technol. 45: 1305–1318.
Lang-Yona, M., Rudich, Y., Segre, E., Dinar, E. and Abo-Riziq, A. (2009). Complex Refractive Indices of Aerosols Retrieved by Continuous Wave-Cavity Ring Down Aerosol Spectrometer. Anal. Chem. 81: 1762–1769. Li, L., Chen, J.M., Chen, H., Yang, X., Tang, Y. and Zhang,
R.Y. (2011). Monitoring Optical Properties of Aerosols with Cavity Ring-Down Spectroscopy. J. Aerosol. Sci. 42: 277–284.
Li, L., Chen, J.M., Wang, L., Mellouki, W. and Zhou, H.R. (2013). Aerosol Single Scattering Albedo Affected by Chemical Composition: An Investigation Using CRDS Combined with MARGA. Atmos. Res. 124: 149–157. Moosmuller, H., Varma, R. and Arnott, W.P. (2005).
Cavity Ring-down and Cavity Enhanced Detection Techniques for the Measurement of Aerosol Extinction.
Aerosol Sci. Technol. 39: 30–39.
Nakayama, T., Hagino, R., Matsumi, Y., Sakamoto Y., Kawasaki, M., Yamazaki, A., Uchiyama, A., Kudo, R., Moteki, N., Kondo, Y. and Tonokura, K. (2010a). Measurements of Aerosol Optical Properties in Central Tokyo During Summertime Using Cavity Ring-Down Spectroscopy: Comparison with Conventional Techniques.
Atmos. Environ. 44: 3034–3042.
Nakayama, T., Matsumi, Y., Sato, K., Imamura, T., Yamazaki, A. and Uchiyama, A. (2010b). Laboratory Studies on Optical Properties of Secondary Organic Aerosols Generated during the Photooxidation of Toluene and the Ozonolysis of Alpha-pinene. J. Geophys. Res. 115: D24204.
Nakayama, T., Sato, K., Matsumi, Y., Imamura, T., Yamazaki, A. and Uchiyama, A. (2012). Wavelength Dependence of Refractive Index of Secondary Organic Aerosols Generated during the Ozonolysis and Photooxidation of Alpha-pinene. SOLA 8: 119–123. Park, S.S. and Cho, S.Y. (2013). Characterization of
Organic Aerosol Particles Observed During Asian Dust Events in Spring 2010. Aerosol Air Qual. Res. 13: 1019–1033.
Park, S.S., Jung, S.A., Gong, B.J., Cho, S.Y. and Lee, S.J. (2013). Characteristics of PM2.5 Haze Episodes Revealed
by Highly Time-resolved Measurements at an Air Pollution MonitoringSupersite in Korea. Aerosol Air
Qual. Res. 13: 957–976.
Pettersson, A., Lovejoy, E.R., Brock, C.A., Brown, S.S. and Ravishankara, A.R. (2004). Measurement of Aerosol Optical Extinction at 532 nm with Pulsed Cavity Ring Down Spectroscopy. J. Aerosol. Sci. 35: 995–1011. Qiu, C., Khalizov, A.F. and Zhang, R.Y. (2012). Soot
Aging from OH-initiated Oxidation of Toluene.
Environ. Sci. Technol. 46: 9464–9472.
Radney, J.G., Bazargan, M.H., Wright, M.E. and Atkinson,
D.B. (2009). Laboratory Validation of Aerosol Extinction Coefficient Measurements by a Field-deployable Pulsed Cavity Ring-down Transmissometer. Aerosol Sci. Technol. 43: 71–80.
Redmond, H. and Thompson, J.E. (2011). Evaluation of a Quantitative Structure Property Relationship (QSPR) for Predicting Mid-visible Refractive Index of Secondary Organic Aerosol (SOA). Phys. Chem. Chem. Phys. 13: 6872–6882.
Riziq, A.A., Erlick, C., Dinar, E. and Rudich, Y. (2007). Optical Properties of Absorbing and Non-absorbing Aerosols Retrieved by Cavity Ring Down (CRD) Spectroscopy. Atmos. Chem. Phys. 7: 1523–1536.
Sakamoto, Y., Yabushita, A., Kawasaki, M., Nakayama, T. and Matsumi, Y. (2009). Optical Properties and Chemical Compositions of Iodine-containing Aerosols Produced from the Atmospheric Photolysis of Methylene Iodide in the Presence of Ozone. Bull. Chem. Soc. Jpn 82: 910–913. Seinfeld, J.H. and Pandis, S.N. (2006). Atmospheric
Chemistry and Physics, John Wiley and Sons Inc., New
York.
Smith, J.D. and Atkinson, D.B. (2001). A Portable Pulsed Cavity Ring-Down Transmissometer for Measurement of the Optical Extinction of the Atmospheric Aerosol.
Analyst 126: 1216–1220.
Strawa, A.W., Castaneda, R., Owano, T., Baer, D.S. and Paldus, B.A. (2003). The Measurement of Aerosol Optical Properties Using Continuous Wave Cavity Ring-Down Techniques.J. Atmos. Oceanic Technol. 20: 454–465.
Strawa, A.W., Elleman, R., Hallar, A.G., Covert, D., Ricci, K., Provencal, R., Owano, T.W., Jonsson, H.H., Schmid, B., Luu, A.P., Bokarius, K. and Andrews, E. (2006). Comparison of In Situ Aerosol Extinction and Scattering Coefficient Measurements Made during the Aerosol Intensive Operating Period. J. Geophys. Res. 111: D05S03. Thompson, J.E., Smith, B.W. and Winefordner, J.D. (2002). Monitoring Atmospheric Particulate Matter through Cavity Ring-Down Spectroscopy. Anal. Chem. 74: 1962–1967. Vrekoussis, M., Liakakou, E., Kocak, M., Kubilay, N.,
Oikonomou, K., Sciare, J. and Mihalopoulos, N. (2005). Seasonal Variability of Optical Properties of Aerosols in the Eastern Mediterranean. Atmos. Environ. 39: 7083– 7094.
Wang, W.J., Cheng, T.T., Zhang, R.J., Jia, X.A., Han, Z.W., Zhang, X.L., Xu, X.F. and Li, D.P. (2012). Insights into an Asian Dust Event Sweeping Beijing during April 2006: Particle Chemical Composition, Boundary Layer Structure, and Radiative Forcing. J. Geophys. Res.115: D18208.
Xue, H.X., Khalizov, A.F., Wang, L., Zheng, J. and Zhang, R.Y. (2009). Effects of Dicarboxylic Acid Coating on the Optical Properties of Soot. Phys. Chem. Chem. Phys. 11: 7869–7875.
Yang, F., Chen, H., Du, J.F., Yang, X., Gao, S., Chen, J.M. and Geng, F.H. (2012). Evolution of the Mixing State of Fine Aerosols during Haze Events in Shanghai. Atmos.
Res. 104: 193–201.
Zarzana, K.J., De Haan, D.O., Freedman, M.A., Hasenkopf, C.A. and Tolbert, M.A. (2012). Optical Properties of the
Products of Alpha-dicarbonyl and Amine Reactions in Simulated Cloud Droplets. Environ. Sci. Technol. 46: 4845–4851.
Zhang, R.Y., Khalizov, A.F., Pagels, J., Zhang, D., Xue, H.X. and McMurry, P.H. (2008). Variability in Morphology, Hygroscopicity, and Optical Properties of Soot Aerosols during Atmospheric Processing. Proc. Nat. Acad. Sci.
U.S.A. 105: 10291–10296.
Zhang, R.Y., Khalizov, A., Wang, L., Hu, M. and Xu, W. (2012). Nucleation and Growth of Nanoparticles in the Atmosphere. Chem. Rev. 112: 1957–2011.
Received for review, July 18, 2013 Accepted, November 12, 2013