Determination of Orientation in Aromatic
Polyesters
by
David C. Oda
Submitted to the Department of Chemical
Engineer-ing in partial fulfillment of the requirements for the
degree of
Doctor of Philosophy in Chemical Engineering
at the
MASSACHUSETTS INSTITUTE OF TECHNOLOGY
June 1998
©
Massachusetts Institute of Technology, 1998. All Rights
Reserved.
A u th o r ...
Department of Chemical Engineering
May 20th, 1998
C ertified by
...
/
(,regory
Cv
C. Rutledge
Associate Professor of Chemical Engineering
Thesis Supervisor
Accepted by
...
Robert E. Cohen
St. Laurent Professor of Chemical Engineering
Chairman, Committee of Graduate Students
JUL 0a9
9
W006lc~
Determination of Orientation in Aromatic Polyesters
by
David C. Oda
Submitted to the Department of Chemical Engineering on May 20th, 1998, in partial fulfillment of the requirements for the degree of Doctor of Philosophy in Chemical Engineering
Abstract
We have investigated the molecular scale orientation of two aromatic polyester ("polyarylate") systems using Wide Angle X-ray Scattering (WAXS) and Differential Scanning Calorimetry (DSC). The polyarylates studied were: poly(ethylene terephthalate) (PET) and the random terpolyester of hydroxybenzoic acid (HBA), isophthalic acid (IA), and hydroquinone (HQ) (abbreviated HIQ-x, where x is the mole percentage of HBA). Sample morphologies analyzed included unoriented bulk powders, axially symmetric fibers, and plane-strain deformed specimens which displayed three-dimensional scattering anisotropy.
A methodology for the analysis of multi-dimensional WAXS patterns is delineated. The method includes Gaussian deconvolution of the full experimental pattern to separate crystalline and non-crystalline portions. Analysis of the molecular orientation of the non-non-crystalline portion of the pattern is completed by series expansion using spherical harmonic terms and their coefficients. The series expansion allows us to separate the orientation from the structure factor contributions of the WAXS pattern. Each contribution can then be separately analyzed. To quantitatively characterize the orientation in a sample, molecular-scale simulations are conducted. Our model utilizes a Rotational Isomeric States (RIS) algorithm to simulate polymer chains which are then randomly placed on a 2-D lattice using a Monte Carlo (MC) sampling technique. Since we are modeling the non-crystalline phase, an ensemble of structures is required for the structure factor determination. The calculated structure factors are compared to their experimental counterparts to determine the orientation distribution function (ODF) of the molecular ensemble. The ODF offers a quantitative and concise method of characterizing the distribution of orientations that the generated molecular ensemble populates within the sample.
Our studies have shown that the oriented non-crystalline portion of these polyarylate materials is significant. Both the HIQ-40 fibers and plane-strain PET specimens studied showed more than 70% of the total material was oriented. This has major implications for the molecular modeling of these polymeric systems and their properties. Separating the 3-D WAXS pattern into its
constituents allows us to quantitatively identify the amount of the various phases in any given sample. Our results indicate that in addition to the crystalline and isotropic amorphous phases
present in these samples, there is also a substantial oriented non-crystalline phase as well. This implies the necessity of a three phase model to properly analyze the data. We also draw
conclusions on the differences that mechanical and thermal processing have on orientation in our polyarylate materials. Our results show that thermal processing perfects orientation which has been initially established by mechanical deformation. Our results also show that in the non-crystalline phase a local packing structure is established upon initial mechanical deformation. This local structure remains intact through the thermal processing steps.
Thesis Supervisor: Gregory C. Rutledge
To the Past and those who came before me, my great-grandparents:
Leong Boo
Leong Ching Ling Kong Fat Chun Margaret Chun
and
Emma Penny Bessho
And to the Future and those who shall walk with me,
My dearest Heart
Lisa Chalfin
"Et si pulcra et delectabilis est consideratio que dicta est, hec longe est pulcrior et delectabilior, .. " ("And if our deliberations to this point have been beautiful and delightful, the matters now to be considered are far more beautiful and delightful, ...")
- Roger Bacon, Perspectiva, Part I,
Acknowledgments
I think that it goes without saying, that a document of this size does not get produced by one person alone. While, I am the messenger and the mouthpiece, there are many who contributed to this thesis. First and foremost, I would like to thank my advisor, Prof. Greg Rutledge. His ideas are always thought provoking, his guidance always subtle, yet steady. To my thesis committee, Profs. Armstrong, Cohen, and Thomas, thank you for your support and input. A special thanks is extended to Prof. Cohen, without whose WAXS I could have accomplished nothing. To Drs. Anuj Bellare, Zbigniew Bartczak, and Heimo Schnablegger, you have all helped me immensely in my journey and likely have forgotten more about WAXS than I will ever know.
Having that said, there is more to life than Thesis. My deepest acknowledgment must be given to Lisa. Without whom, I would be nothing. With whom, I have everything. I know that there is nothing more in the world that I want than to spend the rest of my life with you. You've always been supportive, generous and light of my life. I would never have made it without you. To Rog, ever are we linked by the true bond of bears and hockey. Thanks for making day-to-day life livable. To Matt, ever are we linked by the true bond of P-school and ski poles. Flippant minds think alike. To the both of you, I couldn't have gotten better friends to room with nor better roommates to bond with. I must, of course, thank Roy, Harsono, and Angelo for too many things: the late night debates, the lunch-time antics, the sectoids, the
Ren Faires, the philosophy, and the humanity of it all. I am sure that the Four Horsemen ride together again (though likely only in CA). To Silvio, Jon, and Suman
... Poker? To the practice school crowd, Chris, Fred and Matt, it was more than a job, it was an adventure. I'm glad that I went through it with you guys. To Radha and Antonia, thanks for putting up with me when Matt and I hang around with Fred and Chris.
To the support staff, whom I will always consider family. Thanks to "Mom," Carol Phillips, without whom I think the department come to a stand still. Always listen to your mother. To my big sisters, Janet and Elaine, thanks for ensure that I never got lost amidst the sea of red tape. To aunty Arline, thank you for making sure that my cuff links were straight and my eyes on the prize. To Bhengy, Ellen, Linda, and Liz, it has been wonderful to work with you. I also wish to thank my groupmates. To Hans and Jeff, thanks for starting down the path with me. To Fred, Mike, and especially Ming, thanks for the discussions on virtually every topic you can think of.
I can always count on you guys to listen to me ramble on. To Shawn, Peter, John, Anil, Anjali, Sudhakar, Weining, and Dan, may the wind always whisper in your ears and the sun always light your way.
Friends and family are always essential for keeping Despair and Insanity at bay. I have crossed paths with many people outside MIT and it is with deepest felt thanks that I can offer only a small token of appreciation. To Jere, there will always be a place set for you at my table, always an ear for your discussions. To Tyler, and Charles, we've been through a lot together. Keep the home fires burning. To Jess, Phil, Adam and Kyle, we pass the torch to you. To all of the Ars crowd, thanks for letting Constantine have voice and purpose. To Jake, take care of yourself and Trav. Lastly, to all of my family without whom I would not be here, you have my eternal gratitude. To my mother and father, thank you for pushing me to excel. To my grandparents, thank you for showing me the path of persistence and morality. To Lavonne, without whom my generation would have been dull and the trip to
Europe even duller.
Table of Contents
1 Intro d uctio n ... 2 3
1 .1 M o tiv a tio n ... 2 3
1.2 S tate of the A rt ... 26
1.2.1 Aromatic Polyesters: Polyarylates ... . 26
1.2.2 Defining the Role of Processing... ... 27
1.2.2.1 The C hannel D ie ... ... 28
1.2.2.2 Post-synthesis Processing ... . 29
1.2.2.2.1 Mechanical and Orientational Bias ... 29
1.2.2.2.2 Thermal Treatment or Annealing ... 30
1.3 Materials: HIQ-x and PET ... ... 30
1.3 .1 H IQ -x ... 3 1 1.3.1.1 Sub-motivation: Problems with Kevlartm ... 31
1.3.1.2 Liquid C rystallinity ... 31
1.3.1.3 Literature: HIQ-x ... ... 33
1.3.1.4 HSHM Behavior ... ... 36
1.3.1.4.1 Scattering Analyses of HIQ-x... 37
1.3.1.4.2 HIQ-x Characterization by Other Methods... 39
1.3.1.4.3 Simulation Studies ... 39
1.3.2 PET .... ... 40
1 .3 .2 .1 L ite ratu re ... 4 1 1.3.2.1.1 Crystallization/Thermal Behavior ... 41
1.3.2.1.2 WAXS Characterization of PET ... 43
1.3.3 Orientational Studies on Other Polymeric Systems ... 44
1.4 Experimental Analysis Techniques ... ... . 45
1.4.1 WAXS: 2-D and 3-D ... 45
1.4.1.1 G eneral Theory ... 46
1.4.1.2 Interpretations of Experimental WAXS Data ... 47
1.4.1.2.1 Distributions in 20: Elements in Line Broadening ... ... 48
1.4.1.2.2 Distributions in Polar Angles: Spherical Harmonics (Polynomials) ... ... 49
1.4.1.3 WAXS Summary ... 49
1 .4 .2 D S C ... ... 5 0 1.5 S um m ary ... 50
1.6 Thesis O rganization ... ... .... 52
2 The Spherical Harmonic Series Expansion Analysis... 53
2.1 Purpose ... ... 53
2.1.1 M ethodology ... 55
2.1.2 Sample Legendre Analysis ... .... . 57
2.2 Experimental Data Analysis ... ... 58
2.2.1 Semi-Quantitative Interpretations of the P2n(cosx) Functional Fo rm s ... 6 2 2.2.2 2-D WAXS Data Visualization: Fiber Diagrams ... 63
2.2.3 Case Study: HIQ-40 As-spun Solution-spun Fiber: Experimental Results ... 64
2.2.3.2 Normalization ... ... 66
2.3 The Molecular Model ... ... 69
2.3.1 Single Chain: Rotational Isomeric States (RIS) ... 69
2.3.1.1 Intrachain Parameters... 71
2.3.2 Lattices: Monte Carlo Sampling ... 71
2.3.2.1 Interchain Parameters ... 74
2.3.3 Alterations and Modifications to the Rutledge Code ... 75
2.3.4 Distortions and Paracrystalline Considerations ... 76
2.3.5 Structure Factor Calculations ... 77
2.3.6 Structure Acceptance Criteria for the Ensemble ... .... ... 79
2.3.6.1 Configuration Acceptance in Monte Carlo Sampling...79
2.3.6.2 Hard Sphere Overlaps: Kvdw ... 79
2.3.6.3 Measure of Merit ... 82
2.3.7 Model Heuteristics: Getting a good first guess ... 85
2.3.7.1 Some Nuances of the Molecular Model ... 86
2.3.8 Simple Examples of the Structure Factor Calculation ... 87
2.3.8.1 Single C hain ... ... 87
2.3.8.2 Simple Points/Atoms on a Lattice ... ... 89
2.3.8.3 Real Chains/Molecules on a Lattice ... 91
2.3.9 Parametric Evaluations ... 92
2.3.9.1 Single chain behavior ... .93
2.3.9.2 Lattice Parameters ... 94
2.3.10 Modeling Results and Discussion: hiq40fsa Fibers... 95
2.3.10.1 The Isotropic Trace ... 96
2.3.10.2 ODF Scaling Factors ... 99
2.4 Discussion of Case Study Results ... 101
2.5 Chapter Summary and Conclusions... 103
3 2-D Analysis Case Study: HIQ-40 Fibers... 105
3.1 Introduction ... 105
3.1.1 Experimental Processing: Fiber Spinning ... 105
3.2 Experimental ... ... 107
3.2.1 Fiber Sources ... ... 107
3.2.2 Optical Microscopy: Physical Characterization of the Polymer Samples ... 107
3.2.3 Thermal Characterization: DSC ... 108
3.2.4 WAXS Characterization Parameters and Procedures... 109
3.2.5 The Crystalline Phase Contribution ... 109
3.2.6 Visualization of WAXS Data... 112
3.3 Characterization Results: Expectations and Observations ... 113
3.3.1 Optical Microscopy Results ... 113
3.3.2 DSC Results ... 116
3.3.3 WAXS Results: Experimental Data and its Representations and A nalysis ... 118
3.3.3.1 Qualitative Results: Description and Salient Features ... 127
3.3..4.1 Coefficient Modeling and Theoretical Calculations ... 132
3.3.5 Modeling Comparisons ... 133
3.3.6 Modeling Results ... 134
3.3.6.1 Orientation Distribution Functions (ODFs) ... 134
3.3.7 Ensemble Comparisons ... 135
3.3.7.1 Iso-structural A nalysis ... 136
3.4 Discussion of Results ... 140
3.4.1 3-Phase Model ... ... ... 140
3.4.2 Comparisons of Series of Data ... 141
3.5 Chapter Conclusions and Interpretations ... 142
4 3-D Analysis: Plane-Strain Deformed PET ... 145
4.1 Motivation and Objectives ... 145
4.1.1 Objectives... 146
4.2 Experim ental Processing ... ... 146
4.2.1 Channel Die ... 147
4.2.1.1 Heated Press... 147
4.2.1.2 Sample Production and Processing Parameters ... 148
4.2.2 Sample Characterization ... 149
4.2.3 3-D WAXS Data Visualization: Pole Figures and 3-D Spatial D iagram s ... ... 150
4.2.3.1 Pole Figure Stereographic Projections ... ... 150
4.2.3.2 Three Spatial Dimension Data Sets: The 3-D WAXS Pattern ... 151
4.2.4 Differential Scanning Calorimetry, DSC ... 155
4.3 Characterization Results ... 156
4 .3 .1 D S C ... .15 7 4.3.2 WAXS: Experimental Data Set ... 158
4.3.2.1 PET190SC: 3-D WAXS Pattern ... 159
4.3.3 Reference Plaque: Purely Amorphous Sample... 161
4.4 Experim ental W AXS Results ... 163
4.4.1 Pre-processing the 3-D WAXS diagrams ... ... 163
4.4.1.1 Accounting for the Crystalline Phase ... 164
4.4.1.2 Incoherent (Compton) and Electron Gas (Self-) Scatter ... 166
4.4.1.3 Normalization of the Experimental via the Method of Krogh-Moe ... 166
4.4.2 Spherical Harmonics: Extensions from 2-D to 3-D ... 168
4.4.2.1 General Equations... 168
4.4.2.2 The Role of Symmetry... 170
4.4.2.3 The Orientation Distribution Function (ODF)... 171
4.4.2.4 Semi-Quantitative Interpretations of the Anm(s) traces ... 172
4.4.3 Results of Experimental Leg of Analysis ... 174
4.5 Discussion of Experimental WAXS Results ... 176
4.6 Quantitative Interpretations: PET Simulations... 178
4.6.1.1 Alterations from 2-D Aromatic Polyester Code... 178
4.6.1.2 Incorporation of Ethylene into Mesogen Library... 179
4.6.2 Three-Dimensional Structure Factor Calculation ... 180
4.6.3 Structure Acceptance Criteria ... 181
4.6.4 Parameter Inputs ... 182
4.6.5 Modeling Results ... 183
4.7 Summary and Conclusions ... 191
4.8 Overall Summary and Conclusions ... 192
5 3-D Case Study: Study of Plane-Strain Deformed PET... 193
5.1 Introduction ... 193
5.1.1 PET Processing ... 194
5.2 Experimental ... 196
5.2.1 Sample Production ... 196
5.2.2 Characterization Methods ... 198
5.2.2.1 Differential Scanning Calorimetry (DSC)... 198
5.2.2.2 Muclear Magnetic Resonance (NMR) ... 199
5.2.2.3 Wide-Angle X-ray Scattering (WAXS)... 200
5.2.2.4 Small Angle X-ray Scattering (SAXS) ... 202
5.3 Results ... ... 202
5.3.1 Stress as a Function of Time ... 203
5.3.2 DSC ... 204
5.3.3 NMR ... ... 205
5.3.4 WAXS ... 210
5.3.4.1 Crystalline Orientation ... 210
5.3.4.2 Non-crystalline Orientation ... 211
5.3.4.3 Molecular Simulations and ODF Determinations ... 217
5.3.5 SAXS ... 222
5.4 Discussion: Stress Relaxation and Recovery Mechanisms ... 227
5.4.1 Summary of Analyses Results ... 227
5.4.2 The Overall Picture... 228
5.5 Conclusions and Chapter Summary... 233
6 C onclusion ... 235
6.1 Sum m ary ... ... 235
6.2 Recommendations of Future Work ... 237
7 References... 241
8 A ppendices ... 247
8.1 13C SMAS-DECODER ... 247
8.1.1 General Theory: Slow-Magic-Angle-Spinning DECODER ... 248
8.1.2 Experimental 13C SMAS-DECODER NMR Procedure ... 249
8.1.3 13C Chemical Shift Tensor for PET... 251
8.1.4 Interpretation of the 1 3C SMAS-DECODER Spectra... 253
8.2 Spherical Harmonics of the First Kind ... 256
8.2.1 Closed Form Expressions for Some Associated Legendre Functions ... 256
8.2.2 Recursion Formulas for the Associated Legendre Functions ... ... 256
8.2.3 Graphical Representations ... 257
8.2.4 References ... 258
8.2.5 Fortran Code for Generating Spherical Harmonics ... 258
8.3 Legendre Polynom ials ... 261
8.3.1 Closed Form Expressions for the First Few Legendre P olynom ials ... 26 1 8.3.2 Recursion Formula for the Legendre Polynomials ... 261
8.3.3 Graphical Representation of the Legendre Polynomials ... 261
8.3 .4 R eferences ... 262
8.3.5 Fortran Code for Generating Legendre Polynomials... 262
8.4 Integer Bessel Functions ... 264
8.4.1 Recursion Formula for Bessel Functions ... 264
8.4.2 References ... 264
8.4.3 Fortran Code for Generating Bessel Polynomials ... 264
8.5 Spherical Bessel Functions (Modified Bessel Functions), jn(x) ... 267
8.5.1 Closed Form Expressions for the First Few Spherical Bessel Functions ... 267
8.5.2 Recursion Formula for Spherical Bessel Functions ... 267
8.5.3 Graphical Representations of Spherical Bessel Functions ... 267
8 .5 .4 R efe rences ... 268
8.5.5 Fortran Code for Generating Modified Bessel Functions ... 268
8.6 Code for Structure Factor Calculations ... 2... 70
8.6.1 2-D Structure Factor Calculation ... 270
List of Figures
Figure 1.1: Schematics of common processing symmetries a) axisymmetric or cylindrical requiring two variables (r,a) to characterize b) three-dimensional symmetry requiring three variables (r,a , ) ... ... 27
Figure 1.2: Schematic for channel die geometry showing the 3 orthogonal axes: LD = Load Direction, CD = Constraint Direction, FD = Free Direction ... 28 Figure 1.3: Schematic of the 3 constituents of HIQ-x: 1,4-hydroxybenzoic acid (HBA),
isophthalic acid (IA), and hydroquinone (HQ) ... ... 34
Figure 1.4: Proposed phase diagram for HIQ-x [from Blundell, MacDonald, and Chivers, 19 89] ... ... ... . 34
Figure 1.5: Plot of specific strength versus specific modulus for various fibers [modified from Adams and Eby, 1987] ... ... 37
Figure 1.6: Survey of literature values for crystallization rates of unoriented PET ... 42
Figure 2.1: Methodology schematic depicting the various steps, factors, and assumptions that enter the analysis. The middle column lists the various parts of the data which are accounted for. The analysis culminates in a correlation of a molecular model to structural information derived via the series expansion
...~~
$
~ .~ ~!
56..$
~.
~
~
o
.~
.... ...... .... 56.56
Figure 2.2: An example of a fiber diagram showing broad and narrow features. The sample is HIQ-40 unannealed solution-spun fiber ... 63
Figure 2.3: Compton scattering, lcomp, and the self-scattering summation, f2, as
functions of the scattering vector, s, where s = 4nsin/. ... 65
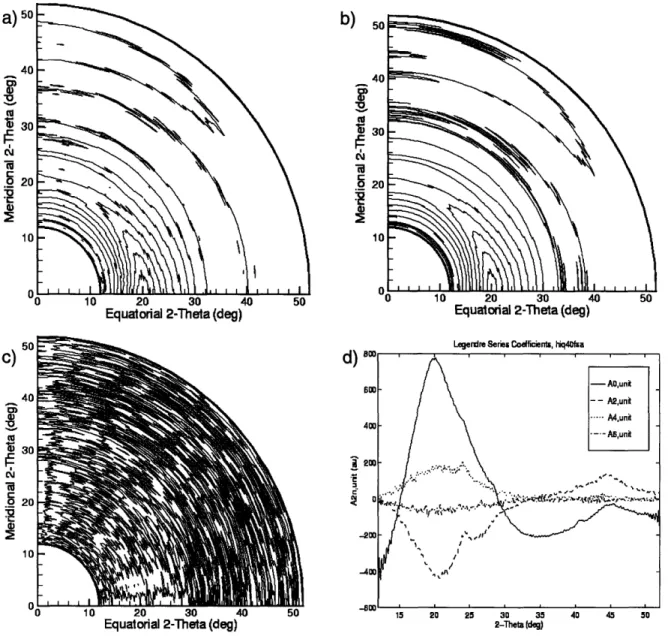
Figure 2.4: Reconstruction of HIQ-40, as-spun, solution spun fiber. a) raw data, b) reconstructed data from the Legendre series, c) subtraction of b) from a), d) experimental coefficient traces, A2n(s) for 2n = 0 - 6. All contour plots have
100 counts/contour: a) & b) 15 contours c) 3 contours... 68
Figure 2.5: A typical trimer of HIQ-40 as generated by the RIS code. Note the left most monomer relative to the middle monomer. This is due to the ester torsion betw een them ... 71
Figure 2.6: Schematic of the 2-D lattice used in our simulations. a, b, and y are the lattice unit cell parameters. Chains are placed in a counter-clockwise spiral. 73
= ta n
-(b/a ) ...
... ... ... 85
Figure 2.8: Sample pentamer of pHBA from single chain study
... 88
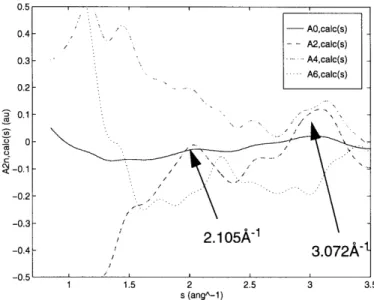
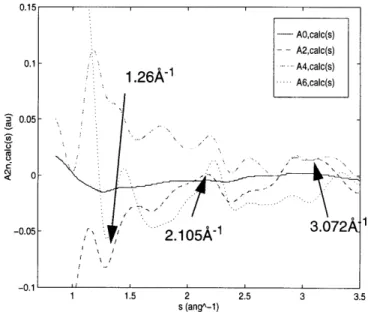
Figure 2.9: Two-dimensional structure factor coefficients from single chain study.
Depicted are A2n,calc(s), 2n = 0 - 6. ... ... 88
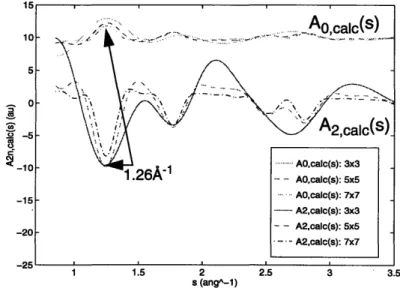
Figure 2.10: Calculated structure factor coefficient traces, Ao,calc(s) and A2,calc(S), for
square lattice of carbon atoms. Lattice sizes are
3x3,
5x5, and 7x7. a = b
=
5 .oA ...
. . 8 9
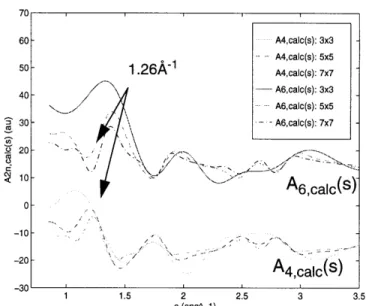
Figure 2.11: Calculated structure factor coefficient traces, A4,calc(s) and A6,calc(), for
square lattice of carbon atoms. Lattice sizes are
3x3,
5x5, and 7x7. a
= b =
5 .o A ... . . ... 9 0
Figure 2.12: Calculated structure factor coefficients A2n,calc(s) for 3x3 square lattice of
pHBA trimers. The lattice is cubic with a = b =
5.A ... . 91
Figure 2.13: Comparison of single chain, simple lattice, and lattice with realchains
structure factor calculations. All chains are pHBA pentamers and all lattice
spacings are 5.0A ...
... 92
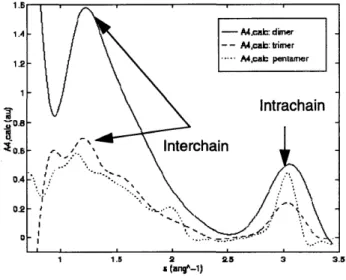
Figure 2.14: Comparison of A4,calc(s) coefficient traces as a function of the oligomer
le ngth ... ... 93
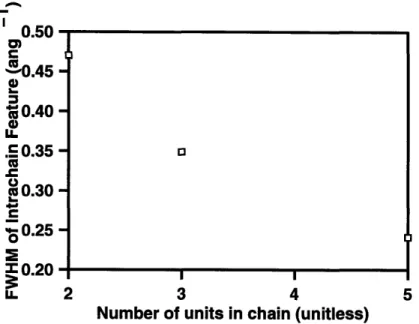
Figure 2.15: Intrachain peak breadth as a function of the number of units in the
simulated oligomer...
94
Figure 2.16: Intrachain feature as a function of unit cell spacing. In the cases shown we
have a square lattice, i.e. a = b...
... 94
Figure 2.17: FWHM of interchain feature as a function of the lattice size
...
. 95
Figure 2.18: Simulated amorphous structure factor calculation for HIQ-40 from Biosymtm
...
....
..
9 8
Figure 2.19: Comparison of experimental and calculated structure factor coefficient
traces for hiq40fsa fibers, a) Ao(s) coefficients, b) A
2n(s)
coefficients (2n = 2,4)
..
...
...
9 9
Figure 2.20: ODF for HIQ-40, as-spun, solution-spun fibers
...
100
Figure 2.21: Two phase schematic showing the oriented non-crystalline phase
interspersed in the isotropic amorphous phase ... 102
Figure
3.1:
General Schematic of a Fiber Spinning Process
...
106
Figure 3.2: Example of a fiber diagram showing broad and narrow features. The sample
is annealed HIQ-40 melt-spun fibers ... 113
Figure 3.3: Optical micrographs of HIQ-40 fibers, a) hiq40fsa, b) hiq40fsh, c) hiq40fma,
d) hiq40fmh. All magnifications at 400x ... 115
Figure 3.4: Example DSC trace for an HIQ-40 fiber. In this case, the sampledepicted is
hiq4 0fm h ... 116
Figure 3.5: Fiber patterns for HIQ-40 annealed melt spun fiber (hiq40fmh)a) raw experimental data trace, b) crystalline peak subtractions, c) non-crystalline
portion of trace ... 121
Figure 3.6: Fiber patterns for HIQ-40 as-spun melt spun fiber (hiq40fma) a) raw experimental data trace, b) crystalline peak subtractions, c) non-crystalline
portion of trace... . .123
Figure 3.7: Fiber patterns for HIQ-40 annealed solution spun fiber (hiq40fsh) a) raw experimental data trace, b) crystalline peak subtractions, c) non-crystalline
portion of trace... 125
Figure 3.8: Legendre series coefficient traces for HIQ-40 fibers, a) hiq40fsa, b) hiq40fsh, c) hiq40fma, d) hiq40fmh, as a function of thescattering vector, s. Alo(s) is the
maximum coefficient shown(if necessary) ... 129
Figure 3.9: Comparison of the experimental coefficient traces for the four HIQ-40 fiber sa m p les ... ... 13 1 Figure 3.10: Structure factor calculation from Biosymtm Amorphous Cell simulation of
HIQ-40 50-unit chain. (p = 1.35 g/cc) ... 134
Figure 3.11: ODFs for the four HIQ-40 fiber samples in the iso-structural analysis... 137
Figure 4.1: Schematic showing definitions of aL and PL with respect to thesample and
laboratory fram es... ... 149
Figure 4.2: An example of a pole figure diagram. This example is of the
T05
reflection(along the chain axis) of a PET plane strain specimen. ... 151
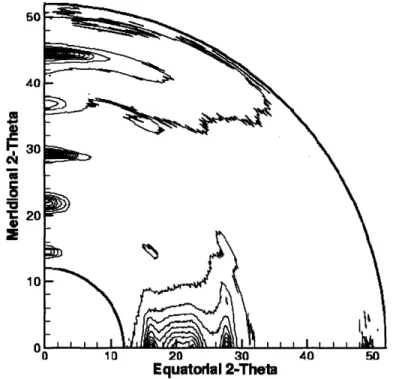
Figure 4.3: A 3-D WAXS pattern and its breakdown into 1-D and 2-D scans... 153
Figure 4.4: Schematic showing the relationship between the transmitted andreflected
scattering X-ray beams... ... 154
Figure 4.5: Axes conventions for the molecular frame (a, P) and the laboratory frame(aL,
PL) with respect to the sample frame (FD, LD, CD) ... 155 Figure 4.6: DSC scan for PET190SC showing a melting peak at 2600C... 157 Figure 4.7: 3D-WAXS patterns for PET190SC. a) Raw, b) crystalline, c) non-crystalline.
Contours: a) 16 IvIs, 400 counts/Ivl, b) 16 Ivis, 400 counts/vl, c) 11 IvIs, 200
counts/Ivl ... ... 160
Figure 4.8: PET amorphous reference 20 scattering curve. Taken at a = 00 and
P
= 00All other a-c combinations show similar shapes, but different scalings due
varying thicknesses of sample illuminated by the beam... 162
Figure 4.9: Compton scattering, Icomp, and self-scattering summation, f2, for PET as a
function of the scattering vector magnitude, s, where s =4nsin0/)... 166
Figure 4.10: Stereographic projection of 'P22(cosa,) spherical harmonic of the first kind.
... 17 3
Figure 4.11: Experimental structure factor coefficients for PET190SC (Aoo(s) - A44(s))
... 17 4
Figure 4.12: Comparison of experimental data and spherical harmonic series expansion reconstruction for PET190SC. a) Experimental 3-D WAXS pattern b)
spherical harmonic series reconstruction ... 177
Figure 4.13: Schematic description of the bond lengths, angles, and torsions associated
with an ethylene moiety ... 180
Figure 4.14: Outputs from the simulation, a) sample structure from our totalensemble.
b) Aoo(s) - A22(s) structure factor coefficients c) A40(s) -A44(s) structure factor
coefficients ... .. . 185
Figure 4.15: Comparison of experimental and calculated scattering traces, Anm(s). a)
Aoo(s) traces, b) A20(s) traces, c) A22(s) traces. Experimental traces are of
P ET 190S C ... 186
Figure 4.16: Comparison of experimental and calculated scattering traces, Anm(s). a)
A40(s) traces, b) A42(s) traces, c) A44(s) traces. Experimental traces are of
P ET 190S C ... .. . 187
Figure 4.17: ODF for PET190SC based on the Dnm values listed in Table 4.5... 189
Figure 5.1: Stress as a function of time for plane-strain deformed PET sample: Tproc =
1900C, CR = 2.6 ... 193 Figure 5.2: Schematic of processing histories for stress recovery series: (1) PET190Q,
(2) PET190Thrl, (3) PET190Thr5 ... 198
Figure 5.3: Stress as a function of time for PET190Q, PET190T1hr andPET190T5hr sam ples ... 203
Figure 5.4: DSC Results for the PET samples: a) PET190Q, b) PET190hrl, c) P ET 190hr5... ... 204
Figure 5.5:13C SMAS-DECODER spectrum for unoriented PET powder... 206
Figure 5.6:13C SMAS-DECODER spectrum for PET190NL ... 207
Figure 5.7:13C SMAS-DECODER spectrum for PET190Q... 207
Figure 5.8:13C SMAS-DECODER spectrum for PET190T1hr ... 208
Figure 5.9: 13C SMAS-DECODER spectrum for PET190T5hr ... 209
Figure 5.10: Pole Figure Diagrams of the 105 reflection of the Stress Recovery S a m p les ... .... 2 10 Figure 5.11: Pole Figure Diagrams of the 100 reflection of the Stress Recovery S am ples ... 2 10 Figure 5.12: Pole Figure Diagrams of the 010 reflection of the Stress Recovery S am ples ... ... ... 2 11 Figure 5.13: Experimental structure factor coefficients for PET190Q: Aoo(s) - A44(s). 211 Figure 5.14: Experimental structure factor coefficients for PET190T1 hr:Aoo(s) - A44(S) ... ... ... ... 2 12 Figure 5.15: Experimental structure factor coefficients for PET190T5hr:Aoo(s) - A44(S) ... 2 13 Figure 5.16: Comparison of Experimental Anm(s) traces for PET stress recovery series: a) Aoo(s), b) A20(s) - A22(s), c) A40(s) -A42(s), d) A44(s) ... 215
Figure 5.17: ODFs for the three samples in this study: a) PET190Q, b) PET190T1hr, c) PET190T5hr ... 219
Figure 5.18: 2-D SAXS scans of a) PET190Q, b) PET1 90T1 hr, and c) PET190T5hr showing four-point patterns. The axes systems are shown above the pattern. The incident X-ray beam was parallel to the CD ... 223 Figure 5.19: 20 integrations of the SAXS data from the three PET samplesshowing the
azimuthal dependence of the SAXS pattern. Thearrows indicate the
approximate positions of the peaks in the four-point pattern ... 223
Figure 5.20: Schematic of the herring-bone arrangement of the lamellae inplane-strain
deformed PET ... 224
Figure 5.21: Azimuthal angle integration of SAXS pattern for PET190T1hr,which shows
the 20 dependence of the SAXS pattern. ... 226
Figure 5.22: Schematic of processing histories for stress recovery series: (1) PET190Q, (2) PET190hrl, (3) PET190hr5... 230 Figure 8.1: Relative orientation (Euler Angles) between different referenceframes
involved in the SMAS-DECODER experiment... 249
Figure 8.2: Rotor synchronization pulse sequence of the two-dimensional
SMAS-DECODER NMR experiment. 'r is the cycle of the rotor period, and (or is the
spinning rate. The initial magnetization is created by cross-polarization (CP)
and evolves under the proton dipolar decoupling (DD) during the t1 period The
magnetization is stored along the z direction during the mixing time to get a total
rotation angle of ortm with respect to the initial angle. A final spin echo with
delay I is applied to detect the signal during the t2 acquisition (ACQ) period.
... 2 5 1
Figure 8.3: Molecular structure of ethylene-terephthalate unit in PET. The z-axis of the molecular frame is defined by the vector between the ester oxygens in successive esters. Examples of the orientations of the CSA tensors of each
type are also show n... 253
Figure 8.4: Spherical harmonics of the first kind for n = 0, a) m = 0, b) m = 2... 257
Figure 8.5: Spherical harmonics of the first kind, n = 4. a) m = 0, b) m = 2, c) m = 4.. 258
Figure 8.6: Even-ordered Legendre polynomials, P2n(cosa), 2n = 0,10... 262
Figure 8.7: The first four spherical Bessel functions (n = 0,3) [Abramowitz, M., 1965] 268
List of Tables
Table Table Table Table Table Table Table Table Table Table Table 1.1: 2.1: 2.2: 2.3: 2.4: 3.1: 3.2: 3.3: 3.4: 3.5: 3.6:Material Properties of HIQ-x Fibers 36
Summary of Spacings in hiq40fsa Experimental Coefficient Traces ... 68
Parameters used in Excluded Volume Integrals and a Comparison of the Excluded Volume and Van der Waals Overlap Distances. ... 81
Simulated Amorphous HIQ-40 Feature Positions 98 Scaling Coefficients, D2n, for hiq40fsa Fibers ... 100
Nomenclature for the HIQ-40 Fibers 107 HIQ-40 Fiber Diameter Measurement Results 114 HIQ-40 Fiber DSC Results 117 HIQ-40 Fiber Crystalline Peak Deconvolution Results ... 119
HIQ-40 WAXS Degree of Crystallinity, XWAXS, Results ... 119
Qualitative Comparison of Experimental Coefficient Traces for HIQ-40 Fibers ... ... 1 3 0 Scaling Coefficients for HIQ-40 Fibers in the Iso-Structural Analysis.All values of D2n are x 10-3 . . ... ... .... ... .... ... .... ... ... ... ... . 137
Collation of Orientational Structural Parameters for HIQ-40 Fibers. %XTAL, %ONC, and %UNC are the relative fractions of the crystalline, oriented non-crystalline and unoriented non-non-crystalline material, respectively. ... 138
DSC Melting Peak Parameters for PET190SC sample ... 157
Comparison of Degrees of Crystallinity: WAXS and DSC ... 178
RIS Bond Parameters for Ethylene Moieties ... 179
Model Simulation Parameters for PET190SC... 183
Scaling Coefficients, Dnm, for PET190SC... 188
Relative Breakdown of Material Phases for PET190SC Sample ... 190 Table 3.7: Table 3.8: Table Table Table Table Table Table 4.1: 4.2: 4.3: 4.4: 4.5: 4.6:
Table Table Table 22 5.1: 5.2: 5.3:
Nomenclature Designations for PET Plane-Strain Deformed Samples... 197
DSC Melting Peak Results for Stress Recovery Study ... 205 Residuals for PET190Q, PET1 90T1 hr and PET190T5hr as a Function of the
Index n ... ... 2 13
Model Simulation Parameters for PET190Q, PET190T1 hr, and PET190T5hr ... . ... 2 18
Scaling Coefficients, Dnm, for PET190SC ... ... 218
Relative Fractions of Phases in PET190Q, PET190T1 hr, and PET190T5hr. Xxtal, XONC and XUNC are the relative fractions ofthe crystalline, oriented non-crystalline, and unoriented non-crystalline phases, respectively .... 221
Com parison of XDS and Xxtal ... 222
The Average Shearing Angle for the Plane-Strain Deformed PET Samples
... 2 2 4
Listing of the Principal Values of the Chemical Shift Tensor and Euler Angles for the Principal Axes System Relative to the Molecular Frame ... 252 Table 5.4: Table Table Table Table 5.5: 5.6: 5.7: 5.8: Table 8.1:
Chapter 1
Introduction
"Lo I the man, whose Muse whilome did maske,
As time her taught, in lowly Shepeards weeds, Am now enforst a far unfitter taske,
For trumpets sterne to chaunge mine Oaten reeds;
Whose prayses having slept in silence long,
Me, all too meane, the sacred Muse areeds
To blazon broad emongst her learned throng:
Fierce warres and faithfull loves shall moralize my song."
- Edmund Spenser, the Faerie Queene, Booke I, Stanza 1
1.1 Motivation
Aromatic polyesters are of great interest due to their favorable physical properties
particularly in high strength, high modulus (HSHM) applications. Aromatic polyesters
constitute the class of polymeric materials which contain aromatic moieties and ester linkages as the primary constituents of their polymer chain backbone. Also known as
"polyarylates," aromatic polyesters are a general class of materials with many uses, of
which HSHM applications are merely a subset. One property nearly all polyarylates display is that they are semi-crystalline in nature. Often the interactions and
differences between the crystalline and non-crystalline phases influence the bulk
properties of the material.
The first polyarylate, poly(ethylene terephthalate) (PET), was introduced in the late 1940's. PET is one of the most industrially important polymers in the U.S. today with annual production numbering in the billions of pounds. PET's applications are myriad,
ranging from carbonated beverage containers to film coatings and overhead
transparencies. The HSHM field for polymers opened up in the early 1970's with the commercial introduction of polyaramids (materials with aromatic moieties and amide
linkages) such as, Nomextm (poly(m-phenylene isophthalamide), MPIA) and Kevlartm (poly(p-phenylene terephthalamide), PPTA). Since then, a number of different chain
architectures have been postulated. In particular, since Kevlartm can only be
processed from solution, a melt processible alternative has been sought. One of these potential alternatives is HIQ-x. HIQ-x is a random rigid-rod terpolyester composed of the following three constituents: 1,4-hydroxybenzoic acid (HBA), isophthalic acid (IA), and hydroquinone (HQ). The x denotes the mole percentage of HBA in the polymer and completely defines the composition of the material.
The two materials studied in this thesis, HIQ-x and PET are both semi-crystalline polyarylates. HIQ-x displays a nematic liquid crystalline melt for the composition range of 20 < x < 80. Many polyarylates are variations on the highly linear rigid structure of Kevlartm and HIQ-x is no exception. What makes HIQ-x interesting is that it has a melt processible phase, meaning that it can be injection molded. PET, on the other hand, is not a variant of Kevlartm (having been discovered before Kevlartm) and displays no liquid crystallinity. While PET has good HSHM behavior, its main attractions are its
melt processibility, ease of production (in part due to its low production cost), and
extensive recycle potential. All of these advantages have lead to a large literature presence for PET. Both HIQ-x and PET will be discussed more in depth in this chapter.
Studies on polyarylates continue to be done in order to enhance the performance capabilities of this class of materials. These types of improvements fall into two general categories: enhancement of strengths and mitigation of weaknesses. An example of the former is improving material tensile strengths and moduli by additional
processing or the introduction of additives. Combating material weaknesses
encompasses improvement of wear resistance, decreasing susceptibility to aging, or increasing thermal stability. For polymer and material scientists, product improvement is instituted on the molecular scale, whether through the introduction of new
constituents or additives or by processing old materials in new ways. When dealing with these materials, many of the properties are greatly influenced by the molecular scale structure of the material. In turn, the molecular-scale structure is influenced by its processing history.
Therefore, molecular-scale analyses of these materials is important in gaining a fundamental understanding of the processing-structure-properties relationship in the material. In addition, since the chain alignments and their packing arrangements are often primary influences in the development of macroscopic properties, determination of the solid-state molecular-scale behavior of these polyarylates is of utmost
importance. However, the molecular-scale packing behavior of the non-crystalline phase in many polyarylates is still not very well understood. A quantitative method of characterizing molecular-scale orientation is one of the main objectives of this thesis work. The non-crystalline (often termed the amorphous, both oriented or unoriented)
phase of these materials often accounts for more than half of the material by mass in a given sample, making it the majority phase.
With the advent of the microcomputer and the doubling in computing power that occurs approximately every 18 months, the use of computer simulations has increased
dramatically. Computer models are very useful in validation of theories and prediction of properties. With respect to polymers, computers are being applied to problems that were once thought to be intractable due to their sheer volume of calculations.
Simulation techniques such as molecular dynamics and Metropolis Monte Carlo sampling are used on ever larger systems of atoms and molecules with dramatic effects. By using molecular modeling, we can build realistic molecular-scale
ensembles and models which can aid in the analysis and evaluation of various material properties.
From the broad discussion above, we can specify the main objectives of this thesis work as follows:
1) To deduce a method for the quantitative description of oriented non-crystalline structure in the solid-state of aromatic polyesters. This method will encompass the use of theoretical structure factor calculations in conjunction with an analysis of experimental data to derive an orientation distribution function (ODF) which
relates the two branches of the analysis.
2) To validate this method by analyzing various polyarylate samples with simple sample geometries and varying levels of spatial symmetry. This will include case studies of axisymmetric fibers (i.e. samples which display cylindrical symmetry) as well as uniaxially compressed plaques in plane strain deformation which exhibit three-dimensional orientation.
3) To evaluate the comparative effectiveness of this method relative to others. This
will highlight the potential usefulness of comparisons made between related analyses on different size scales. It will also show the similarities and differences between such analyses.
With these objectives in mind, the rest of this chapter will discuss the state of the art with respect to the polyarylates of this study (PET and HIQ-x) and introduce the experimental techniques (WAXS and DSC) used in this study.
1.2 State of the Art
1.2.1 Aromatic Polyesters: Polyarylates
The field of polymers, particularly HSHM liquid crystal (LC) polymers, blossomed with the discovery of high tensile strength polymeric materials such as Nomextm and Kevlartm by Du Pont in the mid-1970's. Highly aligned and highly extended chain conformations in the fluid phase can be obtained by induction of an LC phase. There
are two methods of producing liquid crystal phases: "lyotropic" (an LC phase induced
by solvation) and "thermotropic" (an LC phase induced by heating). Aligned chains
have a tendency to aggregate into larger structures, termed "domains." The degree of ordering can vary between simple aligned, extended chains, termed a "nematic" phase to phases which contain which contain specific ordering between domains, for example
smectic LC phases. When these liquid crystal domains are all aligned (as is the case in
fiber spinning) a marked increase in the material's tensile modulus in the direction of the chain backbones is observed. Once these highly aligned domains are cooled
below the crystal-to-nematic transition, Tc-n, and annealed and crystallinity is induced,
the material approaches the theoretical limit for the strength of the constituent covalent bonds. [Rutledge, G., 1990, Noel, C., 1985, Ciferri, A.,1991]
1.2.2 Defining the Role of Processing
Processing can affect a material's bulk properties, such as the tensile strength and sample geometry, after synthesis. Molecular-scale morphologies are greatly affected
by processing history; this is especially true of polyarylates. One of the ultimate goals of polymer scientists is to determine the nature of the relationship of bulk properties with
respect to structure and thereby relate it back to the composition and processing history of the material. This fundamental interplay of factors is a well known tenet of material science. [Davies, G.R., 1988]
.(composition, processing history) --> Structure --> Relationship of Properties
We focused on two factors of processing history in this thesis: mechanical bias and deformations and thermal or heat treatment (also referred to as "annealing") of the material.
The initial mechanical processing step is often the point at which the bulk geometry and bulk morphology of the sample is determined, be it a powder, film, fiber, monofilament, rod, extruded part, or plaque. The nature of symmetry and orientation evidenced in a sample is highly dependent on its initial geometry and is often indicative of the amount and type of orientation seen on the molecular scale. Common specimen geometries include materials with two (2-D) or three (3-D) independent axes. Figure 1.1 shows examples of these spatial geometries.
a) z b) z
r r I y
x
PFigure 1.1: Schematics of common processing symmetries a) axisymmetric or cylindrical
requiring two variables (r,a) to characterize b) three-dimensional symmetry requiringthree variables (r,a,3)
In this thesis, we studied the following sample geometries:
In 2-D: Fibers, Melt-spun and Solution-spun. Fibers can display widely varying
degrees of orientation. Industrially produced fibers often show very high degrees of orientation due the extreme processing conditions to which the material is subjected. Being industrially significant, fibers are a sample geometry which is very common. The HIQ-40 fibers studied in this thesis were obtained from Hoechst-Celanese in New Jersey.
In 3-D: We used a channel die to produce low to moderate molecular level
orientation of a "pseudo-single crystal" nature. "Pseudo-single crystal" orientation arises because the material contains multiple crystallites, but due to the processing, all of these crystallites are forced to align in similar
orientations. [Bellare, A., 1993] This unusual condition of macroscopically aligned microscopic crystallites allows one to study microscopic behavior much more easily and on a much larger scale within a material.
1.2.2.1 The Channel Die
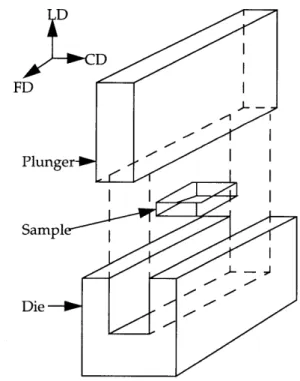
Figure 1.2 shows a schematic of a channel die and the three independent orthogonal, spatial directions associated with it.
D
FD
Plunger
Sampl I
Die
Figure 1.2: Schematic for channel die geometry showing the 3 orthogonal axes: LD =
From the figure, the nomenclature for processing with the die becomes readily
apparent. There are three spatially orthogonal axes, the constraint direction (CD), the load direction (LD), and the flow direction (FD). When the plunger is thrust downwards onto the sample, the load direction experiences a compressive force normal to the surface. In contrast, the constraint direction experiences an expansion or tensile force normal to its surface, yet is required (or constrained) to maintain its shape. The flow direction experiences a force similar to the constraint direction, but because it is unconstrained, it is allowed to freely expand or deform in that direction. Generally, the deformation caused by uniaxial compression in the solid state in a channel die leads to
"plane-strain deformation." That is, the material deforms and extends uniformly in the
flow direction. If the walls are lubricated such that the friction between the channel die
and sample surfaces is minimized (and therefore, slip between these surfaces is
maximized), then the extensional bias experienced by the plane of the sample normal to the flow direction will proceed as a constant "front." In polymeric systems, the backbones of the polymer chains align themselves with the direction of flow or deformation (that is, in the flow direction). Note that with plane-strain deformation, compressed samples should display two-fold rotational symmetry in each of the three
orthogonal spatial directions.
1.2.2.2 Post-synthesis Processing
1.2.2.2.1 Mechanical and Orientational Bias
In our study, we limited ourselves to simple geometries to avoid the effects of a complicated flow and processing history from an already complex molecular-scale description of the material. Two-dimensional studies were limited to axisymmetric orientation in the form of fibers, both solution and melt spun. As noted in the previous section, uniaxial compression in a channel die yields macroscopic three-dimensional order, in the form of pseudo-single crystal order. Therefore, such samples can be of particular interest in this project, offering us a chance to study the effects of three-dimensional orientation of the crystalline and non-crystalline phases in the material. Starting from the unoriented powder of our materials ensures that any subsequent orientation we detect is a function of the processing that the sample undergoes.
Oriented non-crystalline phases in polymers are not unusual. For example, numerous studies on the various phases of drawn PET fibers discuss the nature of the oriented non-crystalline phase of PET and its relationship to both the crystalline and unoriented non-crystalline phases. [Fu, Y., 1994a, Hristov, H., 1991, Clauss, B., 1994, Fischer, E., 1976, Asano, T., 1973, Gupta, V., 1994] There have also been studies on plane-strain compressed poly(methyl methacrylate) (PMMA) samples. These studies deduced the average chain torsionsand chain conformation of PMMA based on an analysis of Wide Angle X-ray Scattering (WAXS) data under the assumption of axisymmetric (or
cylindrical) symmetry. [Mitchell, G.R., 1982,1985a] Three-dimensional WAXS studies have been performed with Nylon-6,6 and polyethylene plane-strain deformed polymer specimens. [Galeski, A.,1991(a,b), Bartczak, Z., 1992(a,b)]. Galeski, et al. reported that at high strains in Nylon-6,6, the chains orient with their flexible backbones
extended and aligned in the chain direction, packing much like hard cylinders in a 2-D hexagonally packed array.
1.2.2.2.2 Thermal Treatment or Annealing
Annealing is often referred to as a post-processing step. A thermal anneal usually does not change the bulk geometry of the sample appreciably (fibers remain fibers and a powder remains a powder, and while it may sinter, it will not preferentially obtain a uniquely oriented structure in the bulk). Studies have shown that varying the annealing temperature can significantly influence the molecular structure of a given bulk
morphology. Generally, crystallinity is induced or enhanced. Thermal annealing is a solid-state processing step and as such is done below the melt transition (either the
crystal-to-nematic transition, To-n , or the isotropic melt transition, Tm). However, to
allow some chain mobility, annealing must be performed above the glass transition temperature, Tg. Thermal processing is often coupled with mechanical processing, where the coupling can be as simple as fixing the dimensions of the sample geometry or as complex as multistaged cycles of thermal and mechanical processing steps.
1.3 Materials: HIQ-x and PET
1.3.1 HIQ-x:
As previously mentioned, one of the polymers of interest in this thesis is HIQ-x, a rigid-rod polyarylate. Before proceeding to a detailed discussion this material, it is useful to examine some of the processing and physical problems encountered in with the material that predates it: Kevlartm (PPTA).
1.3.1.1 Sub-motivation: Problems with Kevlartm
The main reason that Kevlartm has such high strength is attributed to the presence of
its long rigid-rod backbone. The rigid linear backbone causes PPTA chains to align
preferentially making crystallization very facile. In fact, Kevlartm does not form either a
liquid or vapor phase upon heating; it remains crystalline until degradation of the carbon-carbon bonds in the polymeric backbone occurs at about 6000C. However, Kevlartm is lyotropic, being soluble in a 100% sulfuric acid solution. While lyotropicity allows the processing possibilities of wet spinning of fibers and casting of films or plates from solution, the handling and storage of such a strongly acidic solution causes severe problems in large scale industrial applications. [Rutledge, G., 1990, Noel, C., 1985, Ciferri, A.,1991, Biswas, A., 1992] Also, lyotropic materials cannot be injection molded since the presence of solvent inhibits the ability of the material to be properly molded and the removal of solvent from such parts can be difficult. Lastly, Kevlartm, while stable under most conditions, degrades upon exposure to high intensity ultraviolet light
(in a process commonly referred to as "aging"). These drawbacks have led polymer
scientists to search for alternate materials which are melt processible, in the hope of making the many other thermoplastic polymer processing routes available.
1.3.1.2 Liquid Crystallinity
The search for melt processible polymeric HSHM materials has followed a general methodology. Given that PPTA does not melt, but degrades we ask the question: how can we produce a material which maintains a high tensile strength and whose melting
temperature is lower than its degradation temperature? Since the crystallinity of the PPTA is so high, disrupting the chain packing and making the crystalline phase less energetically stable has been the answer. However, one must remain cognizant of the fact that the aligned nature of the polymer chains is what leads to the high tensile strength and stiffness of these materials. Thus, steps must be taken to ensure that we do not disrupt the chain alignment and hence the material crystallinity "too much."
First, we can eliminate the hydrogen-bonded amides in the backbone, converting the
polyaramid to a polyarylate. An example of the former is PPTA (Kevlartm) and an
example of the latter is pHBA. Unlike PPTA, which is a copolymer of a diamine and a diol, pHBA is the homopolymer of 1,4-hydroxybenzoic acid (HBA), a difunctional molecule. However, like PPTA, pHBA has a tendency to degrade before melting. Again, this is attributed to the long, rigid, linear backbone of pHBA. [Lieser, G. 1983, Adams, J., 1976] As HBA is one of the three constituents of HIQ-x (the others being isophthalic acid and hydroquinone), pHBA can be thought of as HIQ-100. While, pHBA itself does not exhibit a melt phase (let alone a liquid crystalline one), as a simple limiting example of a rigid-rod chain its behavior has been simulated and studied. [Foulger, S., 1995, Rutledge, G., 1992]
A delicate balance must be achieved between disrupting the chain packing sufficiently to allow a material to exhibit a liquid crystalline phase and disrupting the chain packing so much such that an isotropic melt of unaligned chains results. That is, we require an anisotropic shape persistent mesogen. There have been a large number of variations on rigid-rod polymers postulated to overcome the high crystallinity of Kevlartm and pHBA. On the molecular-scale, lowering of the melting point and increasing the processing window in these rigid rod polymers is generally accomplished in three distinct ways. All three categories rely on disrupting chain packing sufficiently to induce a transition to a more disordered melt (or liquid phase) before thermal degradation. The three categories of chain disrupters are delineated as follows:
1) Flexible "spacer" units in the backbone 2) Rigid disrupters or "kinks" in the backbone 3) Bulky side groups off of the backbone
The first two options are referred to as "main chain" methods because the nature of the linear rigid backbone is affected; the third is called a "side chain" method since the polymer backbone is unaffected. [Noel, C., 1985] An example of a polymer utilizing the first category to disrupt chain packing is poly(terphenyl-4,4" dicarboxylate). Note, PET (utilizing a -(CH2)2-spacer) and poly(butylene terephthalate) (PBT, with a -(CH2)4
-spacer) utilize this method of chain disruption, but do not display liquid crystalline phases. Thus, they are examples where the backbone of the chain has been made too flexible for LC induction. An example of a material utilizing the second category is the random copolyester of 1,4-hydroxybenzoic acid and 2,6-hydroxynaphthaloic acid (HNA), a polymer with the trade name of Vectratm. In Vectratm, the naphthaloic moiety introduced at random intervals disrupts the periodicity of the chain backbone and
prohibits the development of a fixed crystalline repeat distance. This is an example of a colinear kink, one that disrupt crystalline formation, but allows for the alignment of the polymer chains. An example of the third (or side chain) method of thermotropic LC
phase induction is the random terpolyester of 1,4-hydroxybenzoic acid, terephthalic acid (TPA), and phenylhydroquinone (PHQ). The last constituent contains a phenylene ring off of the main backbone ring.
1.3.1.3 Literature: HIQ-x
One of the materials of focus in this thesis is the random terpolyester composed of the following three constituents: 4-hydroxybenzoic acid (HBA), isophthalic acid (IA), and
hydroquinone (HQ). These constituents are shown schematically in Figure 1.3. o 0 COOH HBA HO OH
HO
HOOC
IA
COO0
Figure 1.3: Schematic of the 3 constituents of HIQ-x: 1,4-hydroxybenzoic acid (HBA), isophthalic acid (IA), and hydroquinone (HQ)
Because isophthalic acid contains a meta-linked phenylene moiety, the linear nature of
the polyester backbone is disrupted. However, the polymer chain remains highly rigid.
[Rutledge, G., 1992] HIQ-x utilizes the second category of inducing thermotropicity (delineated above) and has been reported to display a liquid crystalline phase when 20
< x < 80. Additionally, the window of liquid crystallinity is ~500C for HIQ-x compositions of 30 < x < 50. [Blundell, D., 1989, Erdemir, A., 1986] A 500C range is the minimum temperature window necessary for viability in industrial processing. [Blundell, D., 1989] HIQ-x's liquid crystalline behavior is shown in the phase diagram in Figure 1.4.
iiiiiiiii: iiiii:iiiiiiii • i ... ...: •::: !i i . : E ..-X WA
Figure 1.4: Proposed phase diagram for HIQ-x [from Blundell, MacDonald, and Chivers,
1989]
34
6ii i i ':iiii:: :::::::i: ::i: : i::: -i:i'li -i:iii li: !-iii ! ::! ::!: :!;:::: i:i:i:: i: -i:i:-ii :iiiii : : -:: : -::i:::!: :::::? ::- :ii
ii :iii :i:i~ i::-:i:i::::::: : ':':::: !!:i !:i:::: - :; :.:i : ! !:i i ; : ! i ; :::::i : i ! i iiii ! ::: i : : : , : ;: i
i••!
-: : ::::::::: : ,,: i,::: ::: : i ;:•i. :: :::: : : :: :--:i ::-::::i::iiiii::;:::':i:::: i:. ::::: :•i::::;:•• ;,::ii.,
:'" . : .::: ., : ::: . " ;: i ',: : , I.Op: .:i:::ii::;:.: : :: " ,:iiii ii :ii' ii el :i:iil .ii:-c-4:- ii: ::.
/
::: :::::::::: :: : :::'::::::::::::: ::::::::::: , :::,:--:::: : ::: ... .:: " . . . :::::. :i:::: •:.: :...!;i ':: ::i.: :: ::: :: i:::i:::! i :: ::i ii:!:/ !:i: ii : : ... .. ..: :. :::::
::::
::::::: ::::
: ::::::
::: ''I-:: ': :: i : l i :
,:•:i•?::• :.• ' i• •:;:••: : :: :,i•:!::i: :: : :: : : ":: :::i i : :::-::::.:::-:i: i ! : i~i~ ~i ii::ii i ;: ::: ili:i.:: i-:i :: :: !ii
4 :~i::i:i ::ii: .:~iii:iiii::: j')i,::::~i::~: i:: ::l :-~iiii:i::.:ii~ :
4- l::: ::,i~ 5~::3 ~ ~i~:i::i:: :ii,-ii:::i::i:i :::::i :i -'
4 i1:::::: *,,,,id~~i~~ii:::: : ::-ii: :i-i:
4::: 5:i:-::i:~_-i i:~~~-- -:::::: :. :i 4 4, :
c;~iiiyiiiiit4::--'::l::
I-;-i. I r -~- ~ :::., __ -~I :' :'HIQ-x has been fairly extensively studied as a powder [Erdemir, A., 1985, Johnson, D., 1985], as fibers [Erdemir, A., 1986, Johnson, D., 1990], and as compression molded plaques [Blundell, D., 1988]. Synthesis of HIQ-x can done by a melt-acidolysis method [Spontak, R., 1991] or a non-aqueous dispersion route [Blundell, D., 1990, Spontak, R., 1991]. The latter enhances HIQ-x's potential for industrial-scale production, as it allows the synthesis of high-molecular weight product. The non-aqueous dispersion process consists of a mixture of the constituents polymerizing in a liquid paraffin catalyzed by a supported metal catalyst. The development of a dispersed phase synthesis route allows the viscosity of the solution to be maintained at a low level. [Blundell, D., 1989] However, one of the major stumbling blocks for mass production of HIQ-x has been the complex morphological and phase behavior of the system. Given the large number of forces at work in the material (e.g. the rigid backbone, the 600 kinks, and random copolymerization), it is not surprising that the structural behavior of HIQ-x is a strong function of both composition and processing history. Thus, developing an
understanding of the molecular-scale morphology of HIQ-x is essential.
Table 1.1 summarizes a number of the material properties of HIQ-x. HIQ-x shows properties which, while not as impressive as Kevlartm, compare favorably to steel and other polymeric materials. In addition, as alluded to previously, HIQ-x has two major advantages over Kevlar: 1) it has the potential to be injection molded (because of its LC melt behavior) and 2) it shows improved compressive strength (albeit at the "cost" of some tensile properties).
Table 1.1: Material Properties of HIQ-x Fibers Low Crystallinity (< 25%)
High Orientation
Extended Chain Structure
Relatively High Glass Transition Temperature (-1200C)
Crystal-Nematic Transition Temperature (~3300C)
Nematic-Isotropic Transition Temperature (-380-4000C)
Low Density (< 1.49 g/cm3)
Good Creep Resistance Melt Processible
Excellent Tensile Properties:
Strength: 0.55 - 1.26 GPa
Modulus: 30 - 54 GPa
References: 1) Johnson, Karacan, Tomka, 1990
2) Blundell, MacDonald, and Chivers, 1989 1.3.1.4 HSHM Behavior
Like their cousins, the polyaramids, polyarylates have received a great deal of attention based on their enhanced mechanical properties. Generally, the improved specific tensile strength of polyaramids and polyarylates is attributed to two factors: the
anisotropic nature of the chain (found in all polymers) and their inherent chain
backbone rigidity which is primarily due to molecular-scale R-orbital conjugation of the phenylene ring and carbonyl carbons which dominate the backbone. These factors lead to a high packing density of chains. Coupled with the liquid crystalline behavior of HIQ-x, its high tensile modulus is especially attractive. Johnson, et al. have reported that the specific tensile modulus of annealed HIQ-33 fibers is 54 GPa and a specific tensile strength of 1.26 GPa [Johnson, D. J., 1990] which are lower than the strength and modulus values of Kevlartm (Figure 1.5). Figure 1.5 has been taken from Adams and
Eby (1987) and the strength and modulus data for the annealed HIQ-33 fibers added to
it. The lower specific tensile modulus of HIQ-33 relative to PPTA is due to the disruption of chain packing by the m-phenylene units leading to lower packing efficiency and thus, lower degrees of crystallinity. [Johnson, D., 1990] Note that, in
general, these polymeric materials compare favorably to that of steel which is also shown in the lower left hand corner. This is primarily due to the low density (relative to steel) of polymers yielding higher strength-to-weight ratios.
0 -C
a
c-U) Cnu) t-'-=C.I) C) U) Cl) Figure 1.5: Plot of 20 18 16 14 12 10 -THI 8-o SSE PE PBO 0 SPECTRA 1000 KEVLAR 49 o -RMOTROPIC POLYESTER oo S GLASS o KEVLAR 149 0 T300 0 PBZT 6 -10 4- 2-NYLON o0 Annealed HIQ-33 0 STEEL BORON o DRAWN PE T50 0 P100 OI I I 1 I I 1 0 2 4 6 8 10 12 14Specific Tensile Modulus (108 in.)
specific strength versus specific modulus for various fibers [modified
from Adams and Eby, 1987]
1.3.1.4.1 Scattering Analyses of HIQ-x
WAXS is one of the main tools for comparison of the molecular structure of HIQ-x samples, especially in those samples which display a highly oriented nature (e.g. melt spun fibers). The length of annealing time affects the degree of crystallization in the material. This crystallization can be readily measured in WAXS scans. [Blundell, D., 1988, 1989, Erdemir, A., 1985]
At the present time, X-ray analysis on HIQ-x has focused on elucidating the unit cell structure of HIQ-33 and HIQ-50 fibers. Erdemir, et al. have determined the unit cell for
the fiber structural unit to be orthorhombic with a = 5.58A, b = 3.92A, and c = 24.32A.
[Erdemir, A., 1988] This unit cell implies a density crystalline density of 1.49 g/cm3 at
room temperature. Their work closely matches the results obtained by Blundell.
[Blundell, D., 1989] Erdemir, et al., also report experimental data on the WAXS powder diffraction pattern of various compositions of HIQ-x. [Erdemir, A., 1986] They did not report any structural analysis on this WAXS data.
HIQ-100 (pHBA) has also been studied via WAXS quite extensively. The published values for the unit cell are as follows. It is an orthorhombic cell with 2 chains per cell.
The unit cell parameters are listed as: a = 7.62A, b = 5.70A, c = 12.56A. The c-direction
is parallel to the polymer chain axis. [Geiss, R. 1984] Poly(pheynlene isophthalate) (PPI) is the copolymer of two of the components of HIQ-x, isophthalic acid and hydroquinone. Compositionally, PPI is HIQ-0. It is a regular alternating copolymer, since the components are either a diacid or a diol. The unit cell structure of PPI has
been reported as a two-chain monoclinic cell with unit cell parameters: a = 6.97A, b =
6.92A, c = 24.32A, a = 950 [Cao, J., 1995] The density of the PPI unit cell is 1.37g/cm3.
The difference in unit cells between PPI and that proposed for HIQ-x is actually quite small, requiring only a slight shift between chains. The HIQ-x powder pattern has been reported to contain reflections from both the HIQ-x fiber and PPI unit cell (at least the low index reflections). Thus, the as-synthesized powder of HIQ-x seemingly contains a highly disordered mixture of two similar, but distinct crystalline phases. The two unit cells are similar, having the same c-axis parameters and both are reported to contain chains a zig-zag conformation. However, the reported PPI unit cell is less dense. The orthorhombic cell found in the fibers is ostensibly preferred upon extension of the chains which may pack with greater efficiency in the denser unit cell.
Work has been done with neutron scattering on deuterated material by MacDonald, et