Designing User-Centered IoT Solutions for Small-Scale and Mid-Scale Farmers
by
Julia C. Wong
B.A. with Distinction in Political Science University of Pennsylvania, 2012
Submitted to the Integrated Design and Management Program In partial fulfillment of the requirements for the degree of
MASTER OF SCIENCE IN ENGINEERING AND MANAGEMENT
AT THE
MASSACHUSETTS INSTITUTE OF TECHNOLOGY
June 2018
© 2018 Julia C. Wong. All rights reserved.
The author hereby grants to MIT permission to reproduce and to distribute publicly paper and electronic copies of this thesis document in whole or in part
in any medium now known or hereafter created.
Signature of Author: _______________________________________________________ Julia C. Wong Integrated Design and Management Program May 11, 2018 Certified by: ______________________________________________________________ Maria Yang Associate Professor and MacVicar Faculty Fellow
Department of Mechanical Engineering Thesis Supervisor Accepted by:______________________________________________________________ Matthew S. Kressy
Designing User-Centered IoT Solutions for Small-Scale and Mid-Scale Farmers
by Julia C. Wong
Submitted to the Integrated Design and Management Program on May 11, 2018, in partial fulfillment of the requirements for the degree of
Master of Science in Engineering and Management at the Massachusetts Institute of Technology
Abstract
The UN predicts that by the year 2030, the global water demand will outstrip supply by 40%. In face of the global water crisis, it is crucial to increase irrigation efficiency in agriculture, which currently consumes 70% of the global freshwater supply. Studies have shown that using
precision agricultural technology to control irrigation can reduce water consumption by as much as 20% and increase crop yield by up to 30% in developing countries. Such technologies, however, are inaccessible to millions of small-scale farmers who need them the most because of their prohibitive costs and design intended for large-scale farming businesses. To address this technological gap, social enterprise SoilSense delivers affordable and robust IoT soil sensor systems to small-scale farmers, empowering them to irrigate more efficiently by providing data on when and where to irrigate based on soil measurements.
This study analyzes existing literature on irrigation and soil sensor technology and applies a human-centered design approach to understand the needs of an underserved user group: small-scale and medium-small-scale avocado farmers. By engaging these farmers and subject matter experts in the field, key insights are drawn on the nuances of avocado cultivation, challenges in irrigation and water management, and the use of technology and data analytics in farming. This user research highlights the small-scale and medium-scale farmers’ pain points and their vision for how technology could improve their operations. In addition to informing the iterative design of the SoilSense system prototype and business model, this study also endeavors to help address the global water crisis through continuous innovation and advancement in IoT agricultural
technology.
Thesis Supervisor: Maria Yang
Acknowledgments
This thesis would not have been possible without the support of many people whom I have had the pleasure to know. First and foremost, I wish to express my sincere gratitude to my thesis advisor, professor, and mentor Dr. Maria Yang for her continuous support. From
introducing me to different ways of integrating the human-centered design approach in early prototyping to sharing her insight and knowledge throughout the writing and revising process, she has inspired many “a-ha” moments. I cannot imagine having a better advisor and am grateful for her motivation, enthusiasm, patience, kindness, and enlightenment throughout the past year.
Deepest gratitude is also due to my SoilSense partners and teammates Jesper Alkestrup, Nichlas Kvist Jørgensen, and Ellie Simonson. Their camaraderie and passion to drive positive impact at the intersection of water, agriculture, and technology have inspired and helped shape this research. I would also like to express special thanks to all the avocado farmers and
stakeholders who participated in this study for sharing their stories, perspectives, knowledge, and insight. Without them, we would not have a holistic understanding of the complexities and gaps in soil sensor technology and irrigation management.
I thank the MIT Priscilla King Gray Public Service Center for generously sponsoring the research study through the LEAP grant. My sincere gratitude also goes to Matt Kressy, Andy MacInnis, Anna Phan, John Stillman, the IDM staff, and my fellow classmates. Their
unwavering support and inspiration fueled me through the late nights. Finally, I would like to express my deep love and gratitude to my family for their love and support throughout my life.
Table of Contents
Abstract ... 3 Acknowledgments ... 5 List of Figures ... 10 List of Tables ... 11 Chapter 1 Introduction ... 121.1 The Global Water Crisis and Its Significance to Agriculture ... 12
1.2 Overview of SoilSense ... 21
1.3 Applying a Human-Centered Approach to Product Design ... 23
1.4 Research Questions ... 26
1.5 Synopsis ... 26
Chapter 2 Literature Review ... 28
2.1 Overview of Irrigation ... 28
2.2 Overview of Soil Moisture Sensing ... 34
2.3 Overview of Soil Sensor Technology ... 40
2.4 Analysis of the Gap in Soil Sensor Technology ... 46
Chapter 3 Research Design and Methodology ... 54
Chapter 4 Research Results ... 60 4.1 Stakeholder Analysis ... 60 4.1.1 Role ... 60 4.1.2 Gender ... 61 4.1.3 Age Range ... 62 4.1.4 Location ... 62 4.1.5 Background ... 63 4.1.6 Years of Experience ... 63 4.1.7 Size of Farm ... 64 4.1.8 Crops Grown ... 64
4.1.9 Attitude toward Technology ... 65
4.1.10 Interest in New Growing Methods ... 66
4.1.11 Relationships with Avocado Community ... 68
4.2 Avocado Growing Methods ... 69
4.2.1 Avocado Species, Flowering, and Pollination ... 69
4.2.2 Avocado Flowering, Pollination, and Growth Cycles ... 71
4.2.3 Soil Attributes ... 74
4.2.4 Water Attributes ... 76
4.2.7 Operational Costs for Avocado Farms ... 84
4.2.8 Expected Yields ... 86
4.2.9 Market Demand for Avocados ... 87
4.3 Irrigation Methods and Tools ... 89
4.3.1 Soil Sensors on the Avocado Farms ... 89
4.3.2 Irrigation Practices ... 96
4.3.3 Technology Maintenance ... 98
Chapter 5 Discussion of Results ... 99
5.1 Key User Needs Identified through California Research Results ... 99
5.1.1 High Priority User Needs ... 99
5.1.2 Medium Priority User Needs ... 101
5.1.3 Low Priority User Needs ... 102
5.2 Implications for SoilSense Design ... 103
Chapter 6 Conclusion ... 105
6.1 Summary and Contribution to Research ... 105
6.2 Research Questions ... 106
6.3 Areas of Opportunity for Future Studies ... 107
Appendix ... 109
List of Figures
Figure 1. Where is Earth's water? ... 13
Figure 2. Water withdrawal ratios by continent ... 16
Figure 3. Global population and water withdrawal over time ... 17
Figure 4. Water stress by country ... 18
Figure 5. Global water scarcity ... 19
Figure 6. SoilSense sensor system ... 22
Figure 7. Irrigation methods ... 29
Figure 8. Irrigation systems ... 32
Figure 9. Amount of water available and unavailable for plant growth in various soil types ... 35
Figure 10. Soil texture triangle ... 36
Figure 11. Water release characteristic ... 39
Figure 12. Water release characteristics for sand, loam, and clay soil types ... 40
Figure 13. Soil moisture feel test ... 41
Figure 14. Watermark and Delmhorst gypsum sensors ... 42
Figure 15. Tensiometer design and installation ... 43
Figure 16. Soil suction and available water depletion ... 44
Figure 17. Time domain reflectometry sensor ... 45
Figure 18. Frequency domain reflectometry sensor ... 46
List of Tables
Table 1. Estimate of global water distribution ... 14
Table 2. Technical conditions, requirements, and constraints for various irrigation systems ... 33
Table 3. Technical conditions, requirements, and constraints for various irrigation techniques . 34 Table 4. Investment and operational costs for various irrigation technology ... 34
Table 5. Watermark's guidelines for soil matric potential readings ... 38
Table 6. Comparison of various capacitive sensors ... 50
Table 7. Comparison of various smart soil sensors ... 52
Table 8. List of interviewees ... 57
Table 9. Interviewee roles and locations ... 63
Table 10. Maturity season of common avocado varieties in Ventura County ... 74
Table 11. Avocado production in pounds by region in 2017 ... 88
Chapter 1
Introduction
1.1 The Global Water Crisis and Its Significance to Agriculture
“Water is life's matter and matrix, mother and medium. There is no life without water.” - Albert Szent-Györgyi, 1937 Nobel Prize in Physiology or Medicine
The Criticality of Water
Water, one of the most important substances on Earth, is critical to creating a hospitable climate for sustaining life and delivering oxygen and nutrients in living organisms, among other critical biological functions. UN-Water defines water as “the core of sustainable development” due to its direct impact on socio-economic development, healthy ecosystems, human survival, and global health. A universal solvent uniquely capable of existing in solid, liquid, and gaseous states in terrestrial conditions, water continuously moves through the hydrologic cycle, changing between different states through the processes of precipitation, evaporation, and condensation. Although water shifts through different states, the amount of water on Earth and in the
environment,” and water governance is key to managing the increasing competition for this valuable resource among the many water-dependent sectors.
The Sources of Water
How is water distributed on Earth? As shown in Figure 1, 96.5% of water is saline ocean water, and only 2.5% comprises freshwater.
Figure 1. Where is Earth's water?
Additionally, Table 1 presents an aggregate view of the estimated global water distribution, showing the water volume, percent of freshwater, and percent of total water across 10 major
Table 1. Estimate of global water distribution
Estimate of global water distribution (Percents are rounded, so will not add to 100) Water source Water volume,
in cubic miles Water volume, in cubic kilometers Percent of freshwater Percent of total water Oceans, Seas, & Bays 321,000,000 1,338,000,000 -- 96.54 Ice caps, Glaciers, & Permanent Snow 5,773,000 24,064,000 68.7 1.74 Groundwater 5,614,000 23,400,000 -- 1.69 Fresh 2,526,000 10,530,000 30.1 0.76 Saline 3,088,000 12,870,000 -- 0.93 Soil Moisture 3,959 16,500 0.05 0.001 Ground Ice & Permafrost 71,970 300,000 0.86 0.022 Lakes 42,320 176,400 -- 0.013 Fresh 21,830 91,000 0.26 0.007 Saline 20,490 85,400 -- 0.006 Atmosphere 3,095 12,900 0.04 0.001 Swamp Water 2,752 11,470 0.03 0.0008 Rivers 509 2,120 0.006 0.0002 Biological Water 269 1,120 0.003 0.0001
Source: Igor Shiklomanov's chapter "World fresh water resources" in Peter H. Gleick (editor), 1993, Water in Crisis: A Guide to the World's Fresh Water Resources (Oxford University Press,
A significant portion of freshwater is inaccessible since 68.7% of freshwater is stored in glaciers and ice caps, leaving only 30.1% of ground water and 1.2% of surface water. As ground water requires extraction from aquifers via wells, people most commonly use surface water from rivers and lakes, which accounts for 0.0072% of total water on Earth. Therefore, although water covers 70% of planet Earth and may appear to be inexhaustible and abundant, only a small fraction is available for use, making it a valuable and precious resource.
Water Consumption and Usage
How is water used or withdrawn from the hydrologic cycle? The United Nations Food and Agriculture Organization (UN FAO) distinguishes three types of water withdrawal: agricultural, municipal, and industrial. Agricultural water withdrawal includes using water for irrigation, livestock, and aquaculture. Municipal water withdrawal describes domestic water use, such as drinking, washing, and cooking. Industrial water withdrawal supports multiple industrial processes, such as power plant cooling, chemical treatments, product fabrication, transportation, hydroelectric generation, and precision cutting (UN FAO 2016). Among these uses, food, paper, and chemical production consumes large amounts of water (CDC 2016). Water is also
withdrawn from the water cycle through evaporation into the atmosphere. UN FAO’s
AQUASTAT database, a tool that reports water statistics at the global and country levels, shows that after evapotranspiration, only 39% of the 110,000 cubic kilometers of annual precipitation converts to renewable freshwater.
The AQUASTAT tool also captures the water withdrawal ratios by geography. As depicted in Figure 2, at a global level, 69% of water withdrawal is attributed to agriculture, 19% to industrial use, and 11% to municipal use. The high agricultural water withdrawal is driven by
economies dependent upon agriculture, primarily in Africa and Asia, where agricultural water withdrawal accounts for 82% and 81% of each respective region’s water withdrawal.
Figure 2. Water withdrawal ratios by continent
Furthermore, with world population increasing 4.4 times over the last century, the water withdrawal has grown substantially, increasing 7.3 times (UN FAO 2016). Figure 3 depicts the levels of global water withdrawal from 1900 to 2010 in the major sectors of agriculture,
industries, and municipalities alongside the growth in global population over these years. Water withdrawal increased across all three sectors, with the most significant increase taking place between 1950 to 1960, and the agriculture sector consumes the largest amount of water by far.
Figure 3. Global population and water withdrawal over time Present and Future Global Water Crisis
Currently, 1.8 billion people drink from water sources contaminated with feces, placing them at risk of contracting diseases such as cholera, dysentery, typhoid, and polio (UN 2018). Water scarcity is derived from the annual water supply available in an area to the population. Hydrologists working together with the UN have set the threshold for water stress at 1,700 cubic meters per person and the threshold for water scarcity at 1,000 cubic meters per person. When the water supply in an area drops below 500 cubic meters, the population faces absolute scarcity. According to the UN, approximately 1.2 billion people—nearly one-fifth of the world’s
population—live in areas of water scarcity, and another 1.6 billion people—nearly one-fourth of the world’s population—lack the necessary infrastructure to access freshwater (UNDESA 2014).
Figure 4. Water stress by country
Evidently, the majority of countries in North Africa and the Near East face acute water scarcity, as do Mexico, Pakistan, South Africa, and large parts of China and India. The World Resources Institute’s study reveals that “37 countries currently face extremely high levels of water stress, meaning that more than 80 percent of the water available to agricultural, domestic, and industrial users is withdrawn annually.” Water scarcity affects not only the agricultural heartlands, but also the world’s most prosperous cities. The National Geographic study on global water scarcity assesses that 14 out of the 20 fastest-growing cities with the largest
economies and highest populations also experience water scarcity or drought conditions. These megacities depicted in Figure 5 include Beijing, Cairo, Delhi, Istanbul, London, Los Angeles, Mexico City, Mumbai, New York, Osaka, Rio de Janeiro, Sao Paulo, Shanghai, and Tokyo.
Figure 5. Global water scarcity
How will water scarcity spread in the future? Because human activity is the primary driver of water withdrawal, one must take into consideration the trajectory of the global
billion by 2050, and 11.2 billion by 2100. Increasing amounts of water will be required to sustain human life for a burgeoning world population with longer life expectancies. Not only will more people be consuming more water for municipal use, additional water will also be required to cultivate more agricultural crops and livestock to feed the growing population unless greater water efficiencies can be achieved. In fact, continuing on the current trajectory with water use outpacing the rate of population growth in the last century and climate change
impacting freshwater resources, the UN warns that the global water demand will outstrip supply by 40% in 2030 (UN 2018). Based on analysis conducted by the UN Development Program (UNDP), UN-Water, and UN FAO, “water scarcity is both a natural and a human-made
phenomenon,” a situation where adequate freshwater is depleted by uneven distribution, waste, pollution, and unsustainable water management.
The Impact of Agriculture on Water Scarcity
As discussed above, agriculture accounts for 70% of global water withdrawal. Based on the FAO’s review, “only about 17% of the world’s cropland is irrigated, but this irrigated land produces 40% of the world’s food.” With irrigated agriculture responsible for sustaining the world’s population yet also consuming vast quantities of freshwater, it is important to assess the irrigation water requirement against actual irrigation water withdrawal. The water withdrawn for irrigation “largely exceeds” the irrigation water requirement “due to significant losses in
distribution and application” (UN FAO 2016). These losses can be attributed to evaporative losses from the soil surface, transpiration from the plant surface, and inefficiencies in irrigation management (UN FAO 2016). Based on studies conducted by the United States Geological Survey (USGS), 40% of freshwater withdrawal in the U.S. can be attributed to irrigated
economy, but it consumes 85% of the water withdrawn (Myers & Kent 2001). To create a sustainable and water-secure future for the world, there is a clear need and opportunity to build solutions that drive water efficiency, particularly in the sector that requires the most water— irrigated agriculture.
1.2 Overview of SoilSense
SoilSense—a social enterprise originating from the MIT D-Lab, which focuses on developing practical solutions for global poverty challenges through collaborative approaches— aims to address the global water crisis through technological innovation. The vision of
SoilSense is to democratize precision agriculture technologies for the millions of small-scale and medium-scale farmers impacted by the global water crisis. In developing an affordable and robust Internet of Things (IoT) soil sensor system, SoilSense endeavors to enable farmers to irrigate more efficiently by matching the irrigation water withdrawal with the irrigation water requirement.
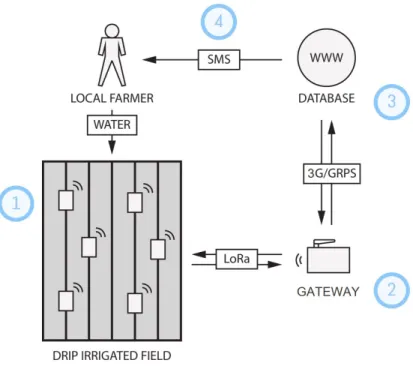
How does SoilSense’s technology work? SoilSense’s sensor system combines traditional and proven gypsum sensor technology with modern IoT communication tools, such as LoRa wireless communications, to notify farmers when the soil moisture is below set thresholds in different parts of their field. The notifications help farmers understand precisely when and where to irrigate. Figure 6 outlines the four-step process.
Figure 6. SoilSense sensor system
First, sensor nodes positioned around the field measure the soil moisture tension or soil water potential, which describes how much force or negative pressure the plant roots need to apply in order to extract water from the soil. Soil moisture tension is measured in kilopascals (kPa) or bars. The drier the soil, the harder it is for the plant to extract water, and the larger the numerical measure.
Second, the gateway receives the data from the sensor nodes via the LoRa wireless communication and sends the data to the cloud server via the 3G network. LoRa technology is ideal because of its long range and low power wireless platform that securely transmits data. This setup also provides added flexibility from the ability to partner with different local 3G providers.
Third, the data from the field are automatically processed in the cloud server. Depending on the farmer’s needs, the sensor readings can be analyzed in multiple ways in the cloud, and
only the most relevant data for the farmer are shared so as not to overload them with extraneous information.
In the fourth and final step, the farmer receives a text message notifying them when the soil moisture is low. The notification saves the farmer a significant amount of time from having to frequently check the soil moisture throughout the day. The simple four-step process is driven by a human-centered design approach, which places the small-scale and medium-scale farmers at the forefront of the design process.
1.3 Applying a Human-Centered Approach to Product Design
What is human-centered design, and why is it important to addressing the global water shortage? One could trace the roots of human-centered design back to Plato and the origins of grassroots democracy, where citizens have the ability to exercise power and express their needs through their elected representatives. The democratic method of engaging citizens—the
stakeholders of a nation-state—and building governing institutions and regulations based on the needs of these stakeholders echo the fundamental principles of human-centered design.
Fast-forwarding to the 1960s, participatory design—also known as the Scandinavian approach—began to gain traction in the design world (Di Russo 2012). In this approach, end users are integrated into the prototyping phase of design projects. Although this approach places a strong emphasis on usability, it pays little attention to the user experience and user emotions. Conflicts between design decisions and user feedback are often resolved by abandoning user testing for the sake of efficiency. The idea of co-design, or collaborative design, emerges from this conflict to transform end users into cooperative designers.
Norman focuses on the importance of understanding the user experience and user needs in the product development process. Norman defines the exemplary user experience as “meeting the exact needs of the customer, without fuss or bother.” He also credits “simplicity” and “elegance” as the key elements that “produce products that are a joy to own, a joy to use” (Norman &
Nielsen 2018). User-centered design and human-centered design are used interchangeably, but the latter delves deeper into driving creativity through a holistic, multidisciplinary mindset.
Global design and innovation company IDEO defines human-centered design as “a process that starts with the people you’re designing for and ends with new solutions that are tailor made to suit their needs.” Human-centered design is “all about building a deep empathy with the people you’re designing for; generating tons of ideas; building a bunch of prototypes; sharing what you’ve made with the people you’re designing for; and eventually putting your innovative new solution out in the world” (IDEO.org 2018). Today, human-centered design seeks to collaborate with the spectrum of users to understand not only their needs, but also their emotions and the social systems that underpin their needs. Because of its multidisciplinary and holistic approach, human-centered design is “seen to hold potential for resolving wider societal issues” by combining a people-focused perspective with a scientific approach toward creative problem solving (Di Russo 2012).
Architecture studio Kurani serves as a model and case study for how applying human-centered design and co-creating with users can generate powerful solutions. By engaging
educators and students to dive deep into the learning experience and pedagogy in schools, Kurani is employing human-centered design principles to build a school and education model that
architecture formed around the social construct of villages enables the formation of strong relationships; therefore, Kurani’s architectural design embodies the layout of a village with “intimate walkways, outdoor pavilions, and traditional courtyard housing” to encourage socializing. Equipping students with happiness and positivity will presumably by extension stimulate their overall development in the intellectual, physical, artistic, social, and
environmental domains.
Similarly, SoilSense’s soil sensor system adopts the human-centered design approach to build a solution that is tailored for small-scale and medium-scale farmers. The SoilSense team draws expertise from multiple disciplines—industrial design, electrical engineering, mechanical engineering, business, and agricultural development. A multidisciplinary skillset and mindset are not enough by themselves though. SoilSense also believes strongly in the importance of fostering robust local partnerships and engaging farmers to design the best-fit technology and user experience. Because of these design principles and the overarching goal to deliver direct social impact, SoilSense continuously engages with users throughout the design process to understand their user needs. Especially since small-scale and medium-scale farmers represent a unique segment of the population, observing their daily rituals on the farm, discussing their experience with growing and irrigating their crops, and understanding their emotional and functional pain points can generate invaluable insights from their user feedback. This user interaction and partnership are particularly critical throughout the prototyping process to inform the iterative design of the sensor system, validate the business model, and improve the overall user experience.
1.4 Research Questions
The SoilSense team has developed an initial sensor system prototype based on
preliminary market and field research. Several key engineering, design, and business decisions around the functionality, user experience, and pricing model need to be validated by more in-depth user research. The user research aims to address these three research questions:
1. What is an appropriate target pilot market for the SoilSense soil sensor system? 2. What are the gaps and pain points with current soil sensor technologies in relation to
the unique user needs of small-scale and medium-scale farmers?
3. What tools and features are helpful for small-scale and medium-scale farmers to increase crop yield and drive greater water efficiency?
The stakeholder selection and user research process are defined in Chapter 3 on Research Design and Methodology, and the detailed questions are available in the Appendix.
1.5 Synopsis
This thesis is organized in six chapters that provide an overview of how human-centered design is applied to help address the global water crisis by integrating user feedback into the iterative design and prototyping of SoilSense’s IoT sensor solution. Chapter One introduces the significance of effective water management in the irrigated agriculture domain, social enterprise SoilSense’s mission and human-centered design approach, and the key research questions arising in the early prototyping phase of the soil sensor system. Chapter Two maps out the irrigation and soil sensor technology landscape, analyzing the current gaps in soil sensor technology. Chapter Three delves into the research design and methodology by presenting an overview of the market research and describing the processes used to select and to interview stakeholders to
interviews, detailing the user demographics, avocado growing techniques, irrigation methods and tools, and user needs. Chapter Five analyzes the perspectives shared by avocado farmers and stakeholders to understand points of convergence and divergence in their avocado growing and irrigation practices. Finally, Chapter Six consolidates the analysis to address the original
research questions, frames the user research in the broader academic context of related literature, and identifies areas of opportunity for future studies.
Chapter 2
Literature Review
2.1 Overview of Irrigation
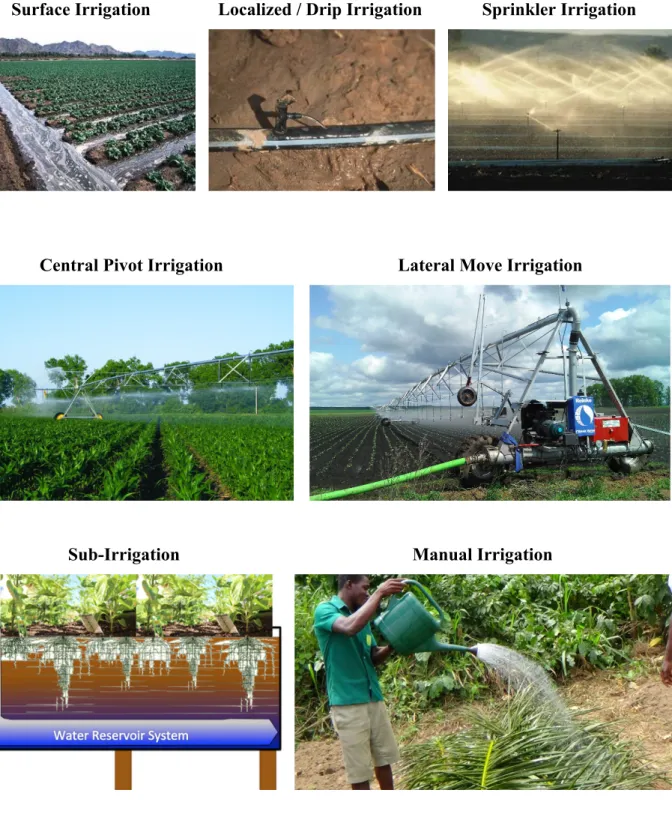
Irrigation refers to the artificial provision of water to sustain growing plants and accounts for the majority of water withdrawal. Oftentimes, farmers supplement natural rainfall with irrigation to cultivate crops. The Center for Disease Control (CDC) defines eight common types of irrigation systems based on how the water is distributed through the field: surface irrigation, localized irrigation, drip irrigation, sprinkler irrigation, central pivot irrigation, lateral move irrigation, sub-irrigation, and manual irrigation. These different irrigation methods are depicted in the Figure 7.
Surface Irrigation Localized / Drip Irrigation Sprinkler Irrigation
Central Pivot Irrigation Lateral Move Irrigation
Sub-Irrigation Manual Irrigation
Irrigation Systems: Average Application Efficiency
Among these different types of irrigation methods, drip irrigation achieves the highest average application efficiency (90%) due to its high water storage to water application ratio (Smith et al. 2014). The localization of drip irrigation delivers water droplets directly at or near the root of plants, therefore minimizing evaporation and runoff. By comparison, surface
irrigation achieves 60% average application efficiency, and sprinkler application achieves 75% application efficiency (Smith et al. 2014). Surface irrigation fills the land with water by gravity without any mechanical pumps, while sprinkler irrigation disperses water like natural rainfall from a central location in the field or via sprinklers on moving platforms.
Irrigation Systems for Small-Scale and Medium-Scale Farmers
Taking into account the specific stakeholders for SoilSense, small-scale and medium-scale farmers, additional irrigation selection factors need to be considered. The FAO’s guide on Irrigation Techniques for Small-Scale Farmers: Key Practices for Disaster Risk Reduction Implementers highlights several micro-irrigation techniques promoted by international agencies and specialized non-governmental organizations (NGOs).
It is important to note for the purposes of user experience design that the majority of small-scale farmers in developing countries continue to rely on manual irrigation today. These farming households irrigate 50 to 100 m2 using tools such as watering cans locally produced from galvanized iron, plastic, or natural materials (e.g., bottle gourds). It only costs $5 USD or less for a watering can to irrigate an area of 100 m2 or $500 USD per hectare (ha) (Smith et al. 2014). This method, however, is the most labor intensive, with labor costs ranging from $1,200 USD to $1,500 USD per ha per season based on the distance to the water source, assuming $1
USD per workday and a crop with a water requirement of 3,000 m3 / ha. Therefore, the combined labor and technology costs can amount to $2,000 USD / ha.
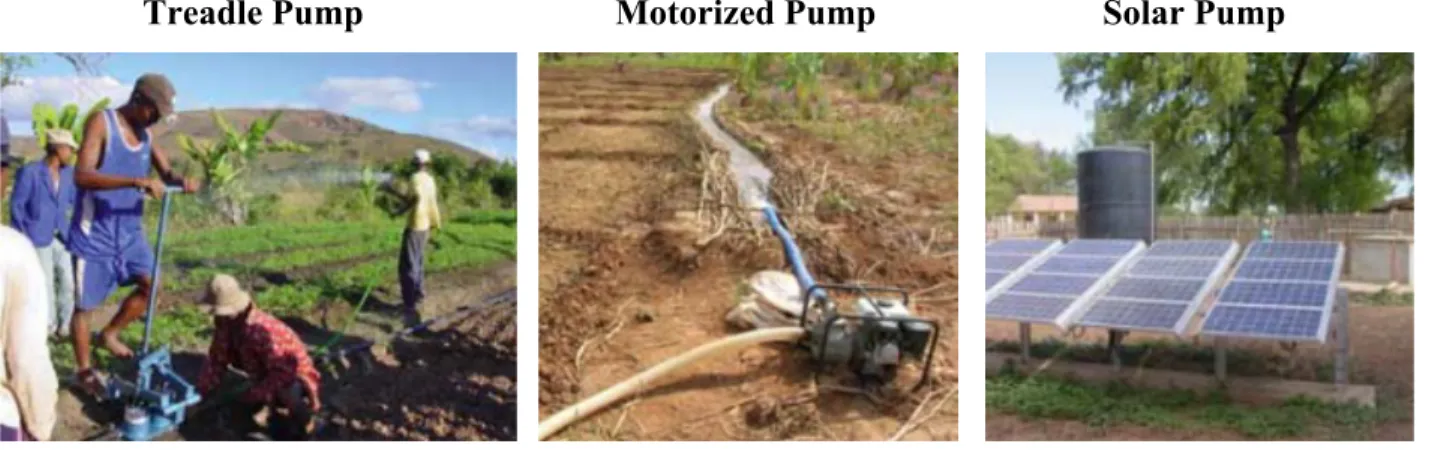
International agencies and NGOs have introduced these micro-irrigation techniques to make groundwater sources available to small-scale farmers: treadle pumps, motorized pumps, and solar pumps (Smith et al. 2014). The treadle pump lifts water from up to a maximum depth of 7 m and irrigates 2,000 to 3,000 m2 at a rate of 1 L per second, requiring at least 4 hours of pumping per day. Operating via a pressure or gravity outlet, the treadle pump works most effectively in areas with shallow groundwater at less than 3 m deep. Labor costs amount to $150 USD for a set of intake and output hoses, or $600 USD / ha, and the technology requires an investment of $120 USD per treadle to irrigate 2,500 m2, which equates to $500 USD / ha. Therefore, the combined labor and technology costs can amount to $1,100 USD / ha. Motorized pumps support areas of 5 to 200 ha in village irrigation schemes; however, they can also support areas of 1 to 5 ha for more established small-scale farmers who can afford the $200 to $500 USD technology and $500 / ha per season operational costs. Solar pumps, on the other hand, have limited energy outputs and irrigate smaller areas of 0.3 to 1 ha. Although operational and maintenance costs are relatively low, ranging from $50 to $100 USD / ha, solar pumps require a high initial investment ranging from $10,000 USD / ha to $15,000 USD / ha. Treadle, motorized, and solar pumps can save farmers tremendous amounts of time transporting water across
distances, and they can be connected with low-pressure pipe distribution systems or drip systems to irrigate fields. These three systems are depicted in Figure 8.
Treadle Pump Motorized Pump Solar Pump
Figure 8. Irrigation systems
Beyond pumps, shallow wells, canals, and pipe conveyance systems are additional methods to tap into groundwater resources. These systems require technical support for proper design, construction, and installation. Irrigation systems can also be implemented at the
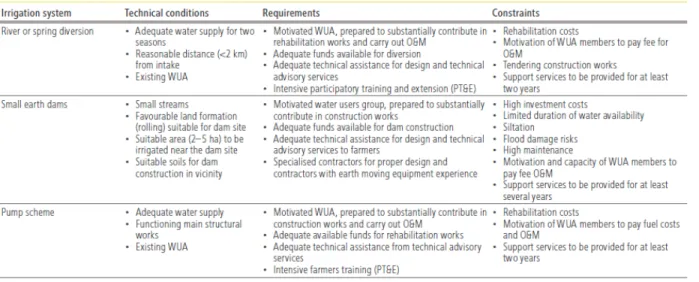
community level. The FAO delineates three basic types of small-scale or community irrigation schemes: river or spring diversion, small earth dams, and pump scheme. These systems can support from 5 to 200 ha and require community involvement in the planning, operation, and maintenance phases to ensure a successful deployment. High operational costs and ongoing maintenance may pose a burden to small-scale farmers. Their respective technical conditions, requirements, and constraints are defined in Table 2.
Table 2. Technical conditions, requirements, and constraints for various irrigation systems
What factors do small-scale farmers need to consider when selecting the best-fit irrigation system? First, the farmers need to evaluate how far away the freshwater sources are from their field and how much water is available for irrigation during the different seasons. Then, the farmers need to determine which areas of their field are suitable for irrigation based on the fertility of the soil, landscape of the terrain, and crop type. Before deciding upon an irrigation technique, the farmer needs to conduct an assessment of the total costs, complexity of the installation, ease of operations and maintenance, and learning requirements. Government agencies and NGOs operating in the area may be able to provide consultative, financial, and training support to ensure that farmers have the adequate provisions for water sourcing, conveyance, and distribution across their fields (Smith et al. 2014).
Table 3 illustrates the main elements for consideration in an irrigation water supply system, summarizing the technical conditions, requirements, and constraints related to the different irrigation techniques.
Table 3. Technical conditions, requirements, and constraints for various irrigation techniques
Furthermore, Table 4 outlines the investment costs and operational costs for the different irrigation technologies.
Table 4. Investment and operational costs for various irrigation technology
2.2 Overview of Soil Moisture Sensing
While irrigation technology is important for ensuring that crops receive the necessary water to thrive when there is inadequate rainfall, soil sensor technology supports irrigation decision-making by providing farmers with information on when, how much, and where to
terms used to quantify the moisture content. Key measurements of moisture include: 1) soil water content, 2) soil water potential, and 3) plant available water.
Soil water content refers to the amount of water in a given amount of soil and is
expressed either as a percentage of water by weight or volume of soil or as inches of water per foot of soil. Based on the type of soil, there are higher and lower water storage capacities. It is important to note that a higher water holding capacity does not equate to more water available for plants to use. Figure 9 showcases the storage capacities of different soil types.
Figure 9. Amount of water available and unavailable for plant growth in various soil types The interaction between soil type, water holding capacity, and water availability is illustrated in Figure 10.
Typically, sandy soils have lower water storage capacity while clay soils have higher water storage capacity. In other words, sandy soils are moist or saturated at 20% volumetric water content, but clay soils are nearly dry at the same measurement (ICT International 2014). Interpreting soil water content, therefore, requires an understanding of different soil physical properties such as its texture, structure, and porosity. On the other hand, the soil water potential measures moisture independently of these variables and works irrespective of the soil type; therefore, soil water potential is considered the “universal technique” for soil measurement (ICT International 2014).
Soil water potential is also referred to as soil moisture tension or matric potential. The soil water potential measures how much water clings to the soil, which translates into how much pressure the plant must exert to draw water from the soil. The drier the soil, the more energy the plant expends to draw water, which means the greater the soil water potential, or the more
negative the number is in kilopascals (kPa) or centibars (cb). The units of kPa and cb correspond in a 1-to-1 ratio. Per ICT International, the field capacity or optimal moisture potential for agricultural plants is set at -33 kPa, while the permanent wilting point or point of plant mortality is set at -1,500 kPa. Field capacity and permanent wilting point vary from plant to plant based on the species. The plant available water, or the amount of water that is readily available to the plant, is derived from the difference between the field capacity—the upper limit of water that the soil can hold after excess water is drained by gravity—and the permanent wilting point—the lower limit of water beyond which the plant can no longer extract water from the soil. Table 5 provides Watermark’s guidelines for interpreting soil matric potential readings.
Table 5. Watermark's guidelines for soil matric potential readings
Soil Matric Potential (in cb or kPa)
Implication for Irrigation
0-10 Saturated soil
10-30 Soil is adequately wet (except coarse sands, which are beginning to lose water)
30-60 Usual range for irrigation (most soils) 60-100 Usual range for irrigation in heavy clay
100-200 Soil is becoming dangerously dry for maximum production
Multiple elements contribute to the magnitude of the soil matric potential, including the soil water content, the soil pores’ size, surface properties of the soil particles, and surface tension of the soil water (Whalley et al. 2013). Combined adsorption forces at the soil-water interfaces and surface tension forces at the air-water interfaces result in hydrophobic or hydrophilic soils (Soil Management 2018). Although clay soils tend to have a higher water storage capacity, the clay structure is composed of smaller pores that hold water at higher suction pressures, which require more plant energy to extract. Whalley et al. describe these forces and interactions in mathematical terms. In clay soils, the matric potential (ψm) is a combination of the effects of hydrostatic pressure (P) and osmotic pressure (πD) as defined in the equation P=ψm–πD. In sandy soils where there is negligible surface charge, the matric potential equals the hydrostatic pressure, or P=ψm.
According to Whalley et al., “both water content and matric potential need to be measured if soil water status is to be fully described.” The van Genuchten function maps the relationship between the soil water content and the matric potential for agricultural soils. Referred to as the water release characteristic, this relationship assumes the form of a sigmoidal and highly non-linear water release curve with three distinct regions as shown in Figure 11
Figure 11. Water release characteristic
When the water content is saturated, the soil is “tension saturated” because no water will drain. Air gains entry into the soil matrix at the “air entry potential” and continues to invade the soil matrix through the “capillary fringe” as the matric potential becomes more negative and the soil dries. At low levels of water content, there is a corresponding low matric potential represented through a very negative matric potential, and the soil is characterized to have “residual water content” when the meniscus at the air-water interface becomes disconnected. Figure 12 illustrates the varying water release characteristics for sand, loam, and clay soil types.
Figure 12. Water release characteristics for sand, loam, and clay soil types
Variables such as the soil type, soil damage, and soil structure can all affect the water release characteristic. Due to these variables and the non-linear relationship between the soil water content and matric potential, estimating the matric potential from the soil water content can be inaccurate. Instead, the use of soil sensors provides a more reliable reading of the soil matric potential.
2.3 Overview of Soil Sensor Technology
The majority of farmers use the hand feel method to determine the amount of water content in the soil. The farmer simply scoops up a mound of soil near the plant root zone and
thumb and index finger to observe how far the ribbon extends, as depicted in Figure 13; the longer the soil ribbon, the more moisture it contains.
Figure 13. Soil moisture feel test
To produce a more precise reading on soil moisture, different tools and technologies are available in the marketplace. The most commonly used tools include: 1) electrical resistance blocks known as gypsum blocks, 2) tensiometers, 3) time domain reflectometry, and 4) frequency domain reflectometry.
Electrical resistance blocks are made up of two electrodes embedded in a gypsum block, which is a soft sulfate mineral. In her research on Measurement of Soil Moisture Using Gypsum Blocks, Birgitte Friis Dela notes that gypsum blocks have been used in soil science for the past fifty years. Gypsum blocks are installed in the soil typically near the top third and bottom third of the active root zones to facilitate the start and end points of the irrigation cycle (Irrometer 2018). When an electric current is sent through the gypsum block, it generates a reading of the electrical resistance between the two electrodes, which correlates directly with the soil water content. When the soil is saturated, the gypsum block holds more water, which creates a lower electrical resistance. As the soil dries, the gypsum block loses water, which increases the
kPa to -1,500 kPa and do not measure moisture content as well between 0 to -100 kPa. Figure 14 depicts Watermark’s gypsum sensor on the left and Delmhorst’s gypsum block on the right.
Figure 14. Watermark and Delmhorst gypsum sensors
While electrical resistance blocks can provide fairly accurate measurements, the accuracy is impacted by the installation of the blocks, the block temperature, and blocked pores (ICT International 2018). The blocks must first be soaked prior to installation, and the blocks should be placed in undisturbed soil that reflects the soil profile in the active root zone.
Tensiometers comprise a pressure gauge attached to the top of a column of water in a plastic or glass tube resting on a porous ceramic cup that is embedded in soil. When the soil is at capacity, the ceramic cup will hold the column of water in place. When the soil begins to dry and is no longer at field capacity, water seeps through the ceramic cup. The movement of water through the tensiometer creates a vacuum that is reflected in the pressure gauge. The higher the reading on the gauge, the drier the soil. Because tensiometers provide a direct measurement of matric potential, they tend to be the preferred type of sensor (Whalley et al. 2013). While tensiometers typically provide reliable and accurate readings, particularly in higher soil moisture ranges up to around -85 kPa, the water in the column needs to be refilled when the vacuum is low, and a hand pump needs to be used to remove air from the tube (Texas A&M 2018).
Figure 15. Tensiometer design and installation
The Irrometer tensiometer uses the graph in Figure 16 to chart the upper and lower thresholds of water depletion, which correspond to the reference dry value and the reference wet value. Watermark recommends irrigating when 50% of the available water is depleted (the vertical yellow line) and stopping irrigation around 10% available water depletion (the vertical aqua line), factoring in the soil type.
Figure 16. Soil suction and available water depletion
Time domain reflectometry, like gypsum blocks, determines soil water content through electrical measurements. In 1980, Clarke G. Topp introduced a time domain reflectometry method to determine soil water content in his article titled Electromagnetic Determination of Soil Water Content: Measurements in Coaxial Transmission Lines, which represents one of the foremost publications on the calibration of time domain reflectometers (Antle 1997). An electromagnetic pulse is sent through metal probes placed in the soil, which generates an electrical capacitance measurement recorded on an oscilloscope when the pulse reaches the end of the probe and is reflected. How quickly the pulse is reflected, or the travel time of the
Figure 17. Time domain reflectometry sensor
Given the complex electrical field around the probes used in both time domain
reflectometry and frequency domain reflectometry, the sensor needs to be calibrated for different soil types. Frequency domain reflectometry uses sensors that are less expensive and produce a faster response time compared to time domain reflectometers; however, the latter is known to produce more accurate measurements. British researcher R. L. Smith-Rose first documented the use of frequency domain technology to relate soil moisture in 1933 in his paper The Electrical Properties of Soil for Alternating Currents at Radio Frequencies (Antle 1997). The frequency domain system consists of two electrodes embedded in the soil through which an oscillating current is driven. Figure 18 depicts a capacitance probe connected to a solar power system used in frequency domain reflectometry. The voltage equals the current multiplied by the soil
capacitance. As the soil water content increases, the soil capacitance increases. In other words, soil with more moisture has a greater ability to transmit electrical current (Martin 2018).
Figure 18. Frequency domain reflectometry sensor
2.4 Analysis of the Gap in Soil Sensor Technology
Due to limitations in the operating range of tensiometers, the academic research-oriented design of time domain reflectometers and frequency domain reflectometers, and the average higher price points for these three sensor technologies, SoilSense’s market research into the competitive sensor landscape did not focus on these areas. Instead, SoilSense evaluated what is currently available in the market for electrical resistance sensors and capacitive sensors to understand where there may be opportunities for product innovation. SoilSense also reviewed smart sensors solutions that incorporated IoT, cloud-based analytics, and artificial intelligence (AI) systems.
To facilitate comparisons across sensor systems, one needs to apply a common baseline for the number of sensors that are required within a given area. The Meter Group states that the number of sensors depends on the heterogeneity of the soil and topography. The more
heterogeneous the environment (e.g., existence of hills and valleys, seasonal precipitation, diverse canopy cover), the more sensors are required in areas that represent the major sources of heterogeneity. Irrometer advises installing two sensor stations per 40 acres (~16 hectares) at a
measurement at two depths—the central and lower root zones. To factor in the heterogeneity of the land, irrigation specialists recommend using 6 to 8 sensors are per hectare (3 to 4 sensor nodes with sensors installed at 2 depths).
Electrical Resistance Sensors and Meters
Table 6 provides the company, photo, description, price, warranty policy, and power requirement for prevalent electrical resistance sensors and meters. Generally, electrical
resistance sensors are considered to be the most affordable sensor solution due to the low cost of gypsum blocks. Per irrigation specialist Hal Werner’s assessment, irrigating a field using electrical resistance blocks costs from $1.50 to $5 per acre factoring in the cost of resistance blocks ($5-$30) and meters ($150-$300). Werner’s cost assessment is on par with Watermark Irrometer’s estimates of $6-$35 resistance blocks and $250 meters. Prices provided on company websites lean toward the upper range of these estimates though, with industry leader Watermark pricing their sensor at $44.20 and their IRROmesh data logging system at $1,595. It is important to note that gypsum blocks can decompose or be damaged through exposure to the elements; therefore, they need to be replaced after 2 years (Werner 2002). Both analog and digital meters can be connected to gypsum sensors to generate readings. A common setup involves the farmers manually connecting the meter to the sensor, viewing the measurement, writing down the
measurement, connecting the meter to the next sensor, and repeating the process. More advanced meters, referred to as data loggers, automatically record soil moisture readings from different sensors across the field, and the data is available for review and analysis through the company website and / or mobile application. These data loggers are available at a higher price point and can even be integrated with the irrigation management system to automatically turn on
Table 6. Comparison of electrical resistance sensors
Company Model Photo Description Price Warranty Power
Delmhorst KS-D1 Digital Soil Moisture Tester with GB-1 Gypsum Sensor Blocks Soil moisture tester and gypsum sensor blocks; moisture range 10-1,500 kPa - $350 (KS-D1 meter) - $120 (GB-1 pack of 10) 1-year 9V Watermark 200SS
Sensor Sensor consists of a pair of highly corrosion resistant electrodes that are imbedded within a granular matrix; moisture range 0-239 kPa - $44.20 (5-ft
cable) 1-year N/A
Watermark
30-KTCD-NL Meter Handheld device designed for reading sensors in the field; moisture range 0-199 kPa; minimum 2 stations per 40 acres - $240 1-year 9V Watermark 900M
Monitor Data logger that automatically records soil moisture readings - $575 (monitor only) 1-year 9V Watermark 975 IRROmesh Node Wireless solar powered data logging system; up to 20 sensing locations; max 3 sensors per node
- $495 (base) - $330 (relay node) - $745 (logger) - $1,595 (cellular gateway, battery pack & solar panel) 1-year Solar panels on 2 sides Capacitive Sensors
Table 7 showcases a range of capacitive sensors available in the market, including the company, photo, description, price, warranty policy, and power requirement. Unlike electric
are designed for both indoor and outdoor plant use and do not require a separate meter. Depending on the performance and functionality of the sensor, the depths at which it can
measure, and the length of the cable, the prices for capacitive sensors featured in the table below range from $9.68 to $279.99. Similar to electric resistance blocks, capacitive sensors can be connected to a meter or data logger to display measurements and help manage the irrigation schedule. Sentek, Decagon, and Vegetronix are “the best of the high-frequency capacitance probes”; however, the most affordable sensor among these three, Vegetronix, “has a small volume of measurement” (Robinson 2018).
Table 7. Comparison of various capacitive sensors
Company Model Photo Description Price Warranty Power
Alotpower Soil Moisture Sensor Meter
Soil moisture sensor meter for garden, farm & indoor / outdoor plants - $9.68 N/A No batteries Decagon 10HS Moisture Soil moisture sensor that measures volumetric water content (0-57%), dielectric permittivity - $139 1-year 3VDC at 12mA to 15 VDC @ 15mA Extech MO750 Soil Moisture Meter Soil moisture meter with 8-in. probe; measures 0-50% volumetric water content - $279.99 N/A 4 AAA batteries Sentek Diviner 2000 Sentek Soil Moisture Sensor
Probe and hand-held data logging display unit; capacitance sensor; stores data from up to 99 sites - N/A 30 days from date of purchase 13.8V DC 800 mA regulated power pack or a 15V universal (100-250V) AC Adaptor Toro Precision Soil Sensor
Soil moisture & temperature sensor; Up to 152 m wireless communication
- $109.99-$195 (probe & receiver) - $56.98-$59.82 (sensor only) 2-year 3 AA batteries Vegetronix VH400 Soil Moisture Sensor Soil moisture sensor probes; capacitive sensor ; measures % volumetric water content - $39.95 (2-m cable) - $45.95 5-m cable) - $55.95 (10-m cable) N/A DC supply or 3.5-20V batteries Vegetronix VG- METER-200
Hand held soil moisture meter with digital display - $88.95 - $109.95 (with USB & VH400 sensor) N/A 2 AA batteries Vegetronix Universal Sensor Display Back-lit graphical LCD and touch button interface to display sensor data - $79.95 (2-m cable) - $85.95 (5-m cable) - $95.95 (10-m cable) N/A N/A
Smart Soil Sensors
Table 8 showcases a range of smart soil sensors available in the market, including the company, photo, description, price, warranty policy, and power requirement. Geared toward data enthusiasts who need real-time measurements of soil moisture, temperature, humidity, nutrition, and other influencing elements, smart soil sensors provide farmers with the greatest accessibility to the data in their field. Several of these smart soil sensor companies are gaining traction through Kickstarter campaigns, which points towards a sales strategy targeted toward millennial farmers and growers who are more likely to be early agricultural technology adopters. On Kickstarter, 2,336 backers pledge $384,201 to Edyn, and 877 backers pledged $96,690 to Plant Link. These farmers stay abreast of agricultural innovation and appreciate the convenience of managing their farms with the assistance of their smart devices. Strong wireless connectivity is critical to supporting the system, and often times the data and cloud analytics come at a steep price point due to subscription-based services with high annual reoccurring fees. Furthermore, complex user interfaces can inundate farmers with data in a way such that the data overwhelms instead of supports the critical irrigation decision-making process.
Table 8. Comparison of various smart soil sensors
Company Model Photo Description Price Warranty Power
CropX Basic Sensor
Soil moisture & temperature monitoring on the cloud; measures at 8″ & 18″; 1 sensor per 40 acres - $600 - $275 (1-year subscription) 1-year Batteries included CropX Pro Sensor
Soil moisture & temperature monitoring on the cloud; measures at 8″ & 18″; 1 sensor per 40 acres - $699 - $275 (1-year subscription) 1-year Rechargeable unit CropX Deep
Sensor Soil moisture & temperature monitoring on the cloud; measures at 8″, 18″ & 36″; 1 sensor per 40 acres
- $899 - $275 (1-year subscription) 1-year Rechargeable unit Edyn Garden
Sensor Solar-powered sensor connected to Wi-Fi; tracks light,
humidity, temperature, soil nutrition & moisture
- $79 (Kickstarter earlybird) - $99.97 (retail) 1-year Solar-powered; rechargeable lithium polymer battery PlantLink Wireless Plant Sensor
System that monitors water needs of lawn, garden, or house plants; sends alerts & can auto-water; sensors reach 100-300 ft. - $79 (Kickstarter early bird – base station & 3 links) - $99 (base station & 3 links) - $149 (base station & 5 links) 1-year 2 AAAA batteries Pycno Sensor
Kit Master sensor / gateway & node sensor to detect capacitive soil moisture, humidity & temperature; Wi-Fi connection via SIM card; sensor range of 500 m
Kits with master sensor, 3 node sensors, installation kit & global SIM: - $1,799 (30-cm length) - $1,999 (60-cm length) - $2,199 (90-cm length) N/A 2W solar panel & internal battery Zenvus Smart-farm Intelligent electronics sensor; collects & wirelessly transmits data on humidity, temperature, pH, - $200 (node) - $300 (master Wi-Fi) - $300 (master GSM) N/A Solar-powered with backup batteries
How do existing sensor technologies compare? The three categories of sensor types each possess a mix of advantages and disadvantages. Although existing electrical resistance sensors have relatively low equipment costs, the analog design used in many cases requires a more labor intensive approach to view, track, and manage the data and a manual approach to derive insights from the data. Capacitance sensors generate measurements at a high frequency; however, affordable capacitance sensors only measure small volumes. Finally, smart soil sensors provide farmers with a plethora of information. While this data may be useful, it can be challenging to understand how to apply the data due to the large volume of data that is captured. Furthermore, smart soil sensors have very high price points in comparison to electrical resistance sensors and capacitance sensors. Through this review of existing sensor solutions coupled with findings from user research conducted with farmers detailed in Chapter Five, it is evident that there is an opportunity to design an affordable electrical resistance sensor that minimizes the labor cost by reducing the manual labor required, helps the farmer quickly determine when, where, and how much he or she needs to irrigate, and better integrates into the farmer’s farming processes.
Chapter 3
Research Design and Methodology
3.1 Market Research
In order to understand the global water crisis, identify a target pilot market, and
comprehend the irrigation and soil sensor technology landscape, I draw upon both quantitative and qualitative data from multiple sources. Comprehensive reports prepared by UN agencies including the FAO, UN-Water, and UNDP and studies conducted by U.S. governmental organizations including the USGS and CDC present a picture of how the global water crisis came to be and the factors that lead to the forecast of growing scarcity and stress. Agricultural studies and market reports prepared by various agricultural academic institutions are used to analyze which geographies and crops are the most suitable for deploying soil sensor technologies based on the criteria established in Chapter 2. Finally, academic research involving soil science and irrigation specialists is supplemented by commercial studies conducted by sensor companies such as Watermark to analyze the current soil sensor technologies, irrigation practices, and avocado growing techniques.
group through assessing different geographic markets and crop markets based on the following seven market criteria:
- Geographic markets that are susceptible to water scarcity or water stress - Geographic markets with economies that depend upon agriculture - Crops with high moisture and drought sensitivity
- Crops that produce large volumes and yield high returns
- Crops where farmers are already using a form of soil moisture sensor - Crops experiencing a growing market demand
- Crops that require irrigation
The assessment covered the following geographic markets and crop markets, which met different aspects of the aforementioned market criteria:
- Geographic markets: Brazil, Chile, China, India, Mexico, Peru, South Africa, and the United States
- Crop markets: avocados, cauliflower, coffee, collards, cotton, cucumbers, eggplants, okra, peppers, tomatoes, watermelon, and wine grapes
From the above two lists, I honed in on avocados grown in Southern California, factoring in the seven market criteria and my ability to access and communicate with key users in the market.
After identifying the target market, I first reached out to professors and researchers in Southern California from the University of California (U.C.) Riverside, U.C. Cooperative Extension, CalPoly San Luis Obispo, and Fresno State Center for Irrigation Technology.
Speaking with avocado and irrigation experts helped me develop a baseline understanding of the local challenges and also led to connections with four avocado growers who were open to setting
representatives with contact information publicized on the California Avocado Commission website. Each potential lead received an introductory e-mail followed by a phone call. Surprisingly, the cold outreach yielded positive responses as the majority of avocado growers were eager to contribute toward research that could improve their water use efficiency and crop yield. Only a handful turned down the request for an interview and visit, citing time conflicts during the period. The overall high willingness to contribute and share their challenges served as a preliminary validation of the market opportunity and clear need for a solution. As more
avocado growers agreed to interviews, they also recommended neighboring growers and expanded my list of contacts.
It is important to note that this user selection process lends itself to creating a self-selected group of voluntary avocado growers who share some of the following attributes:
- Have an affiliation with avocado academic research and / or the California Avocado Commission
- Demonstrate an interest in or are open to exploring technological tools to improve avocado growing practices
- Stay abreast of avocado growing best practices and can be considered early adopters Due to these user attributes, findings from the user research may skew toward representing the subset of avocado growers who are the most motivated and likely to implement technologies such as SoilSense’s soil sensor system.
Table 9 provides an overview of the demographic range of avocado stakeholders interviewed in person.
Table 9. List of interviewees
Interviewee Role Age Range Gender Location Experience Years of Avocado Acreage
Agriculture
technologist 41-65 Male Fallbrook, CA 22 N/A
Manager 41-65 Male Temecula, CA 15 2,000
Owner 40 and
under Male Bonsall, CA 4 38
Owner 40 and
under Male Bonsall, CA 5 60
Owner 40 and under Male Pauma Valley, CA 16 1157 Owner 40 and under Male Valley Center, CA 11 17
Owner 41-65 Male Bonsall, CA 2 16
Owner 41-65 Male Escondido, CA 40 100
Owner 41-65 Male Fallbrook, CA 7 12
Owner Over 65 Male Escondido, CA 45 29.5
Owner Over 65 Male Fallbrook, CA 47 1030
Owner / manager 40 and
under Male
Valley Center,
CA 4 181
Owner / manager Over 65 Male Temecula, CA 10 12
Packing house 40 and
under Female Escondido, CA 13 N/A
Packing house 41-65 Male Escondido, CA 34 62
Packing house 41-65 Male Fallbrook, CA 32 175
University researcher
40 and
under Female Riverside, CA 11 N/A
University
researcher 41-65 Female Fallbrook, CA 33 N/A
University
researcher 41-65 Female Riverside, CA 28 30
University
researcher 41-65 Male Irvine, CA 26 20
The selected users comprise avocado farmers, packing house representatives, farm consultants, and university researchers based in the San Diego county area spanning the areas of Bonsall, Escondido, Fallbrook, Pauma Valley, Riverside, Temecula, and Valley Center. The interviewees average 20 years of experience, and their avocado farms range from 12 to 2,000 acres. While both their years of experience and age range across wide spectrums, the majority of the selected users assume responsibilities related to observing, collecting, and/or analyzing the data from
3.3 User Research Process
Data from users is collected via in-person interviews and farm visits. The duration of the interviews and farm visits range from 1 to 3 hours. The primary objectives of speaking to farmers and subject matter experts are to understand the nuances of growing specific crops, challenges in irrigation and other areas, and how technology and data analytics are currently used on farms. The interviews follow these procedures and protocols stipulated by the Committee on the Use of Humans as Experimental Subjects (COUHES):
- Before the interview begins, the interview participant is informed that they may choose to answer or not answer any questions and to stop the interview at any time or for any reason.
- The interview participant is then asked for their verbal consent to participate and for their consent to record the interview (notes and / or audio), to photograph their farm, and to publish results from the research with the understanding that all interview recordings would be stored in a secure work space until the completion of the research project, after which the recordings would be destroyed.
- The interview will include questions on their farming experience, pain points in growing crops, their vision for how technology could improve their operations, and their feedback on the SoilSense prototype. During the interview, notes are taken to document their responses and observations of their reactions and interactions on the farm.
- If any photographs of the interviewee are taken during the interview, the interviewee is asked to sign a MIT Media Release Form to grant MIT the license to use and
- Following the interview, the interview participant is thanked and asked if they would be willing to respond to follow-up questions, should any arise. They are also
provided with the investigators’ contact information so that they may reach out and share any additional information.
Although a comprehensive list of questions has been developed, a more conversational approach is purposely used to facilitate the discussion with the farmers and to encourage open and honest dialogue. This approach invites farmers to freely share their perspectives on general farm operations, avocado growing and technology, SoilSense technology, and the business model for agricultural tools. The free-flowing discussion also presents farmers with the opportunity to hone in on pain points and topics that they are passionate about. The
comprehensive list of questions can be found in the Appendix along with a visual aid to gather user feedback on which type of message farmers would prefer to receive regarding their field’s soil moisture levels and irrigation readiness.
Chapter 4
Research Results
4.1 Stakeholder Analysis
As described in Chapter Three, a total of 15 avocado farm visits involving 20 avocado stakeholders were conducted in San Diego county, California, to understand different avocado growing methods, irrigation methods and tools, and key user needs for this group. Distinctive attributes that characterize this group are summarized below.
4.1.1 Role
The diverse group of stakeholders involved in this user study include the following number of people in different roles:
• 9 avocado farm owners
• 1 manager for avocado farms owned by others • 2 people who are both owners and managers
• 3 university researchers from U.C. Riverside and the South Coast Research and Extension Center