HAL Id: tel-02133640
https://hal.archives-ouvertes.fr/tel-02133640
Submitted on 19 May 2019HAL is a multi-disciplinary open access archive for the deposit and dissemination of sci-entific research documents, whether they are pub-lished or not. The documents may come from teaching and research institutions in France or abroad, or from public or private research centers.
L’archive ouverte pluridisciplinaire HAL, est destinée au dépôt et à la diffusion de documents scientifiques de niveau recherche, publiés ou non, émanant des établissements d’enseignement et de recherche français ou étrangers, des laboratoires publics ou privés.
Risk of eutrophication in the Saigon River: impacts of
the Ho Chi Minh City Megacity (Vietnam)
Thi Ngoc Tuyet Nguyen
To cite this version:
Thi Ngoc Tuyet Nguyen. Risk of eutrophication in the Saigon River: impacts of the Ho Chi Minh City Megacity (Vietnam). Biodiversity and Ecology. UGA - Université Grenoble Alpe, 2018. English. �tel-02133640�
THÈSE
Pour obtenir le grade de
DOCTEUR DE LA COMMUNAUTE UNIVERSITE
GRENOBLE ALPES
Spécialité : Sciences de la Terre et Univers, Environnement
Arrêté ministériel : 01 novembre 2015
Présentée par
« Thi Ngoc Tuyet NGUYEN »
Thèse dirigée par Julien NEMERY et Nicolas GRATIOT
préparée au sein du Institut des Géosciences de l’Environnement (IGE) dans l'École Doctorale TERRE ET UNIVERS, ENVIRONNEMENT
Risk of eutrophication in the
Saigon River: impacts of the Ho
Chi Minh City Megacity (Vietnam)
Thèse soutenue publiquement le « 19 décembre 2018 », devant le jury composé de:Sarah DORNER
Professeure, Polytechnique Montréal, Canada (Rapportrice) Florentina MOATAR
Directrice de Recherche IRSTEA, France (Rapportrice) Josette GARNIER
Directrice de Recherche CNRS, UMR METIS, France (Examinatrice) Jean MARTINS
Directeur de Recherche CNRS, UMR IGE, France (Président du jury) Phuoc-Dan NGUYEN
Associated Professor, HCMUT, Vietnam (Examinateur) Julien NEMERY
Maitre de conférences HDR, Grenoble INP, UMR IGE, France (Directeur de thèse)
Nicolas GRATIOT
Directeur de Recherche IRD, UMR IGE, France (Co-directeur de thèse)
i
ABSTRACT
The Saigon River, a part of Saigon – Dongnai River basin located in Southern Vietnam, is about 250 km long with a catchment area of 4,717 km2. The Dau Tieng reservoir in the upstream of the Saigon River has been constructed for irrigation, flood protection purposes and the control of the intrusion of saline water. When flowing through Ho Chi Minh City (HCMC), Saigon River is connected with canals and then joins Dongnai River to become the Nha Be River flowing through Can Gio Mangrove to the East Sea (also called South China Sea). Draining a low elevation coastal zone (LECZ), bellow 10 meters above sea level, Saigon River is affected by the asymmetric semi-diurnal tides.
The general goal of this thesis is to (i) assess trophic status in the Saigon – Dongnai River, (ii) assess the processes that drive nutrient behavior in the salinity gradient to estimate retention capacity with respect to the nutrients fluxes and (iii) calculate nutrient budgets.
The first step of this thesis consisted in a survey of nutrient concentrations (N, P, Si) at four sampling sites within the Saigon – Dongnai River system, which was carried out bi-monthly from July 2015 to December 2017, allowing to quantify the levels of nutrient concentrations and of indicators of eutrophication. This thesis pointed out an excess of nutrients in HCMC with concentrations of NH4+ and PO43- averaging to 0.7 mgN L-1 and 0.07 mgP L-1, respectively. We
observed that untreated domestic discharges lead to the degradation of Saigon River’s water quality with extreme value of algal biomass (up 150 µChl-a L-1) and hypoxia conditions occurring
episodically (Dissolved Oxygen < 2 mg L-1) during dry season. The eutrophic issue in the city
center has no clear effect downstream because eutrophic water mass from Saigon River is efficiently mixed with Dongnai and sea water masses during the semi-diurnal tidal cycles, leading to efficient metabolism of nutrients within the estuarine part.
Based on field and laboratory surveys, we assessed the eutrophication of the river, and investigated phosphorus (P) adsorption-desorption capacity onto suspended sediment (SS) within the salinity gradient. Field surveys showed a clear impact of the Ho Chi Minh megacity, total P increasing three fold in HCMC center, as compared with upstream values. Downstream, in the tidally mixed estuarine area, the total P lowered to less than 0.5 gP kg-1. Laboratory experiments were carried out to characterize the influence of SS concentrations, salinity and turbulence on sorption/desorption processes. Among these observed variables, SS concentration was shown to
ii be the main driver for adsorption capacity of P onto SS in salinity gradient. This underlines the role of cohesive sediment dynamics, as an important driver of nutrient dynamics in this estuarine river system.
In this thesis, we analyzed the nutrients, suspended sediments and water discharges database from the Vietnamese Center of Monitoring of the Department of Natural Resources and Environment (period 2012 to 2016). Nine sites along the Saigon River and one site in the Dongnai River were used to identify the reference water status upstream of HCMC and the impact of the megacity in situ and downstream. The calculated fluxes allow drawing a first sediment and nutrients budgets at the scale of the Saigon – Dongnai Rivers and discussing the contribution of each sub basins to the total fluxes to the estuarine and coastal zones.
Keywords. Tropical river, Saigon – Dongnai River, eutrophication, nutrient budget, transformation, nitrogen, phosphorus, silica, suspended sediments.
iii
RÉSUME
La rivière Saigon, qui constitue un sous bassin du fleuve Nha Be, est située dans le sud du Vietnam. Cette rivière a une longueur d'environ 250 km et le bassin versant total à une surface de 4717 km2. Le réservoir de Dau Tieng, situé en amont de la rivière Saigon, a été construit pour mieux gérer l’irrigation, lutter contre les inondations et contrôler l’intrusion d’eau salée. En traversant Ho Chi Minh Ville (HCMV), la rivière Saigon est connectée à plusieurs canaux puis rejoint la rivière Dongnai pour devenir le fleuve Nha Be qui traverse la zone de mangrove de Can Gio avant de se jetter dans la mer de l'Est. La rivière Saigon et son bassin versant sont situés dans la plaine côtière et sont soumis au balancement quotidien des marées.
L'objectif général de cette thèse est (i) d’évaluer l'état trophique de la rivière Saigon - Dongnai, (ii) d’étudier les processus à l’origine de la dynamique des nutriments, en particulier le rôle des sédiments en suspension, du mélange turbulent et du gradient de salinité, afin d'estimer la capacité de rétention par rapport aux flux d'éléments nutritifs; (ii) d’utiliser ces mesures de terrain et de laboratoire pour dresser des bilans et discuter les contributions de chaque source.
La première étape de cette thèse a consisté en une étude des concentrations en nutriments (N, P, Si) sur quatre sites d’échantillonnage dans le système de la rivière Saigon – Dongnai. Les mesures ont été réalisées deux fois par mois de juillet 2015 à décembre 2017 pour évaluer les niveaux de concentration en éléments nutritifs et l’état d’eutrophisation. Cette thèse a mis en évidence un excès de nutriments dans HCMV avec des concentrations de NH4+ et de PO43- atteignant en
moyenne 0.7 mgN L-1 et 0.07 mgP L-1, respectivement. Nous avons observé que des rejets
domestiques non traités entraînaient une dégradation de la qualité de l’eau de la rivière Saigon, avec une valeur extrême de biomasse algale (150 µChl-a L-1) et des périodes d’hypoxie (Oxygène
dissous < 2 mg L-1), principalement en saison sèche. L’eutrophisation de la rivière dans la zone urbaine dense n'a pas d'effet clair en aval, car la masse d'eau eutrophe de la rivière Saigon est efficacement mélangée avec les masses d'eau de mer et de la rivière Dongnai pendant chaque cycle de marée. Ce qui met en évidence le rôle tampon (capacité de métabolisation) de l’estuaire entre les apports amont et la mer.
Sur la base d'enquêtes de terrain et d’expérience en laboratoire, nous avons évalué les causes de l'eutrophisation de la rivière et étudié la capacité d'adsorption-désorption du phosphore sur les sédiments en suspension dans le gradient de salinité. Les enquêtes sur le terrain ont montré un
iv impact clair de la mégapole, le P total augmentant de trois fois dans le centre de HCMV, par rapport aux valeurs en amont. En aval, dans la zone estuarienne mélangée par des marées, le P total descend à moins de 0.5 gP kg-1. Les expériences en laboratoire ont montré le rôle clé de la concentration en sédiments cohésifs en suspension sur la capacité d’adsorption de P sur les particules dans le gradient de salinité.
Dans cette thèse, nous avons également analysé une base de données des nutriments, des sédiments en suspension et des débits de 2012 à 2016 (données du service de surveillance de la qualité de l’eau vietnamien de la province d’HCMV). Neuf sites le long de la rivière Saigon et un site dans la rivière Dongnai ont permis de déterminer l’état de référence à l’amont et à l’aval d’HCMV. Les flux calculés permettent de dresser un premier bilan sédimentaire et nutritif à l’échelle des fleuves Saigon – Dongnai, de discuter de la contribution de chaque sous bassin aux flux totaux et de dresser des hypothèses sur l’état environnemental actuel et futur des zones estuariennes et côtières. Mots clés. Rivière tropicale, rivière Saigon - Dongnai, eutrophisation, bilan de nutriment, transformation, azote, phosphore, silice, sédiments en suspension.
v
ACKNOWLEDGMENTS
First of all, I would like to express my sincere and deepest gratitude to my supervisors: Dr. Nicolas Gratiot and Dr. Julien Némery for giving me the opportunity to work with them and for supervising me whole-heartedly throughout my thesis.
I would like to express my appreciation to all individuals participating in the Saigon River project, financed by the CMIRA “Saigon River: la ville et fleuve” Region Auvergne Rhone Alpes project and by the EC2CO Bioheffect Structurante Initiative as well as other individuals and organizations who shared with me valuable information and data for realize this thesis.
I wish to express my thanks to the jury members: Prof. Sarah Dorner, Prof. Florantina Moatar, Prof. Josette Garnier, Dr. Jean Martins and Associated Prof. Nguyen Phuoc Dan for agreeing to judge this work, for constructive criticisms and open discussions during the presentation.
I am grateful to staff member of Institut des Géosciences l’Environment – UMR 5001, who have assisted me warmly since I have started my thesis.
I also highly appreciated Institut Polytechnique de Grenoble, who supported my scholarship and the help of Ho Chi Minh City University of Technology and CARE-RESCIF laboratory to complete my thesis both in Grenoble, France and in Ho Chi Minh City, Vietnam.
Many thanks are sent to all Vietnamese and French friends for their mental and physical helps during the period of this work achievement.
Finally, my heartfelt thanks to my parents, my sisters and my husband for their love and inspiration, their encouragement and motivation to accomplish this work.
vi TABLE OF CONTENT ABSTRACT ... i RÉSUME ... iii ACKNOWLEDGMENTS ... v TABLE OF CONTENT ... vi
LIST OF FIGURES ... xiii
LIST OF TABLES ... xviii
ABBREVIATION... xx
INTRODUCTION ... 1
1. Background ... 1
2. Scientific objectives ... 3
3. Content of the manuscript... 4
CHAPTER 1. LITERATURE REVIEW ... 6
1. Water quality and the impacts of megacities on aquatic ecosystems ... 6
1.1. Water quality in South East Asian Countries and in Vietnam ... 6
1.2. The megacities and their impacts on the environment in Vietnam, with a focus on HCMC ... 9
1.2.1. Characteristics of megacities ... 9
1.2.2. The effects of megacities on aquatic ecosystems ... 10
2. River systems in tropical area ... 11
3. Nutrients in tropical estuaries ... 12
3.1. Nitrogen ... 12
vii 3.1.2. Nitrogen sources ... 14 3.1.3. Nitrification-denitrification processes ... 15 3.2. Phosphorus ... 16 3.2.1. Phosphorus cycle ... 16 3.2.2. Phosphorus sources ... 17
3.2.3. The factors influencing the adsorption-desorption of phosphorus onto sediments 18 3.3. Silica ... 18 3.3.1. Silica cycle ... 18 3.3.2. Silica sources ... 19 3.4. Nutrients fluxes ... 20 4. Carbon ... 20 4.1. Carbon cycle ... 21 4.2. Anthropogenic influences ... 22
5. Eutrophication: causes, consequences and assessment ... 23
5.1. Causes of eutrophication ... 23
5.2. Physical factors supporting the development of eutrophication ... 24
5.3. Consequences and effects of eutrophication ... 25
5.4. Assessment of eutrophication... 25
6. Sediments in estuary ... 26
CHAPTER 2. MATERIALS AND METHODOLOGY... 29
1. Field study ... 30
1.1. The Saigon – Dongnai Rivers hydrosystem ... 30
1.2. The Ho Chi Minh City ... 32
2. Methodology ... 36
viii
2.1.1. Bi-monthly monitoring ... 36
2.1.2. Diurnal sampling surveys ... 39
2.1.3. Longitudinal and salinity profile surveys ... 39
2.1.4. Atmospheric deposition ... 42
2.2. Water quality and hydrological database of DONRE ... 42
3. Measurement and analytical methods ... 45
3.1. In-situ measurements of physico-chemical parameters ... 45
3.2. Filtration and preservation of samples in laboratory ... 45
3.3. Sediment preparation... 45
3.4. Analytical methods ... 46
3.4.1. Total suspended solid (TSS) ... 46
3.4.2. Chlorophyll a and phaeopigments ... 46
3.4.3. Dissolved nutrients... 46
3.4.3.1. Nitrogen ... 47
3.4.3.2. Total phosphorus (TP) and Orthophosphates (PO43-) ... 47
3.4.3.3. Silica ... 48
3.4.4. Organic matter ... 48
3.4.5. Particulate nutrients in deposit and suspended sediment ... 49
3.4.6. Phytoplankton identification and counting ... 50
3.4.7. Physical characteristic of sediment ... 50
4. Assessment of phosphorus mobility from laboratory experiments ... 52
4.1. Experiment design ... 52
4.2. Sorption isotherm ... 53
CHAPTER 3. NUTRIENT DYNAMICS AND EUTROPHICATION ASSESSMENT IN THE TROPICAL RIVER SYSTEM OF SAIGON – DONGNAI (SOUTHERN VIETNAM) ... 55
ix
1. Introduction ... 58
2. Materials and methods ... 60
2.1. Study area ... 60
2.2. Monitoring and sampling strategy... 62
2.3. Laboratory analyses... 63
2.4. Hydrological database ... 64
3. Results ... 64
3.1. Seasonal hydrological variability ... 64
3.2. Interannual variations of water quality in the Saigon River... 65
3.2.1. Physico-chemical parameters... 65
3.2.2. Dissolved and total nutrients ... 67
3.2.3. Organic carbon, chlorophyll-a, and phaeopigments ... 70
3.3. Longitudinal profile in the Saigon River... 72
3.4. Nutrient ratios ... 74
4. Discussion ... 75
4.1. Level of nutrient contamination ... 75
4.2. Eutrophication status and limiting factors ... 78
4.3. Impact of HCMC on the water quality of the Saigon River ... 80
5. Conclusions ... 83
CHAPTER 4. PHOSPHORUS ADSORPTION-DESORPTION PROCESSES IN THE TROPICAL SAIGON RIVER ESTUARY (SOUTHERN VIETNAM) IMPACTED BY A MEGACITY ... 93
1. Introduction ... 96
2. Material and methods ... 98
x
2.2. Sampling campaigns ... 102
2.3. Measurement and analytical methods ... 102
2.3.1. In-situ sampling and measurements ... 102
2.3.2. Sediment preparation ... 103
2.3.3. TSS and phosphorus measurement ... 103
2.4. Experimental designs ... 104
2.5. Sorption isotherm ... 107
3. Results ... 107
3.1. Physico-chemical parameters distribution along the Saigon River ... 107
3.2. Phosphorus levels along the Saigon River ... 109
3.3. Phosphorus distribution in the salinity gradient ... 110
3.4. Phosphorus adsorption capacity onto sediment from laboratory experiments ... 111
3.5. Physical characteristics of sediments ... 115
4. Discussion ... 116
4.1. The effect of physical characteristic of sediment on the P adsorption capacity ... 116
4.2. Impact of HCMC on the P concentrations ... 117
4.3. Implication for the understanding of P dynamics within estuaries ... 120
5. Conclusions ... 122
CHAPTER 5. NUTRIENTS BUDGET IN THE SAIGON – DONGNAI RIVERS BASIN: PAST TO FUTURE INPUTS FROM THE DEVELOPING MEGACITY OF HO CHI MINH (VIETNAM) ... 131
1. Introduction ... 134
2. Material and methods ... 135
2.1. Description of the Saigon – Dongnai River basin ... 135
xi
2.3 Additional monitoring program ... 138
2.4. Suspended sediment and nutrient budgets calculation ... 138
2.4.1. Nutrients export by rivers ... 139
2.4.2. Domestic inputs ... 140
2.4.2.1. Gross nutrients inputs from urban areas ... 140
2.4.2.2. Net nutrients inputs from WWTPs ... 141
2.4.2.3. Net flux from urban canals to the rivers ... 141
2.4.3. Industrial inputs ... 143
2.4.4. Atmospheric depositions ... 145
2.4.5. Assumption on TSS and nutrients budgets ... 146
2.4.6. Expected nutrients inputs in 2025, 2040 and 2050 ... 147
3. Results ... 148
3.1. Seasonal variation of TSS and nutrients concentrations ... 148
3.2. Seasonal and inter-annual variations of river fluxes and the effect of climatic conditions on the river fluxes ... 150
3.2.1. Seasonal variation of river fluxes ... 150
3.2.2. Inter-annual variations of river fluxes ... 151
3.3. Mean TSS and nutrient budgets in the Saigon River ... 153
3.4 Comparison between past and future nutrients inputs ... 157
4. Discussions ... 158
4.1. Budgets in contemporary Ho Chi Minh City 2012-2016 ... 158
4.2. Nutrients fluxes ratios as an indicator of potential eutrophication... 161
4.3. Future nutrients emissions from Ho Chi Minh City by 2025-2050 and recommendation for better management ... 163
xii GENERAL CONCLUSIONS AND PERSPECTIVES ... 173 REFERENCES ... 176 APPENDIX ... xx
xiii
LIST OF FIGURES
Figure 1-1. Population distribution in the biggest cities in the world (source:
https://news.cnrs.fr/articles/ever-larger-cities). ... 6
Figure 1-2. Map of the assembled countries considered (ASEAN countries: Indonesia, Malaysia, Philippines, Thailand, Vietnam, Lao, Cambodia, Singapore, Brunei and Myanmar; source: worldatlas.com). ... 7
Figure 1-3. (a) Urbanization rate of ASEAN in 2016 and (b) Population growth in rural and urban area of Vietnam from 1950 to 2017 (source: FAOSTAT) ... 10
Figure 1-4. Tropical regions of the world superimposed on drainage basins (from Peel et al., 2007, reported in Syvitski et al., 2014). ... 11
Figure 1-5. The distribution of rainfall (mm) in ASEAN region (source: climatemps.com). ... 12
Figure 1-6. Nitrogen cycle (Gruber, 2008). ... 14
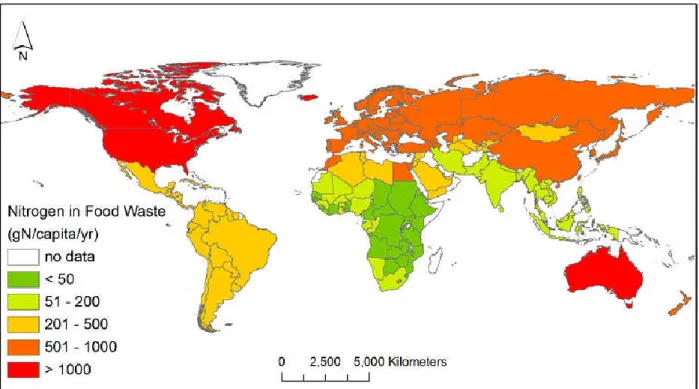
Figure 1-7. Nitrogen loose by food waste in consumption (Grizzetti et al., 2013). ... 15
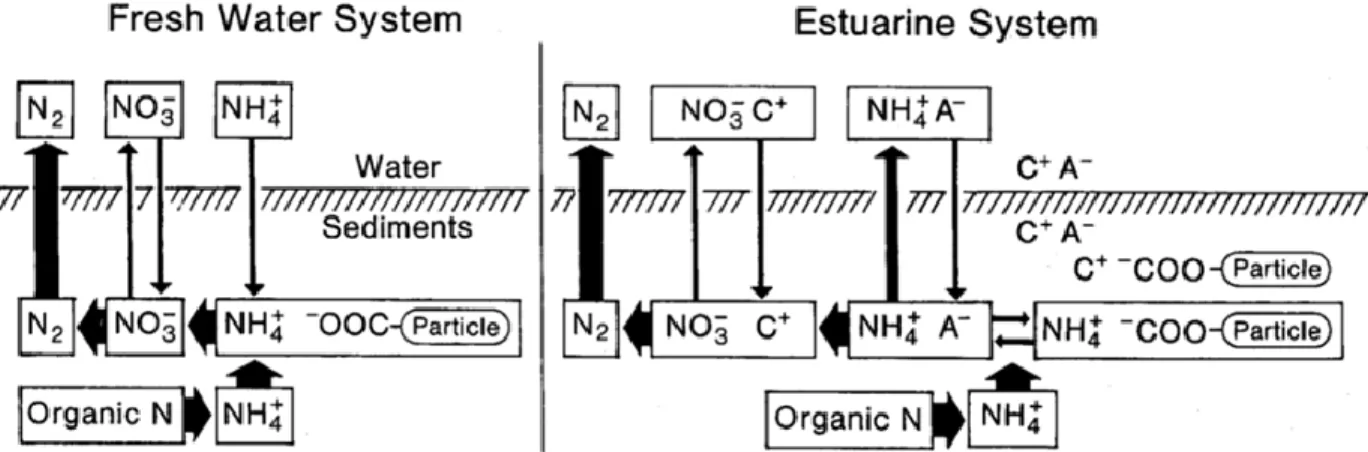
Figure 1-8. Model of differential ammonium release between freshwater and brackish estuarine water (and coastal marine) sediments. Ion pairing is indicated by the coupling of anions (A-) and cation (C+) in the diagram (see in Gardner et al., 1991). ... 16
Figure 1-9. Phosphorus cycle. ... 17
Figure 1-10. Silica cycle (Struyf et al., 2009). ... 19
Figure 1-11. Carbon cycle (Bauer et al., 2013) ... 21
Figure 1-12. The process of eutrophication (Volterra et al., 2002). ... 24
Figure 1-13. Estuarine processes influencing nutrients dynamics (Statham, 2012). ... 27
Figure 2-1. Geography and hydrography of Ho Chi Minh City. ... 31
Figure 2-2. Precipitation and temperature in Ho Chi Minh City (source: HCMC Statistical Year Book 2016)... 32
Figure 2-3. Land use in Ho Chi Minh City (source: ATLAS 2010). ... 34
Figure 2-4. Industrial zone distribution in Ho Chi Minh City (source: le PADDI – Centre de prospective et d’études urbaines). ... 35
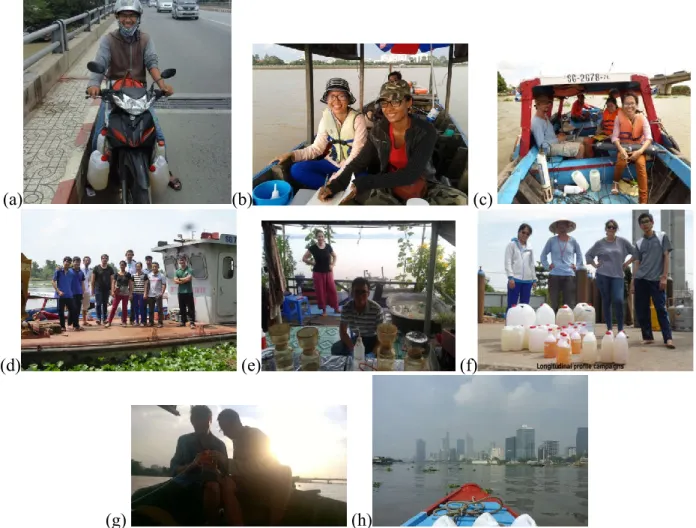
xiv Figure 2-5. Sampling sites of bi-monthly monitoring, longitudinal and salinity profile campaigns. ... 37 Figure 2-6. Field campaigns photo: bi-monthly campaigns in the middle of bridge and boat (a, b), diurnal campaign (c, d e), longitudinal campaign ((f, g, h) ... 38 Figure 2-7. Sampling sites of atmospheric deposition monitoring. ... 42 Figure 2-8. Sampling sites in urban canals network and the Saigon – Dongnai River basin (source: CEM-DONRE). ... 43 Figure 2-9. Sample preparation in CARE Laboratory ... 46 Figure 2-10. (a) The portable granulometer of LISST XR system and (b) system for characterization of aggregates and flocs (SCAF). ... 51 Figure 2-11. Sampling sites in Saigon – Dongnai River basin and urban canal network (source: CEM-DONRE). ... 51 Figure 2-12. Fitting curve to obtain adsorption characteristics. ... 53 Figure 3-1. (a) Map of Saigon – Dongnai Rivers and location of sampling sites, (b) distribution of monthly rainfall and temperature from 2011 to 2016, (c) population density distribution in Ho Chi Minh City (source: HCMC Statistical Year Book 2016). ... 61 Figure 3-2. Water level during (a) the dry season (April 2017) and (b) the wet season (October 2017) at HCMC (source: tide4fishing.com; black points indicate bi-monthly monitoring and black lines correspond to the time period during which longitudinal profiles were carried out). ... 62 Figure 3-3. Distribution of mean monthly discharge (period 2012-2016) in Saigon River and Dongnai River (data source: DONRE; see Figure 3-1a for the location). ... 65 Figure 3-4. Seasonal variations of (a) pH, (b) salinity, (c) DO and (d) TSS at the four stations during the period July 2015 to December 2017. Gray color presents the dry season, which lasts from December to April and white color is the wet season from May to November. ... 66 Figure 3-5. Seasonal variations of (a) Total N, (b) NO3-, (c) NH4+, (d) Total P, (e) PO43- and (f)
DSi measured at the four sites from July 2015 to December 2017. ... 68 Figure 3-6. Seasonal variations of a) DOC, b) POC, c) Chl-a and d) phaeopigments measured at the four sites from July 2015 to December 2017. ... 71
xv Figure 3-7. Longitudinal profile in the Saigon River during dry season (19th April 2017) and wet season (20th October 2017); from top to bottom and from left to right: pH, DO, salinity, Total N, NO3-, NH4+, Total P, PO43-, DSi, TSS, DOC, POC, Chl-a and Phaeopigments. Last panel represents
the longitudinal profile divided into three sections... 73 Figure 3-8. Molar ratios of Si:N and Si:P (log scale) at four sampling sites in Saigon – Dongnai River system from July 2015 to December 2017... 74 Figure 3-9. Seasonal variations of the trophic status of the Saigon River with the population density. (a) Snapshot of the eutrophic level during the dry season (19th of April 2017); spatial distribution of population density (see also Figure 3-1c). The patch of Chl-a presented in Figure 3-9a is corrected from the upstream-downstream oscillation of water masses with tides. Depending on tidal level, water masses can oscillate with an amplitude of 6 km around their mean locations during spring tides and (b) Intercomparison of snapshot trophic situations for dry (black solid line) and wet (grey dashed line) seasons. ... 81 Figure 4-1. (a) Saigon – Dongnai basin catchment and sampling sites along a longitudinal profile, (b) The population density distribution on the zoomed urban central districts (source: HCMC Statistical Year Book 2016). Grey arrow indicates the amplitude of upstream salt intrusion (see Table 1 for details of sampling sites). ... 99 Figure 4-2. (a and b) Experimental designs, (c) The portable granulometer of LISST XR system and (d) System for characterization of aggregates and flocs (SCAF). ... 106 Figure 4-3. Temperature, dissolved oxygen (DO), salinity, Chlorophyll a (Chl-a) and total suspended sediment (TSS) variations from upstream to downstream of HCMC during the dry season (April 2017) and the wet season (October 2017). ... 108 Figure 4-4. (a and b) Particulate phosphorus in deposited sediment (DS) and suspended sediment (SS) and (c and d) Total phosphorus and PO43- concentrations in the water column during the dry
season and the wet season. The vertical line indicates the confluence with the Dongnai River. 110 Figure 4-5. (a) Distribution of Total particulate phosphorus, (b) Distribution of particulate phosphorus, (c) PIP/POP ratios and (d) PO43- concentration within the salinity gradient during the
xvi Figure 4-6. The percentage of PO43- adsorbed onto suspended sediments (SS) at different
hydrodynamic conditions (see Table 1 for C1 to C8 conditions). Sediment was sampled at site SG13 during the dry season (25th April 2017). ... 112
Figure 4-7. (a) and (d) Kinetics of sorption of phosphorus and (b), (c), (e) and (f) the sorption parameters (Pac, Kps) for all hydrodynamic conditions tested. Correlation coefficient (R2) for each
parameter determination is shown in Table 3. ... 113 Figure 4-8. Variation of the volumic concentration of particles (primary < 8 µm, flocculi [8-50 µm] and flocs [50-200 µm]) with TSS, for the experiments C1 to C8 (see Table 2). ... 115 Figure 4-9. Effect of suspended sediment concentration and salinity on flocs and flocculation index at different experimental conditions. ... 116 Figure 5-1. The Saigon – Dongnai rivers basin and population distribution in HCMC and location of the sampling sites... 136 Figure 5-2. Location of industrial sites and proportion of target sector industries (source: Publication Du Catalogue Des Livrets Du PADDI: www.paddi.vn)... 144 Figure 5-3. Mean TSS, NH4+ and PO43- concentrations over the period 2012-2016: (a) along the
Saigon River (SG) and the Dongnai River (DN) during the wet and dry seasons and (b) in urban canals of HCMC. In which, BC, BS, PC, RT, BP, SG, BD, PM, NB and HA are 10 sampling sites within the Saigon – Dongnai River basin (Ben Cui, Ben Suc, Phu Cuong, Rach Tra, Saigon, Bach Dang, Phu My, Nha Be and Hoa An respectively). In Figure 5-3a, bold legends represent sampling sites which are chosen for budget calculation. ... 149 Figure 5-4. Suspended sediment and nutrient fluxes from 2012 to 2016 in the Saigon (Bach Dang station) and Dongnai (Hoa An station) Rivers system. ... 151 Figure 5-5. Interannual discharges and fluxes of TSS, NH4+ and PO43- in the Saigon – Dongnai
Rivers system from 2012 to 2016. ... 152 Figure 5-6. Mean Annual water discharge (±SD) from 2012 to 2016 within the Saigon and Dongnai River system... 154 Figure 5-7. Annual suspended sediment (±SD) budget from 2012 to 2016 within the Saigon and Dongnai River system. ... 154
xvii Figure 5-8. Annual nitrogen (±SD) budget from 2012 to 2016 within the Saigon and Dongnai River system. ... 155 Figure 5-9. Annual phosphorus (±SD) budget from 2012 to 2016 within the Saigon and Dongnai River system... 156 Figure 5-10. Annual dissolved silica (±SD) budget from 2012 to 2016 within the Saigon and Dongnai River system. ... 156
xviii
LIST OF TABLES
Table 1-1. Water quality in ASEAN (source: Water Environment Partnership in Asia - wepa-db.net, Alexandra et al., 2012; Stephen and Liz, 2009). ... 8 Table 2-1. Sampling site locations ... 41 Table 2-2. Phosphorus sorption experimental conditions ... 52 Table 3-1. Classification of trophic levels of rivers and assessment of levels for the four sampling sites in the Saigon – Dongnai Rivers. ... 79 Table 4-1. Sampling sites along the longitudinal profile on the Saigon River (pK = 0 corresponds to the confluence between Saigon River and Dongnai River) ... 101 Table 4-2. Phosphorus adsorption-desorption experimental conditions ... 105 Table 4-3. Maximal adsorption capacity of phosphorus onto suspended sediment (Pac),
half-saturation concentration of PO43- (Kps), correlation coefficient (R2) of the fitting and the percentage
of PO43- absorbed onto SS at the different experiment conditions (in 1st column: C1, number of
samples for each treatment). ... 114 Table 4-4. Mean (±SD) of total particulate phosphorus (TPP), particulate inorganic phosphorus (PIP) and particulate organic phosphorus (POP) content in suspended sediments (SS) during both dry season (April 2017) and wet season (October 2017). ... 119 Table 4-5. Phosphorus availability within salinity gradient. ... 121 Table 5-1. Mean annual discharges and concentrations (±SD) at the sampling sites within the Saigon and Dongnai River (period 2012-2016). ... 139 Table 5-2. Mean annual discharges and concentrations (±SD) from 2012 to 2016 at the outlet of the three main urban canals and in WWTPs ... 142 Table 5-3. Mean daily discharges and concentrations of six sectors in industrial zones (data synthesis from questionnaires) ... 143 Table 5-4. Levels of TSS and nutrient concentrations released by domestic and industrial wastewaters based on National Technical Regulation on Domestic and Industrial Wastewater 145 Table 5-5. Mean annual concentrations and specific flux of TSS and nutrients from atmospheric deposition in 2017 ... 146
xix Table 5-6. Treatment capacity and nutrients removal efficiency of WWTPs from past to future ... 148 Table 5-7. Gross nutrients inputs and net nutrients inputs from ... 157 Table 5-8. Specific fluxes of TSS and nutrients in the Saigon – Dongnai Rivers system and some rivers in the world. ... 159 Table 5-9. Specific nutrient fluxes delivered by Saigon and Dongnai River basin and the indicator of coastal eutrophication potential (ICEP) ... 163
xx
ABBREVIATION
ASEAN Association of Southeast Asian Nations
HCMC Ho Chi Minh City
DIC Dissolved inorganic carbon
DIN Dissolved inorganic nitrogen
DN Dongnai
DOC Dissolved organic carbon
ICEP Indicator of coastal eutrophication potential ITCZ Inter Tropical Convergent Zone
N Nitrogen NBR Nha Be River NO2− Nitrite NO3- Nitrate NH4+ Ammonium P Phosphorus PO43- Ortho-phosphate
PIC Particulate inorganic carbon PIN Particulate inorganic nitrogen PIP Particulate inorganic phosphorus PIP Particulate inorganic phosphorus
xxi POC Particulate organic carbon
POP Particulate organic phosphorus
SG Saigon
Si Silica
TOC Total organic carbon
Total N Total nitrogen Total P Total phosphorus
1
INTRODUCTION 1. Background
In recent decades, many developing countries have been facing a significant challenges in link with the ever-growing appetite for fresh water and in the context of global warming. Industrialization, urbanization, agricultural intensification, and the construction of artificial reservoirs have modified, and frequently threatened the water supply, especially from surface waters which are sensitive to eutrophication. Whilst Asian countries are experiencing faster growth over the last decades, rapid industrialization and urbanization have led to quantitative shortage and qualitative deterioration of water resources. Water is a vital and vulnerable natural resource, on which the future development of almost all countries will depend. It is therefore essential to identify the major factors of the change in water quality, and to adapt in consequence, the management of water resources. Such modifications could successfully combine water management practices and processes (Vo, 2007).
Vietnam is an agricultural country with a high density of rivers network; of which 2360 rivers have a length of more than 10 km (Huynh et al., 2014). The total annual water discharge is 835 billion m3, of which 313 billion m3 are available for human use (Tran Ngoc et al., 2016). Water is plentiful in the wet season (from June to November) but serious shortages occur during the dry season (from December to May). Despite the abundant water resource, the dependency on upstream countries also makes water quality management more difficult in Vietnam (for instance on the large watersheds of Mekong River and Red River). There is an increasing contamination of Vietnam’s surface, ground, and coastal waters. Although upstream river water quality remains good, the downstream part of major rivers exhibits poor water quality and most of the lakes and canals in municipal areas are fast becoming sewage sinks. Groundwater shows local pollution and saline intrusion. All these facts are existing in the Saigon River, in southern Vietnam.
Saigon River is the second largest river supplying water to Ho Chi Minh City (HCMC) after Dongnai River. Because of the urban sprawl in HCMC and neighboring provinces nearby Saigon River basin, water quality of this river is now at risk. In spite of the vital function, Saigon River water quality has received poor attention. Most of the national water quality monitoring programs
2 have been conducted only in the downstream basin, especially in HCMC (Cornelis et al., 2015; Downes and Rujner, 2010; Luong et al., 2013).
Nowadays, the effects of industrialization and urbanization on water quality are the main issues not only in Vietnam but also worldwide. Human activities have significantly changed Nitrogen (N), Phosphorus (P), Carbon (C) and Silica (Si) cycles; in which, three first elements control many functions of aquatic ecosystems. Many factors are affecting the nutrient balance into river-water column, such as hydrology, nutrient inputs from soil system and biogeochemical transformation processes of nutrients between sediment and the water column, from upstream to downstream. Additionally, there are a difference in N, P and Si inputs from diffuse and point sources into the drainage network. Their concentrations and fluxes can fluctuate significantly from upstream to downstream according to the variations of the hydrological conditions, land use, industrial and agricultural activities. These changes can alter ecosystem structures and functions (Billen et al., 2007).
One of the key, which is particularly useful for assessing coastal eutrophication status, is the concentration of nutrients which are carried to the coastal zone by rivers. Billen and Garnier (1997) showed that coastal eutrophication is the consequence of unbalanced riverine nutrients inputs, with an excess of nitrogen and phosphorus with respect to silica, compared to the requirements for diatoms growth. Five decades ago, Redfield et al. (1963) proposed the Redfield stoichiometric ratio of carbon, nitrogen and phosphorus (C:N:P) as a tool to evaluate eutrophic status of water body; stated to be C:Si:N:P = 106:15:16:1 (Brzezinski, 1985). It is very likely that non-siliceous algae would developed by the imbalance between these nutrients inputs. This type of algae has a serious impact on coastal eutrophication. Furthermore, sediments from watershed to estuary have played an essential role in the biogeochemical process of elements such as nitrogen, phosphorus, carbon, and silica. Some decades ago, Martin and Meybeck (1979) predicted that over 90% of the global riverine transfer of some major biogenic elements such as phosphorus was transported with suspended matter. And about 45% of total organic carbon discharged from rivers into the ocean was in particulate form annually.
Many researches have been carried out on the water quality of rivers around the world. However, few scientists focused their studies on emerging countries, especially in the very dynamic region of South East of Asia. This is actually the case for the water body of Saigon River in HCMC,
3 where the respective impacts of natural and anthropogenic pressures remain poorly characterized. With aforementioned gap, this study has been conducted to evaluate the concentration of nutrients and assess the status and driving factors of water quality of Saigon River and its main tributary, Dongnai River; and to contribute to a better management of the waterbodies for an efficient and sustainable development?
2. Scientific objectives
In order to understand the pollution levels of the hydrosystem, its dynamics and the effects on the ecosystem, a group of French and Vietnamese scientists has been working together during the last years, within the framework of a cooperation project CMIRA Saigon River Région Rhône Alpes (2016-2018) and EC2CO (2016-2017). As part of the RESCIF international network (www.rescif.net), the close collaboration between the Institut des Géosciences de l’Environnement (IGE, Grenoble-INP, IRD, Université Grenoble Alpes, CNRS, Grenoble France) and Ho Chi Minh University of Technology (HCMUT, Vietnam), led to the creation of the “Centre Asiatique de Recherche sur l’Eau (CARE)”, which focuses on the study of water quality and eutrophication risk assessment.
The overall objective of this thesis is to outline the water quality status of Saigon River and to provide the scientific understanding of natural and anthropogenic factors affecting Saigon River water quality. The specific objectives are:
1) Quantifying the different forms (dissolved or particulate inorganic and organic nutrients) and ratio of C:N:P:Si in the Saigon – Dongnai River basin to assess the trophic status and the risk of eutrophication.
2) Studying exchangeability of phosphorus between sediments and water body; and assessing phosphorus behaviors in suspended sediments within the salinity gradient in order to evaluate the estuarine retention capacity, with respect to the phosphorus fluxes delivered from the upstream watershed.
3) Preparing a comprehensive database of sources of pollution (wastewater from domestic, and industrial activities) for establishing nutrient and sediment budgets in the Saigon River.
4
3. Content of the manuscript
This manuscript comprises 5 chapters; three of them are under the form of scientific papers already published, submitted or in preparation.
The chapter 1 gathers the presentation of the study area providing the necessary background information about the Ho Chi Minh City, the Saigon – Dongnai River system and all the biogeochemical characteristics related to eutrophication risk.
Chapter 2 presents the study sites, the material and methods, the monitoring strategies, the experimental set-up and data treatment that were adopted for the study.
Chapter 3 is under the form of a scientific paper published in Science of the Total Environment. In this chapter, the results of water quality are presented based on bi-monthly monitoring program during period of two year and a half (from July 2015 to December 2017). The construction of a database on nutrient (N, P and Si), organic carbon and phytoplankton dynamics of the Saigon – Dongnai River system required for assessing eutrophic status is also introduced and discussed. Chapter 4 reports the results of Phosphorus contamination observations in the Saigon River and Phosphorus transformation under different conditions of TSS concentrations, turbulence and salinity. These results, based on field measurement and laboratory experiments are used to discuss the effect of TSS, turbulence and salinity on the adsorption/desorption of Phosphorus onto suspended sediments, and the transformation of phosphorus within the estuary. This chapter is currently submitted for a publication in Estuarine, Coastal and Shelf Science.
Chapter 5 presents the budgets of water discharge, suspended sediment, and phosphate and P fluxes in six sampling sites of the Saigon – Dongnai River system, the input fluxes of atmospheric deposition, urban zone and industrial zone. It is based on the analysis of the database provided by by the Center of Environmental Monitoring – DONRE (department of Natural Resources and Environment), as well as ourown measurements database within the Saigon – Dongnai Rivers system. This chapter is designed to be possibly submitted the journal River Research and Applications.
The conclusions and perspectives section summarizes the main results obtained in this study and discusses some perspectives that could be addressed in the future for a better understanding of the
5 fate of nutrients in tropical estuaries, and for an improvement of local water management to restore water quality.
6
CHAPTER 1. LITERATURE REVIEW 1. Water quality and the impacts of megacities on aquatic ecosystems
1.1. Water quality in South East Asian Countries and in Vietnam
It took hundreds of thousands of years for the world population to grow to 1 billion – then in just another 200 years or so, it grew sevenfold. In 2011, the global population reached 7 billion, and today, it stands at about 7.6 billion (data from www.unfpa.org). 2007 was the first year in which more people lived in urban areas than in rural areas, and by 2050 about 66 % of the world population will be living in cities. This urbanization unfold in Africa and Asia (Figure 1-1), bringing huge social, economic and environmental transformations. Among all consequences of urbanization (health care, education, housing, sanitation, food, energy and water), the present work focuses on the water-related issues, and more especially on the deterioration of water quality and its impact on aquatic ecosystems.
Figure 1-1. Population distribution in the biggest cities in the world (source: https://news.cnrs.fr/articles/ever-larger-cities).
The study is conducted in a megacity of South East Asia (Ho Chi Minh City, Vietnam), of the ASEAN region (Association of Southeast Asian Nations, Figure 1-2). This region comprises ten
7 Southeast Asian countries that share common water related challenges and promote cooperation and facilitates economic, environmental, educational actions to fight against water pollution.
Figure 1-2. Map of the assembled countries considered (ASEAN countries: Indonesia, Malaysia, Philippines, Thailand, Vietnam, Lao, Cambodia, Singapore, Brunei and Myanmar; source:
worldatlas.com).
Among the most serious problems of water quality in ASEAN figure: lack of wastewater treatment system and particles released through soil leaching; domestic wastes discharged directly to river body; water pollution from small-scale industries and agricultural activities or even groundwater contaminated with coliforms (sources: Water Environment Partnership in Asia – www.wepa-db.net, Alexandra et al., 2012; Stephen and Liz, 2009). The megacity of Ho Chi Minh city (Vietnam) gathers all these water-related issues and thus provides an interesting study case to evaluate the impact of megacities on the water quality and aquatic ecosystems, to anticipate scenario of evolution in the megacities of the ASEAN and to propose ways of mitigation. Some emblematic water quality issues in ASEAN are synthesises in Table 1-1.
8
Table 1-1. Water quality in ASEAN (source: Water Environment Partnership in Asia - wepa-db.net, Alexandra et al., 2012; Stephen and Liz, 2009).
Country Water quality problems
Cambodia Garbage and sewage; wastewater treatment; pesticides and chemical fertilizers (discharging highly amount of toxic waste into water column, carrying toxic out shrimp field); particles released during soil leaching and proper dumping places; illegal fishing.
Indonesia 56 % of household disposes their domestic waste directly to river body; sources of water pollution also come from small-scale industries, agriculture, textile, pulp and paper, petrochemical, mining, and oil and gas; level of mercury (Hg) concentration and BOD reach 2.78 µg L-1 and 100 mg L-1, respectively.
Laos Waste and polluted water in urban areas, water pollution from agricultural and industrial activities, degradation of natural water and water catchments from sedimentation, erosion from land.
Malaysia The water pollution from point sources (sewage treatment plants, manufacturing and agro-based industries and animal farms) and non-point sources (agricultural activities and surface water discharges).
Myanmar The low percentage of people covers by safe drinking water and sanitation facilities.
Thailand High loading of pollutants from human activities, pollutants discharged from industrial, agricultural or populated areas.
Philippines 58 % of groundwater was contaminated with coliforms and many cities were experiencing a shortage of water supply during the dry season. Nearly 2.2 million metric tons of organic pollution are produced annually by domestic, agricultural, and industrial sectors. Water pollution was dominated by domestic and industrial sources.
9 Vietnam Poor water quality; lakes and canals becoming sewage sinks; pockets of
contamination and some salinity intrusion in groundwater; rapid urbanization and industrialization and transport development, expansion, and an increase in the number of oil spills contributing to the deterioration of water quality.
1.2. The megacities and their impacts on the environment in Vietnam, with a focus on HCMC 1.2.1. Characteristics of megacities
Csomos (2014) classified megacities based on two parameters: (i) the specific geographic regions (population distribution) and (ii) the economic performance (income per capita). The population growth is due to the positive birth/death ratio, the rural-to-urban and urban-to-suburb migration. Population growth and high population densities are driving the municipal sprawl. In ASEAN, radical spatial, demographic, social and political structural changes in urban areas took place over the last decades, associated with the economic rise of the whole region (Kraas, 2007). Megacities will get bigger in the coming years, as the population continues to grow and people continue to abandon rural areas. Some Southeast Asian cities are already some of the most populated metropolises in the world (Figure 1-1), with millions of inhabitants like Manila (Philippines, 11.9 million inhab.), Jakarta (Indonesia, 30.2 million inhab.), Bangkok (Thailand, 14.5 million inhab.), Kuala Lumpur (Malaysia, 6.6 million inhab.), Singapore (5.8 million inhab.), Yangon (Myanmar, 4.3 million inhab.) and Ho Chi Minh City (Vietnam, 8.4 million inhab.).
In Vietnam, annually, 100 000 hectares (or more) of agricultural land are recovered for construction of industrial parks, services, and transportations (Nguyen et al., 2017; Vo, 2007). In some rural areas, typically as in the Red River Delta and in the Mekong River, the population has migrated to big cities such as Hanoi and Ho Chi Minh City. This rural migration flow leads to a city expansion that witnessed very heavy overload on population, technical and social infrastructures (Decker et al., 2002). After reaching an urban proportion of the population of 10 % during the 1950’s, the speed of urbanization increased, and was around 21.5 % in the 1970’s. After the country was reunified, there was a decline in the urban proportion of the population throughout the country until 1982, when it had fallen to 18.4 %. Since then, the level of urbanization has increased gradually to overpass 35% in 2015 (Figure 1-3).
10 Aside from population size, megacitiesare very high consumers of materials and energy. Power generation and the energy consumption in megacities have enormous impacts on the environment that is unequally considered by policy makers. Developed and wealthy cities, such as Los Angeles, propose mitigation strategies and offer central water treatment plants and distribution facilities. They can support 100% of their population with fresh and clean water (Decker et al., 2002). This is generally not the case in ASEAN megacities.
Figure 1-3. (a) Urbanization rate of ASEAN in 2016 and (b) Population growth in rural and urban area of Vietnam from 1950 to 2017 (source: FAOSTAT)
1.2.2. The effects of megacities on aquatic ecosystems
Urban development patterns are closely linked to an increase in the consumption of freshwater and, therefore, in an increase in the water demand for many activities. Among them, the food consumption and different nutrition patterns in megacities are higher than in rural populations. The urban development leads an increase in the food demand and a decrease in the availability of arable lands (Phdungsilp, 2006; Hawkes et al., 2017; Popkin, 2001).
Urban expansion or municipal sprawl with the construction of urban, tourism and transportation facilities is closely linked to the decrease in arable lands, degradation of biodiversity, air and water quality (Penning de Vries et al., 2003; Zhao et al., 2006). Untreated domestic wastewaters, which are released directly into aquatic ecosystems, remain one of the most common sources of pollution. In the case of Vietnamese megacities, canals and small water bodies are generally becoming a sink for domestic and industrial wastewaters, especially in HCMC and Hanoi. According to the Viet Nam Environment and Sustainable Development Institute, the megacities account for (only ~30
11 %) of the national population, but they generate more than 6 million tons of waste each year (nearly 50 % of the total amount of waste of the country) (Nguyen et al., 2017).
2. River systems in tropical area
Only 19 % of the land surface locate in tropical climate region; in which, 60 % in the South American, 31 % in Africa, 16.3 % in Asia, 8.3 % in Australia and 5.9 % in North America (Figure 1-4) (Peel et al., 2007). The most important control of the tropical climate relates to the position of the Inter Tropical Convergent Zone (ITCZ) (Syvitski et al., 2014). In tropical areas, there is a climate without strong winter since these regions receive a large amount of solar energy. The temperature is neither shift from day to night, nor from summer to winter. The tropical zones are characterized by the intense convective rainfall (Syvitski et al., 2014).
Figure 1-4. Tropical regions of the world superimposed on drainage basins (from Peel et al., 2007, reported in Syvitski et al., 2014).
In tropical regions, such as in Vietnam, the main factor, which specifies the seasons, is rainfall (Figure 1-5). Therefore, the amount and temporal distribution of the precipitations are the important elements for disparity in climatic zones; for instance, wet (> 1800 mm), wet-dry (700-1800 mm), and dry (< 700 mm) (Latrubesse et al., 2005). All rivers in Vietnam flows through wet-dry climatic regions, which is classified as a monsoonal regime. The alternation of ocean tropical and continental atmosphere masses dominates the seasons. As warm, moisture-laden air flows from the Indian Ocean in summer, a wet season develops. In winter, a high pressure system develops over the Asian continent and becomes the source of dry air masses.
The climate in the South of Vietnam, is controlled by “trade wind” monsoon in winter and South West monsoon in summer. The wet season lasts from May to October and the dry season is from
12 December to April. The wet season cumulates 85 – 90 % of the total annual rainfall (Figure 1-5). The climate of the South of Vietnam, confers the typical hydrologic regime characterized by large runoff during wet season and low runoff during dry season.
Figure 1-5. The distribution of rainfall (mm) in ASEAN region (source: climatemps.com).
3. Nutrients in tropical estuaries
Nutrients are key substances for organisms and life development. In our study, we focus on three key nutrients for the development of aquatic life in estuaries, namely nitrogen (N), phosphorus (P) and silica (S).
3.1. Nitrogen
Nitrogen (N) is essential for crop growth. Nitrogen which comes from synthetic fertilizers, has become the main anthropogenic inputs changing the N cycle, in comparison to N discharged from
13 urban wastewater treatment plants or nitrogen oxide emitted through motor vehicle traffic and the thermal electricity generation (Billen et al., 2013).
3.1.1. Nitrogen cycle
There is a numerous variety of nitrogen form in the environment such as organic nitrogen, ammonium (NH4+), nitrite (NO2−), nitrate (NO3−), nitrous oxide (N2O), nitric oxide (NO) or
inorganic nitrogen gas (N2). Many processes, in which microbes can transform nitrogen from one
form to another, both to get energy or to accumulate nitrogen in a form needed for their growth. The diagram below shows how these processes fit together to form the nitrogen cycle (Figure 1-6).
In biogeochemistry, there are three processes of nitrogen transformation.
- First, fixation/assimilation: Nitrogen in the atmosphere is fixed by plants. However, most fixations are carried out by symbiotic bacteria known as diazotrophs. Most biological nitrogen fixation takes place by the nitrogenase enzyme, found in a wide variety of bacteria (Moir, 2011).
- Secondly, ammonification/anaerobic ammonia oxidation: When organisms (plant or animal) dye, bacteria or fungi transform organic nitrogen form back into NH4+, a process
called ammonification or mineralization. This process contributes to a main proportion of nitrogen conversion into aquatic ecosystems.
- At last, nitrification/denitrification: The nitrification process converts NH4+ to NO3−, which
is easy to dissolve in water and is not retained in soils (Vitousek et al., 1997). In addition, the denitrification process is the reduction of NO3− back into the inert N2 gas, completing
the nitrogen cycle. This process is conducted by bacterial species such as Pseudomonas
and Clostridium (Smil, 2000). Oxygen is required for nitrification but denitrification is
anaerobic strict process.
In aquatic ecosystems, N enters to water column by many pathways, e.g. precipitation, soil runoff and leaching, domestic and industrial wastewater discharge. N cannot be used directly by phytoplankton under the form of N2 gas, except for cyanobacteria (Charles and Wheeler, 2012)
(Figure 1-6). Other phytoplankton species use N as NH4+ or NO3- in water environment to synthesis
14
Figure 1-6. Nitrogen cycle (Gruber, 2008).
In sediments, organic nitrogen can be transformed into NH4+ by the ammonification or
mineralization processes by bacteria, actinomycetes and fungi in oxic conditions (Herbert, 1999). After that, in oxic conditions, nitrifying bacteria living in sediment can transform NH4+ to NO2
-(e.g. Nitrosomonas species) and then to NO3- (e.g. Nitrobacteria species); this process is called
nitrification or ammonia oxidation (Smil, 2000; Tuominen et al., 1998). Besides these processes, the denitrification process can reduce nitrate into N2 gas under anoxic conditions and release it to
the atmosphere.
3.1.2. Nitrogen sources
The global demand for food has been responsible for an enormous increase in the anthropogenic N input to the environment with a negative impact on human and ecosystem health. Generally, about 2.7 Tg of N yr-1 are emitted by food waste during consumption (Grizzetti et al., 2013); which took place in North America and Australia with over 1 kgN capita-1 yr-1 (Figure 1-7). Grizzetti et
15 al. (2013) showed that 35% of nitrogen emissions are in the atmosphere and 65% in the water system.
Domestic and industrial activities have significantly changed N cycle, especially N fixation in land and N input to hydrosystems (Camargo and Alonso, 2006). The expansion of cultivation of legumes – especially soy, alfalfa which consume lot of chemical fertilizers (Vitousek et al., 1997). Agricultural fertilization, biomass burning, cattle and feedlots, and industrial sources are the facilitator of increase of N2O concentration in the atmosphere (Chapin et al., 2011).
Figure 1-7. Nitrogen loose by food waste in consumption (Grizzetti et al., 2013). 3.1.3. Nitrification-denitrification processes
There are many factors which influence nitrogen transformations in estuaries, among which, saline water is the most important. At oxidized surface layers of sediment, mineralize organic nitrogen processes are affected by salted water. Most of mineralized nitrogen is released as NH4+ form in
estuaries. Conversely, in freshwater, nitrogen is a gas. This difference is explained by the physical characteristics and the competition of nitrification and denitrification process in both brackish and freshwater systems (Gardner et al., 1991). The movement of NH4+ in oxic zones can be restricted
16 lead to long retention time of NH4+ in freshwater and river-water column potentially contains high
concentration of NH4+. In contrast, in brackish (or salt) water, NH4+ existed in ion pair formation
with anions, e.g. Cl-, Br-… It leads to prevent cation exchange process between sediment and seawater; and NH4+ can be diffused to salted water before nitrification process happened
(Magalhães et al., 2005) (Figure 1-8).
Figure 1-8. Model of differential ammonium release between freshwater and brackish estuarine water (and coastal marine) sediments. Ion pairing is indicated by the coupling of anions (A-) and
cation (C+) in the diagram (see in Gardner et al., 1991). 3.2. Phosphorus
3.2.1. Phosphorus cycle
Phosphorus in ecosystems is released from rocks during weathering process to create a soluble form which can be uptake by plant to form organic compounds. Soil erosion and groundwater leaching then transfer phosphorus into the rivers, down to the ocean (Figure 1-9).
In aquatic systems, phosphorus exists in various forms such as particulate organic or inorganic phosphorus and dissolved organic or inorganic phosphorus. Whilst particulate organic phosphorus (POP) contributes to the organic matter, dissolved organic phosphorus (DOP) is produced during the mineralization process. Ortho-phosphate (PO43-) is dominant source for the living organism
growth. In rivers or estuaries, PO43- concentration is controlled by biogeochemical processes. Algal
and microorganism in rivers will uptake PO43- for growth (Cotner and Wetzel, 1992). However,
17 Houser and Richardson, 2010; James and Barko, 2004). When adsorption or precipitation processes on sediment surface occur, PO43- becomes particulate inorganic phosphorus (PIP)
(Avilés et al., 2006; House, 2003).
Figure 1-9. Phosphorus cycle. 3.2.2. Phosphorus sources
Phosphorus is generally used to product fertilizers and detergents, which caused contaminations in lakes, rivers and oceans. Point sources have been by far the main source of anthropogenic dissolved inorganic phosphorus (DIP). Human activities contribute to 19 % of total dissolved organic phosphorus (DOP) export, with diffuse sources. DIP and DOP transfers to coastal zone (1.09 and 0.67 Tg yr-1, respectively) are significantly lower than transfer of particulate phosphorus – PP (9.03 Tg yr-1) (Seitzinger et al., 2005 and references therein).
18 By combining with nitrogen, phosphorus has been by far the most important nutrient limiting phytoplankton development in coastal zone. The increase of nitrogen input leads to high value of dissolved inorganic nitrogen (DIN) and dissolved inorganic phosphorus (DIP) ratio, with some impacts on the phytoplankton growth and risks of algal blooms (Jickells, 1998). Phosphorus in marine waters depends on the balance between PO43- input from rivers, sediments and the recycling
in the ocean system (Baker et al., 2011). By contrast to nitrogen cycle, phosphorus input from atmosphere are not important (except for some oligotrophic ocean zones, Mills et al., 2004). Most of the time, estuaries are very important catalyzer, in the transformation of P between continental and oceanic areas (Statham, 2012).
3.2.3. The factors influencing the adsorption-desorption of phosphorus onto sediments
The transformation of phosphorus and its movement between sediment and water column is controlled not only by physico-chemical processes, such as adsorption/desorption, precipitation/dissolution and diffusion, but also by biological processes such as mineralization of organic phosphorus. When the water body contained high phosphorus level, PO43- will be
transferred from solution to sediment; this is adsorption process. At the opposite, if algal uptake phosphorus, it leads to a decline of phosphorus level. Phosphate ion will be released from particles into the water. This is desorption process. These two processes can control PO43- concentrations
in the river-water column via sorption process and exchanges between sediment bed and the water column (Garban et al., 1995; House et al., 1995; Jarvie et al., 2005).
3.3. Silica
3.3.1. Silica cycle
Dissolved silica (DSi – H4SiO4) plays an important role for the growth of organisms (diatoms,
radiolarian, and siliceous sponges) (DeMaster, 1981, 2002). These organisms use DSi to establish their bodies (frustules or skeleton), and they deposit Si as a solid amorphous Si (Conley, 2002; Sferratore et al., 2006). DSi originates from diffuse sources and essentially depends on basin lithology (Sferratore et al., 2005). Plants get silica from soils, and then transform the soluble silica into opal, which is occupied in the cell wall, cell laminas, and intercellular spaces. DSi can be transferred to the ocean by many paths including rivers, submarine volcanism and associated
19 hydrothermal emanations, glacial weathering, low temperature submarine weathering, release from silica-enriched pore water of pelagic sediments on the seafloor (DeMaster, 1981, 2002).
Figure 1-10. Silica cycle (Struyf et al., 2009).
It is also linked with some biologic processes that take place in deep-water layer (Figure 1-10). Firstly, part of silica from dead organism is dissolved into water column, enriching DSi in aquatic environment. Secondly, diatoms stand at 43% of the ocean main producer, and dominate silica input in marine water (Boggs, 2006). The production is then radiolarians which exist under form of suspended amorphous silica.
3.3.2. Silica sources
The estimated global river export of DSi is about 380 Tg yr-1 (340 – 427 Tg yr-1). Globally, 18 –
19 % of DSi amount is retained in reservoirs and river basins (Beusen et al., 2009). In fresh water bodies, silica concentration typically ranges from 5 to 25 mgSiO2 L-1 and the global average silica
level is about 13 mg L-1 in river water, normally seawater contained about 6.4 mgSi L-1.
DSi is carried to aquatic ecosystem through diffuse sources by weathering. Point sources are not likely to be significant, even though it is reported that DSi also enter to water column from domestic and industrial wastewater. Moreover, Amorphous silica (ASi), produced from terrestrial
20 ecosystem through erosion, is able to enter and can also become an important source of DSi (Graiver et al., 2003; Van Dokkum et al., 2004).
Many studies illustrated that silica level can decrease in estuary, through adsorption process. Suspended sediment can sorb DSi (Aston, 1980). The uptake of DSi by diatoms and opal mineral is an important biogeochemical process in estuaries. Bloom of diatoms is frequently related to a significant uptake of silica. This process occurs if the resident time of water in the estuary is longer than the time of development rate of diatoms; otherwise, the growth of diatoms occurs downstream, in the coastal zone.
3.4. Nutrients fluxes
Many studies have linked riverine nutrient exports with anthropogenic driven changes on freshwater, coastal and marine ecosystem at global scale (Meybeck, 1982; Turner et al., 2003). Because of their impacts on aquatic ecosystems, quantifying nutrient fluxes is necessary for developing management strategies to control limiting factor and eutrophication. As discussed before, nutrients are retained or eliminated through various processes during their carriage to the ocean. The difference between total inputs of nutrients and total outputs represents the retention processes (sedimentation and storage, adsorption/desorption of P onto sediment, DSi uptake of phytoplankton) or elimination processes (mineralization and nitrification/denitrification processes).
4. Carbon
Carbon is an element, which has played a major role for life growth on the Earth, since it is presented in most of the biological compounds. Carbon is also a main element of many minerals and also exists in different forms in the atmosphere (Falkowski et al., 2000). In the last centuries, anthropogenic activities have drastically changed the global carbon cycle, by releasing large quantity of carbon, with some consequences on the global climate and ecosystems (Falkowski et al., 2000).
21 4.1. Carbon cycle
The carbon cycle is represented by the exchange of carbon among the biosphere, geosphere, hydrosphere and atmosphere (Figure 1-11). The chemical, physical, geological and biological processes have stemmed of the exchanges of carbon between formations (Falkowski et al., 2000). The natural cycle of carbon in the atmosphere, ocean, terrestrial ecosystems and sediments is in equilibrium, so that human would not be affected because of stable carbon concentration in all compartments (Griggs and Noguer, 2002).
Figure 1-11. Carbon cycle (Bauer et al., 2013)
In the atmosphere, by photosynthesis processes, carbon dioxide goes out of the atmosphere and enters into the terrestrial and oceanic biosphere. In water, carbon dioxide reacts with water to form carbonic acid. After that, weathering process leads to the the adsorption of carbonic acid by rocks (Falkowski et al., 2000). Besides, carbon forms as organic matter and inorganic carbon in terrestrial biosphere (Lal, 2008). Compared to approximately 500 gigaTons of carbon in plants and organisms, there is about 1 500 gigaTons of carbon in soil (Griggs and Noguer, 2002; Lowe and Zealand, 2007). Organic carbon is by far the major component among all organisms. Autotrophic
22 organisms convert carbon dioxide to organic carbon, whilst heterotrophic organisms consume carbon of other organisms. Carbon leaves terrestrial biosphere by the combustions or respiration of organic carbon. After that, carbon is carried out to the sea by rivers or retained in soil (Bond-Lamberty and Thomson, 2010).
In aquatic system, oceans is the largest space for storing carbon in the world (Falkowski et al., 2000). Besides that, dissolved inorganic carbon (DIC) is around 15% in deep layer higher than in the surface layer (Jorge L. Sarmiento and Nicolas Gruber, 2006). In the deep layer, DIC can be restored for much longer periods of time (Falkowski et al., 2000). Carbon is transferred into the water column (e.g. rivers, lakes, reservoirs) from the atmosphere as dissolved CO2 (aq.) or
dissolved organic carbon (DOC). Organisms convert carbon into the form of organic carbon through photosynthesis process and it contributes to the food web process (Griggs and Noguer, 2002; Lowe and Zealand, 2007).
The riverine and estuarine carbon cycles are directly linked to global carbon cycle. The organic carbon input is carried out by rivers to estuaries and to coastal zones under the forms of POC and DOC (Cadee, 1984). Additionally, particulate or dissolved carbon concentrations are changing according to river-water discharge, seasonal variations (Meybeck, 2006). POC and DOC forms are produced by weathering/erosion from soil or soil leaching during wet season and by aquatic production during dry season (Cauwet and Mackenzie, 1993; Schlesinger and Melack, 1981), before being transported to riverine and estuarine systems. In the recent decades, POC proportion in suspended sediment was ranged from 1.7 to 4.0%; usually this value declined with an increase in suspended sediment concentration (Milliman et al., 1984).
4.2. Anthropogenic influences
Recently, land use change has led to the loss of biodiversity, which decrease ecosystems' regeneration and their ability to remove carbon from the atmosphere. For agricultural purposes, woodlands were replaced with agricultural or urban areas. These replacements of land cover lead to a lower concentration of carbon retained in soil; and as consequences, a longer resident time in the atmosphere. Another reason for the shift of carbon contents in ecosystems is human induced air pollution. Agricultural activities can also lead to a serious increase of atmospheric carbon through the leaching and erosion of soils, which alter plant productivity.