P.M. Ambiihl P.E. Ballmer S. Kr~ihenbiihl R. Krapf
Quantification and predictors
of plasma volume expansion
from mannitol treatment
Received: 27 January 1997 Accepted: 18 August 1997
P.E. Ballmer
Department of Internal Medicine Kantonsspital CH-8401 Winterthur Switzerland S. Kr/~henNihl Clinical Pharmacology University of Berne CH-3010 Berne Switzerland
EM. Ambt~hl t ([~). R. Krapf Department of Internal Medicine, Kantonsspital, CH-9007 St. Gallen, Switzerland
1 Present address: R M. Ambtthl,
Abteilung ft~r Nephrologie, Universitfitsspital, R~imistrasse 100, CH-8091 Ziirich, Switzerland Fax: +41 (1) 2554593
e-mail: [email protected]
Abstract Objective: To determine the effects of acute hypertonic man- nitol infusion on intravascular vol- ume expansion and to identify po- tential predictors of hypervolemia.
Design: Measurements of plasma
volume and volume regulatory hor- mones were performed in healthy volunteers before and over 90 min after acute infusion of 20 % manni- tol solution in a therapeutic dose of 0.5 g/kg body weight, equalling an average infusion volume of 180 ml.
Setting: Clinical research unit in an
800-bed teaching hospital in the eastern part of Switzerland.
Participants: Eight normal male vol-
unteers.
Measurements and results: Baseline
plasma volume was determined by the indocyanine green dye dilution technique. Serial plasma protein measurements were performed after mannitol infusion to calculate intra- vascular volume changes. Mannitol administration resulted in a plasma expansion that persisted for more than 90 min and peaked at 112 % of the baseline plasma volume 15 min after infusion. Concomitantly, an in- crease in systolic blood pressure and
a fall in plasma sodium concentra- tion occurred. Pharmacokinetic analyses of mannitol distribution and elimination revealed a close re- lation between plasma volume ex- pansion and mannitol serum con- centrations. While renin activity and aldosterone concentrations were suppressed proportionally to the in- travascular volume increase, antidi- uretic hormone was increased de- spite notable volume expansion and hyponatremia. Similarly, a rise in atrial natriuretic peptide was de- tected.
Conclusions: Therapeutic doses of
hypertonic mannitol cause substan- tial plasma volume expansion, re- sulting in increased blood pressure. Plasma volume expansion is related to mannitol serum concentrations and mannitol clearance determines the time required to restore normo- volemia. A D H and A N P are poten- tially aggravating factors of manni- tol-induced hyponatremia.
Key words Mannitol- Volume expansion • Hormone
response • Pharmacokinetics
Introduction
Mannitol is frequently employed in the setting of inten- sive care medicine, especially for the treatment of acute renal failure related to cardiovascular operations or se- vere traumatic injury, and to control cerebral edema.
However, the administration of mannitol is associated with a number of serious side effects, such as volume overload, hyponatremia, metabolic acidosis, hyperkale- mia and acute renal failure [1, 2]. Since these adverse re- actions are probably the consequence of overdosing [3], they might be predictable, and thus preventable, if the
clinician could base his t r e a t m e n t on e x p e r i m e n t a l data concerning the effects of mannitol. M o s t of these effects are s e c o n d a r y to the osmotic p r o p e r t i e s of m a n n i t o l in p l a s m a and g l o m e r u l a r filtrate which cause an increase in p l a s m a osmolality, extracellular fluid expansion, inhi- bition of renal s o d i u m r e a b s o r p t i o n and natriuresis [4]. The extent to which m a n n i t o l g e n e r a t e s v o l u m e changes and electrolyte disorders and their p a t h o p h y s i o l o g y are i n c o m p l e t e l y understood. T h e literature is scarce on studies that h a v e e x a m i n e d these questions c o m p r e h e n - sively. S e r u m c o n c e n t r a t i o n s of v o l u m e r e g u l a t o r y hor- m o n e s such as ANP, vasopressin, renin and a l d o s t e r o n e are affected by acute m a n n i t o l admininistration [5-9], but their i m p a c t has n e v e r b e e n investigated in relation to v o l u m e effects, m a n n i t o l concentrations and p h a r m a - cokinetics.
The aim of the p r e s e n t study was to quantify the s h o r t - t e r m intravascular v o l u m e effect of a t h e r a p e u t i c m a n n i t o l dose in n o r m a l men. To define factors that pre- dict the time course of v o l u m e expansion and regression m a n n i t o l distribution a n d elimination were calculated f r o m p h a r m a c o k i n e t i c analyses. To f u r t h e r characterize the m e c h a n i s m s that induce h y p e r v o l e m i a and hy- p o n a t r e m i a , we d e t e r m i n e d p l a s m a concentrations of v o l u m e regulatory h o r m o n e s such as atrial natriuretic p e p t i d e ( A N P ) , antidiuretic h o r m o n e ( A D H ) , p l a s m a a l d o s t e r o n e (PA) and p l a s m a renin activity ( P R A ) after m a n n i t o l administration. O u r studies d e m o n s t r a t e that m a n n i t o l t r e a t m e n t causes significant alterations in vas- cular v o l u m e status with fluid shifts, a c c o m p a n i e d by in- creased systolic b l o o d pressure, a fall in p l a s m a sodium concentrations and changes in h o r m o n e levels regulat- ing w a t e r homeostasis. M o r e o v e r , we d e m o n s t r a t e that m a n n i t o l s e r u m c o n c e n t r a t i o n and clearance are the m a j o r d e t e r m i n a n t s of its v o l u m e effects, w h e r e a s in- creases in A D H and A N P m a y contribute to the devel- o p m e n t of h y p o n a t r e m i a following m a n n i t o l infusion.
Methods
Subjects
Experiments were performed in eight male, healthy volunteers (33 + 2 years old; 74.6 + 4.2 kg body weight; 182 + 3 cm height; 1.90 + 0.07 m 2 body surface area). Participants were non-smokers, abstained from consuming coffee and alcohol, and confined their physical activity to a minimum the day prior to the experiments. None of the volunteers consumed any drugs. The experiments were carried out in the morning after an overnight fast. Water in- take was allowed until the beginning of the study. Urine collection was performed during the 24 h before the start of the experiment to measure creatinine clearance.
Procedure
Volunteers sat throughout the investigation. Two indwelling cathe- ters were placed, one in each arm, for separate infusions and blood sampling. Baseline parameters, including baseline plasma volume
(PVbl), were determined 30 rain later. The infusion of mannitol was started 30 min after the completion of blood sampling for PV u calculation. Hypertonic mannitol (0.5 g/kg body weight, 20% solution, corresponding to a volume of 2.5 ml/kg body weight) was administered intravenously over 10 min. Blood was drawn 15, 30, 45, 60 and 90 min after initiation of the infusion. The amount of blood drawn at each time point was replaced by in- fusion of isotonic sodium chloride. Blood pressure was determined in a sitting position at baseline, 15 min after mannitol administra- tion and at the end of the experiment. Urinary bladders were emp- tied 30 min before the infusions were started (to determine elec- trolytes and osmolality) and at the end of the experiment (to deter- mine creatinine, electrolytes and osmolality).
Blood measurements
Blood was collected in Vacutainer tubes for the determination of electrolytes, proteins, creatinine and osmolality [heparinized blood], as well as for plasma renin activity (PRA), plasma aldoster- one (PA) and antidiuretic hormone (ADH) [EDTA blood], and mannitol [whole serum]. For atrial natriuretic peptide (ANP) mea- surements blood was drawn manually into plastic syringes, to min- imize hemolysis, and transferred to polypropylene tubes contain- ing EDTA, to minimize adsorption on plastic surfaces. All tubes were immediately placed on ice and centrifuged within 15 rain at 3000 g and 4 °C for 10 min. Separated plasma for the determination of hormones was stored at-30 °C and analyzed within 8 weeks. The mannitol concentration in serum and urine was assessed by capil- lary gas chromatography after derivatization with hexamethyldisi- lazan [10]. ANP was measured with a radioimmunoassay (RIA) using an antibody against the human c~ANP (Eiken Kogaku, To- kyo). ADH, PRA and PA were determined by RIA. Osmolality was measured with a Fiske osmometer (Vogel OM 801, Giessen, Germany), sodium and potassium with an ion selective electrode (Hitachi 717) calibrated with a flame photometer. Creatinine was determined according to the modified Jaff6 reaction [11]. Protein concentrations to calculate plasma volume dilution were deter- mined by the Biuret method. The glomerular filtration rate (GFR) was estimated from creatinine clearance.
Plasma volumes
Baseline plasma volume (PVbl) was measured by using the indocy- anine green (ICG) dye dilution technique as described elsewhere [12]. ICG was administered in a concentration of 0.25 mg/kg body weight, and blood samples were drawn 2, 4, 6, 8 and 10 min after in- jection of ICG. Following centrifugation, 1.5 ml plasma samples were measured photometrically (Perkin Elmers Lambda II) to cal- culate baseline plasma volumes. The expanded plasma volume (PVex.) after mannitol infusion was calculated by relating the base- line plasma protein concentration (PPb0 to the plasma protein con- centration [13] at time points 15, 30, 45, 60 and 90 min after the start of infusion (PP+,) using the formula P V exp=
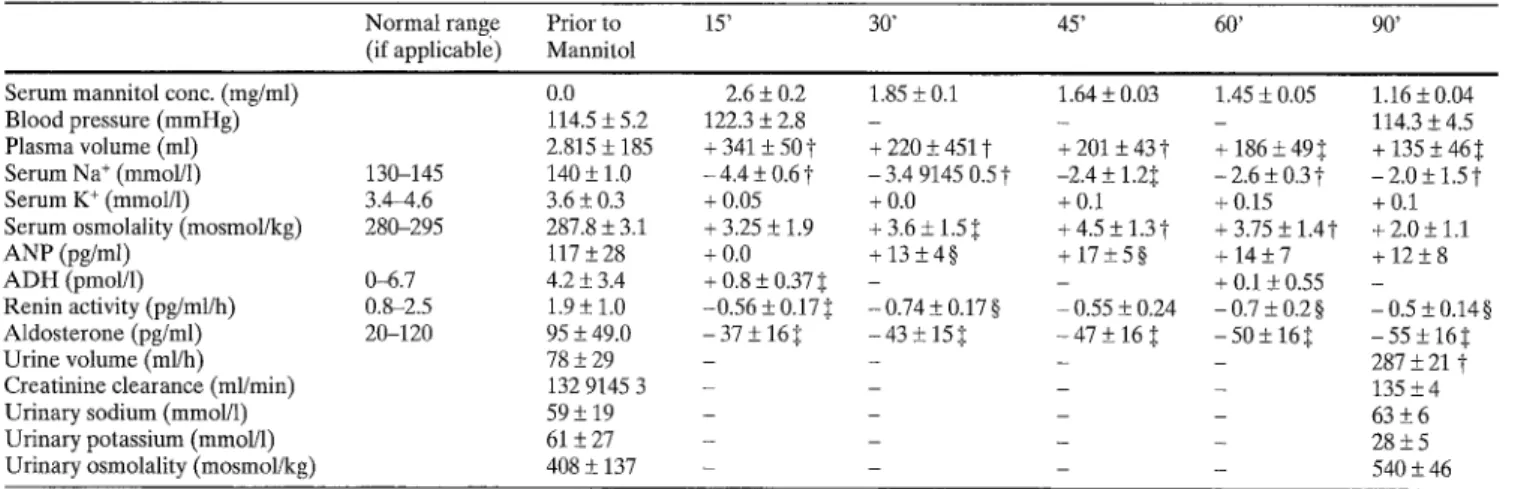
Table 1 Summary of physical and chemical parameters deter- mined prior and after administration of mannitol. All values are means+SEM. All baseline measurements were performed 30 min prior to administration of mannitol. Serum mannitol, elec- trolyte and hormone concentrations were determined also at 15, 30, 45, 60 and 90 min after start of mannitol infusion, and are pre- sented as relative changes from baseline (except for mannitol con-
centrations). Blood pressure and urinary parameters are shown in absolute numbers, and were assessed at baseline and 90 rain after start of mannitol infusion (BP also after 15 min). Baseline creati- nine clearance is based on a 24-h urine collection, which was com- pleted 30 min before mannitol infusion. Creatinine clearance at 90 min was determined from blood and urine samples collected at the end of the experiment
N o r m a l range Prior to 15' 30" 45' 60' 90' (if applicable) Mannitol
Serum m a n n i t o l conc. (mg/ml) 0.0 Blood pressure ( m m H g ) 114.5 + 5.2 Plasma volume (ml) 2.815 + 185 Serum N a + (mmol/1) 130-145 140 + 1.0 Serum K + (mmoI/1) 3.4-4.6 3.6 _+ 0.3 Serum osmolality (mosmol/kg) 280-295 287.8 _+ 3.1 A N P (pg/ml) [17 _+ 28 A D H (pmol/1) 0-6.7 4.2 -+ 3.4 R e n i n activity (pg/ml/h) 0.8-2.5 1.9 -+ 1.0 A l d o s t e r o n e (pg/ml) 20-120 95 _+ 49.0 U r i n e volume (ml/h) 78 _+ 29 Creatinine clearance (ml/min) 132 9145 3 U r i n a r y sodium (mmol/1) 59 +_ 19 U r i n a r y potassium (mmol/1) 61 -+ 27 U r i n a r y osmolality (mosmol/kg) 408 "+ 137 2.6 + 0.2 1.85 ± 0.1 1.64 + 0.03 1.45 _+ 0.05 1.16 + 0.04 122.3 + 2.8 - - - 114.3 _+ 4.5 + 3 4 1 + 50~ + 2 2 0 - + 4 5 1 t + 2 0 1 + 4 3 t + 1 8 6 + 4 9 ~ + 1 3 5 - + 4 6 5 -4.4-+ 0 . 6 t - 3.4 9145 0 . 5 t -2.4 _+ 1.2~. -2.6-+ 0 . 3 t - 2 . 0 + 1 . 5 t + 0.05 + 0.0 + 0.1 + 0.15 + 0.1 +3.25_+1.9 +3.6_+1.5~ +4.5 +1.3~- + 3.75_+ 1.4t +2.0_+1.1 + 0 . 0 + 1 3 + 4 § + 1 7 - + 5 § +14_+7 +12_+8 + 0.8-+ 0.37:~ - - +0.1-+0.55 - - 0 . 5 6 + 0.17~ -0.74_+0.17§ - 0.55 -+ 0.24 -0.7_+0.2§ -0.5_+0.14§ - 3 7 - + 16:I - 4 3 - + 151: -47_+ 16 .~ -50_+ 16~ - 5 5 + 1 6 : ~ . . . . 287 + 21 "~ . . . . 135 _+ 4 . . . . 63 "+6 . . . . 28"+5 . . . . 54O + 46
9: P at least < 0.01; ~: p at least < 0.05; §: p at least < 0.02
Pharmacokinetic calculations
Plasma concentration-time curves were analyzed model-indepen- dently. The terminal elimination half-life was calculated from the slope of the terminal elimination phase @) after semilogarith- mic transformation as follows: tl/2 = ~ . The total plasma clear-
A
dose
ance (CL) of administered mannitol was calculated as C L = A UC'
where dose is the mannitol dose infused and AUC the area under the plasma concentration-time curve. AUC was calculated by the trapezoidal rule as follows: A U C = A U C ( O - t ) + c_~), where AUC(0-t) is the area from time 0 to the last time point when a plas- ma sample was obtained and C(t) the plasma concentration at this time point. The volume of distribution at steady state was calculat-
A U M C
ed as: Vss = dose A U C 2 ' with AUMC being the area under the first moment concentration-time curve, calculated according to Shumaker [14].
T h e s t u d y p r o t o c o l w a s a p p r o v e d b y t h e h o s p i t a l ' s E t h i c C o m - m i t t e e . All volunteers gave written informed consent.
Statistical analyses
The results are given as means + standard error of the mean (SEM). Statistics were performed on absolute values by analysis of variance for repeated measurements (ANOVA). Correlation between the different variables was estimated by regression analy- sis. Probability values less than 0.05 were considered statistically significant. To account for interindividual variability of baseline concentrations, the results for hormone analyses are also presented as mean percentage change from baseline (in the text and Fig. 1B- F).
Results
A s u m m a r y o f all results is given in table 1.
M a n n i t o l c o n c e n t r a t i o n s a n d kinetics
I n f u s i o n of m a n n i t o l in a t h e r a p e u t i c d o s e (20 % solu- tion, 0.5 g/kg b o d y w e i g h t ) o v e r 10 m i n r e s u l t e d in a p e a k s e r u m c o n c e n t r a t i o n o f 2.6 + 0.25 m g / m l after 15 m i n (Fig. 1A). E l i m i n a t i o n o c c u r r e d in a biphasic m a n n e r with a slightly s l o w e r d e c r e a s e in s e r u m c o n c e n - t r a t i o n s after 30 min, resulting in a t e r m i n a l tl/2 o f 79 + 7 min. M a n n i t o l p l a s m a c l e a r a n c e e q u a l l e d 142 _+12 ml/min. T h e v o l u m e o f d i s t r i b u t i o n was 15.4 + 1.1 1, reflecting t h e p e n e t r a t i o n o f m a n n i t o l across t h e v a s c u l a r c o m p a r t m e n t i n t o the interstitium. E f f e c t s o n p l a s m a v o l u m e , b l o o d p r e s s u r e a n d u r i n e e x c r e t i o n
I n o r d e r to assess the v o l u m e effect o f 180 + 9 ml hypero t o n i c m a n n i t o l solution, p l a s m a v o l u m e s w e r e deter- m i n e d at baseline b e f o r e t h e a d m i n i s t r a t i o n o f m a n n i t o l b y t h e i n d o c y a n i n e g r e e n d y e dilution t e c h n i q u e (PVbl). C h a n g e s in p l a s m a v o l u m e s 15, 30, 45, 60 a n d 90 m i n af- ter the start of infusion w e r e c a l c u l a t e d f r o m baseline values a n d c h a n g e s in p l a s m a p r o t e i n c o n c e n t r a t i o n s at t h e r e s p e c t i v e time p o i n t s (Pvex p + n)" I n f u s i o n o f a t h e r a - p e u t i c d o s e of m a n n i t o l r e s u l t e d in a m a x i m a l p l a s m a v o l u m e increase o f 341 + 44 ml or 112.2 + 1.5 % o f base- line v o l u m e s 15 m i n after t h e start o f infusion (p < 0.001;
¢33 E -20 -40 -60 100 80 60 <~ 40 20 0 ( C ) Renin I I I I (E) ADH ] I I I 15 30 45 60 Minutes 90
Fig.IA-F Changes in serum mannitol concentrations (A), plasma volume expansion (B) and endocrine response (PRA (C), PA (D), ADH (E), and ANP (F)) after intravenous administration of mannitol: All values are means + SEM. Except for mannitol con- centrations (absolute values), numbers are presented as mean per- cent changes from baseline (= 0). Time points are indicated as rain after start of infusion, which was completed at 10 min. Mannitol concentrations at all time points: p < 0.001 vs. baseline (all statisti- cal analyses were performed on absolute numbers).
Arrow
(1") in- dicates T m for mannitol: p t at least < 0.05; :~: p at least < 0.02Fig.lB). Concomitantly, blood pressure rose from 114.5 + 5.2 to 122.3 + 2.8 m m H g , but returned to base- line values at 90 min after start of mannitol administra- tion (114.3 + 4.5 mmHg). In order to determine the specificity of the blood pressure response to mannitol, isotonic NaC1 was infused to the same volunteers in a separate experiment and in an even larger volume (420 + 25 ml) than the resulting plasma expansion from mannitol. Unlike the reactions to mannitol, systolic blood pressure was virtually unchanged by the adminis- tration of saline ( 1 1 6 . 5 + 4 . 6 m m H g before, and 116.3 + 3.8 m m H g 15 min after infusion of NaCI: p < 0.01 vs increase in systolic blood pressure after man- nitol). Mannitol infusion yielded a urinary volume pro- duction of 431 + 31 ml over 90 min, increasing the urine flow from 78 + 29 to 287 + 21 ml/h (p < 0.0001). It is noteworthy that volume expansion lasted for more than 60 min, the time point where the increase in plasma volume equalled the volume of infused mannitol.
20 15 5 0 0 -2O -40 -60 50 40 o 30 20 10 0 (B) Plasma Volume I I ] I }
(D)
I I Aldo I I I (F) ANP 15 30 45 60 90 MinutesEven after 90min, when volunteers had excreted more then 400 ml of urine, plasma volumes were still 135 + 4 6 m l above baseline values (Fig.lA). As for the elimination of mannitol, a biphasic curve was found for regression of the mannitol-associated increase in plasma volume. The initial transcellular volume shift (Vshift) induced by mannitol can be estimated from the product of the percent change in serum sodium concen- tration at 15 min and the estimated volume of extracel- lular water ( E C V = 2 0 % of body weight):
V s h i fl =
[NaO][NaO]-
[Nal5]
• E C V =140-135.6140
0.2 - 751 = 0.465 1.Plasma osmolality
As anticipated, mannitol significantly raised plasma os- molality from 288 + 1.1 to 293 + 1.2 mosmol/kg (Ta- ble 1). Whereas time-matched correlations between changes in plasma osmolality following mannitol infu- sion and intravascular volume expansion missed statisti- cal significance (r = 0.32, p < 0.08), significant correla- tions were found when the changes in plasma volume were matched with osmolality changes at the preceding time point. For example, volume expansion determined 30 rain after the beginning of mannitol infusion corre- lated significantly with changes in osmolality measured 15 min earlier (r = 0.82, p < 0.05). Similarly, the increase
in plasma volume after 90 min was strongly correlated with the increase in osmolality at 45 rain from infusion (r = 0.94, p < 0.01). Of interest is the fact that mannitol concentrations were significantly and positively corre- lated with intravascular volume expansion (r = 0.45, p < 0.02).
Effect on plasma sodium
Plasma sodium was significantly lowered by mannitol during the whole experiment, reaching minimal concen- trations 15 rain after the start of infusion (Table 1).
Endocrine response
Plasma renin activity and aldosterone concentrations were lowered significantly after volume expansion due to mannitol (Fig. 1C and D). The mean percentage de- creases from baseline for P R A ranged between 25 + 5 (t = 15 rain) and 37 + 3 (t = 30 min); and for PA between 34 + 9 (t = 30 rain) and 50 + 9 (t = 90 min).
Despite the marked plasma volume expansion occur- ring after its administration, mannitol "paradoxically" increased plasma concentrations of A D H by a mean percentage of 54 _+ 28 at 15 min (p < 0.05) and 28 _+ 41 at 60 min from baseline (Fig. 1E). Moreover, the in- crease in A D H concentrations after mannitol infusion correlated positively with the early changes in plasma osmolality (r = 0.73, p = 0.04) but was unrelated to changes in plasma volumes. Finally, ANP concentra- tions after mannitol infusion were significantly elevated by a maximum mean percentage of 23 + 11 over base- line at 45 min @ = 0.02; Fig. 1F). Unlike A D H , the en- docrine response of ANP after mannitol infusion was in- dependent of changes in serum osmolality.
Discussion
In this study we induced and quantified substantial vol- ume expansion in normal subjects with a pharmacologi- cal dose of hypertonic mannitol solution. This was ac- companied by an increase in systolic blood pressure and decreased sodium concentrations. We have further elucidated determinants that may account for some of mannitol's adverse effects.
Volume overload is among the most serious side ef- fects resulting from mannitol. The mean infused volume of mannitol (180 ml) in our experiments caused an in- travascular volume expansion of up to 341 ml which peaked at 15 min and persisted for the length of the study (Fig. 1B). The total intravascular volume shift (Vshift) induced by I80 ml of infused mannitol (Vinf) was 465 ml. The calculated volume effect (Vef0 of mannitol,
expressed as Vef f =
Vshift+Vi,,f
Vi,,f
was 358 %, or about 3 times the administered volume load. The hemodynamic impact of this volume effect is underlined by the ob- served increase in systolic blood pressure that occurred even in our normal volunteers. This effect coincided with the greatest degree of intravascular volume expan- sion by mannitol. Such a short-term volume load may significantly compromise the hemodynamic capacity, in particular when projected to patients with impaired car- diac or renal function.Changes in intravascular volume status were closely related to serum osmolality and serum mannitol concen- trations. A tight relationship between the serum manni- tol concentration and the plasma volume expansion is further supported by the similar shape of the time curves of the plasma volume and the mannitol serum concentration, with a change in their slope after 30 min. Moreover, our pharmacokinetic data suggest that the regression of plasma expansion is mainly deter- mined by the serum tl/2 of mannitol, which averaged 79 min. The regression rate of volume expansion be- tween 15 and 90 min after mannitol infusion equals 0.6 %/min. At 79 min after mannitol infusion, the vol- ume expansion was still 52 % of the initially observed in- crease, which is close to the 50 % decrease of the manni- tol serum concentration at this time point (Fig. 1A).
To further elucidate the mechanisms that cause hyp- ervolemia, increased blood pressure and hyponatremia, we investigated the endocrine response to mannitol ad- ministration. Whereas the observed decrease in plasma renin activity and plasma aldosterone concentrations is most likely secondary to the mannitol-induced plasma volume expansion, the changes in A D H and ANP re- quire further consideration. It is noteworthy that an in- crease in A D H after mannitol occurred in the presence of hyponatremia and hypervolemia. This response is at- tributable to the increase in osmolality and/or plasma mannitol concentrations. As the osmoregulatory mech- anism is not equally sensitive to all plasma solutes [9], the resulting stimulatory effect of mannitol and its con- secutive rise in serum osmolality was more potent than the inhibitory effects of hyponatremia and plasma vol- ume expansion. The fact that mannitol increases A D H concentration in the face of a fall in plasma sodium con- centration could aggravate mannitol-induced hy- ponatremia clinically, as collecting duct water reabsorp- tion would be expected to be stimulated despite volume expansion and hyponatremia in this setting. Finally, mannitol increased ANP concentrations, most likely by volume expansion, which is the main stimulus for ANP release [15]. This increase in plasma ANP has to be con- sidered with regard to the effects of ANP on urinary electrolyte handling. It is well established that ANP in- creases renal sodium excretion in a concentration-de-
pendent manner [16]. Moreover, an additive effect of ANP and mannitol on sodium excretion in dogs has been described when they were infused together [17]. Consequently, the mannitol-induced rise in plasma ANP concentrations may contribute to the natriuresis and hyponatremia resulting from mannitol administra- tion.
What are the clinical implications of our findings? The present data indicate that severe hypervolemia and detectable hyponatremia occur after mannitol adminis- tration, even in healthy subjects. It is likely that these ef- fects are even more pronounced in patients with im- paired cardiac and renal function prone to develop se- vere hypervolemia and hyponatremia. However, our pharmakokinetic determinations have shown that man- nitol clearance from the serum determines the regres- sion of intravascular volume expansion, and thereby
normalization of volume status. Moreover, our experi- ments suggest that repetitive determinations of serum osmolality are valuable in is predicting the extent of vol- ume expansion from mannitol treatment and detecting patients that warrant special attention. To further evalu- ate the impact of adapted mannitol treatment, clinical studies based on the present results are suggested in se- lected clinical settings. From a pathophysiological point of view, the present study proposes a potential role for A D H and ANP in the development of hypervolemia and hyponatremia resulting from mannitol infusion. Acknowledgements. We would like to thank Yvonne Ambt~hl for technical assistance with the study, Dr. Monika Sch6pflin (B. Braun Medical Company, St.Gallen, Switzerland) for mannitol de- terminations and Dr. Joel Melnick for helpful discussions in the preparation of the manuscript.
References
1. Cottrell JE, Robustelli A, Post K et al. (1977) Furosemide- and mannitol-in- duced changes in intracranial pressure and serum osmolality and electrolytes. Anesthesiology 47:28-30
2. Dorman HR, Sondheimer JH, Cadna- paphornchai P (1990) Mannitol-in- duced acute renal failure. Medicine 69: 153-159
3. Rabetoy GM, Federicks MR, Hostett- ler CF (1993) Where the kidney is con- cerned, how much mannitol is too much? Ann Pharmacother 27:25-28 4. Lang F (1987) Osmotic diuresis. Renal
Physiol 10:160-173
5. Kamoi K, Sato E Arai O, Ishibashi M, Yamaij T (1988) Effects of plasma vol- ume and osmolality on secretion of atri- al natriuretic peptide and vasopressin in man. Acta Endocrinol 118:51-58 6. Yamasaki Y, Nishiuchi T, Kojima A,
Saito H, Saito S (1988) Effects of an oral water load and intravenous admin- istration of isotonic glucose, hypertonic saline, mannitol and furosemide on the release of atrial natriuretic peptide in men. Acta Endocrinol 119:269-276
7. Uretsky BE Verbalis JG, Srinivas M et al. (1990) Control of atrial natriuretic peptide secretion in patients with se- vere congestive heart failure. J Clin En- docrinol Metab 71:146-151
8. Kurnik BRC, Lawrence SW, Askenase AD, Kurnik PB (1991) Mannitol stimu- lates atrial natriuretic peptide release in humans. Am J Kidney Dis 17:62-68 9. Zerbe RL, Robertson GL (1983) Os-
moregulation of thirst and vasopressin secretion in human subjects: effects of various solutes. Am J Physiol 244:E607-E614
Knapp DR (1979) Handbook of analyt- ical derivatization reactions. Wiley, New York
Bartels H, Cikes M (1969) Chromogens in the creatinine determination of Jaff6. Clin Chim Acta 26:1-10
Bradley EC, Barr JW (1968) Determi- nation of blood volume using indocya- nine green (Cardio green) dye. Life Sci 7:1001-1007
10.
11.
12.
13. Thompson WO, Thompson PK, Dailey ME (1988) The effect of posture upon the composition and volume of the blood in man. J Clin Invest 5: 573- 609
14. Shumaker RC (1986) PKCALC: A BA- SIC interactive computer program for statistical and pharmacokinetic analysis of data. Drug Metab Rev 17: 331-348
15. Lang RE, Th61ken H, Ganten D, Luft FC, Ruskoaho H, Unger T (1985) Atrial natriuretic factor: a circulating hor- mone stimulated by volume loading. Nature 314:264-266
16. Weder AB, Sekkarie MA, Takiyyuddin M, Schork NJ, Julius S (1987) Antihy- pertensive and hypotensive effects of atrial natriuretic factor in men. Hyper- tension 10:582-589
17. Levy M, Cernacek P (1993) Urinary so- dium excretion in chronic caval dogs af- ter combined infusions of mannitol and ANR Am J Physio1264:F206-211