ENVIRONMENTAL MICROBIOLOGY
Contrasting Species
—Environment Relationships
in Communities of Testate Amoebae, Bryophytes
and Vascular Plants Along the Fen
–Bog Gradient
Mariusz Lamentowicz&Łukasz Lamentowicz&
Willem O. van der Knaap&Maciej Gąbka&
Edward A. D. Mitchell
Received: 17 July 2009 / Accepted: 8 November 2009 / Published online: 3 December 2009
# Springer Science+Business Media, LLC 2009
Abstract We studied the vegetation, testate amoebae and abiotic variables (depth of the water table, pH, electrical conductivity, Ca and Mg concentrations of water extracted from mosses) along the bog to extremely rich fen gradient in sub-alpine peatlands of the Upper Engadine (Swiss Alps). Testate amoeba diversity was correlated to that of mosses but not of vascular plants. Diversity peaked in rich fen for testate amoebae and in extremely rich fen for mosses, while for testate amoebae and mosses it was lowest in bog but for vascular plants in extremely rich fen. Multiple factor and redundancy analyses (RDA) revealed a stronger correlation of testate amoebae than of vegetation to water table and hydrochemical variables and relatively strong correlation between testate amoeba and moss community data. In RDA, hydrochemical variables explained a higher proportion of the testate amoeba and
moss data than water table depth. Abiotic variables explained a higher percentage of the species data for testate amoebae (30.3% or 19.5% for binary data) than for mosses (13.4%) and vascular plants (10%). These results show that (1) vascular plant, moss and testate amoeba communities respond differently to ecological gradients in peatlands and (2) testate amoebae are more strongly related than vascular plants to the abiotic factors at the mire surface. These differences are related to vertical trophic gradients and associated niche differentiation.
Introduction
The study of species/environment relationships is classical in ecological research, which, over the last century, has led
Electronic supplementary material The online version of this article (doi:10.1007/s00248-009-9617-6) contains supplementary material, which is available to authorized users.
M. Lamentowicz
Department of Biogeography and Palaeoecology, Faculty of Geosciences, Adam Mickiewicz University, Dzięgielowa 27,
61-680 Poznań, Poland
M. Lamentowicz
:
E. A. D. Mitchell Swiss Federal Research Institute WSL,Ecosystem Boundaries Research Unit, Wetlands Research Group, Station 2,
CH–1015 Lausanne, Switzerland M. Lamentowicz
:
E. A. D. MitchellEcole Polytechnique Fédérale de Lausanne (EPFL), Laboratoire des Systèmes Ecologiques,
Station 2,
CH–1015 Lausanne, Switzerland
M. Lamentowicz (*)
:
E. A. D. Mitchell (*) Laboratory of Soil Biology, Institute of Biology, University of Neuchâtel,CH-2009 Neuchâtel, Switzerland e-mail: [email protected]
Ł. Lamentowicz
:
M. GąbkaDepartment of Hydrobiology, Faculty of Biology, Adam Mickiewicz University,
61-614 Poznań, Poland W. O. van der Knaap
Institute of Plant Sciences and Oeschger Centre for Climate Change Research, University of Bern,
Altenbergrain 21,
CH-3013 Bern, Switzerland
e-mail: [email protected]
to important concepts such as ecological niche and gradients [1]. However, most studies have focused on vascular plants or animals, while microorganisms and soil organisms have received less attention [2]. It has been argued that because of this, some important aspects of terrestrial ecology escaped attention [3]. For example, it was assumed that general theories derived from vegetation, such as peak diversity at intermediate levels of nutrients or disturbance would also be valid for, e.g. soil organisms, but this does not seem to be the case [4]. Generalized theories are however difficult to achieve because few studies included more than one taxonomic or functional group (e.g. vascular plants). This study is a contribution by focussing on both taxonom-ically and functionally contrasted groups of organisms in the same ecological gradients.
Peatlands are good model ecosystems to study the relationships among communities of different groups of organisms along ecological gradients. Ecologists, however, tend to infer ecosystem gradients and function in peatlands solely on the basis of the vegetation, which may be misleading because the gradients are usually complex and not correlated in a straightforward way [5]. Well-known is the clear gradient from nutrient-rich fen (ground-water fed, dominated by sedges) to ombrotrophic bog (nutrient-poor, Sphagnum dominated) [6]. In addition, a vertical gradient mostly exists between more acidic and the usually circum-neutral mire surface and more nutrient-rich deeper layers [7], which is largely due to the capacity of living Sphagnum to immobilise nutrients and acidify the water [8].
This study focuses on three different functional groups: vascular plants, mosses and testate amoebae. Testate amoebae are good indicators of soil type, micro-environmental gradients and soil pollution [9, 10] and play important functional roles in the cycling of elements in terrestrial ecosystems [11–13]. They are thus suitable for the study of soil biodiversity and were for example used for the monitoring of peatland restoration [14, 15]. In peat, they are well preserved and thus provide an important archive for palaeoecology [16]. Testate amoebae depend very strongly on surface wetness (e.g. [9] and references therein), but they also respond to factors like water chemistry [17–20]. Most ecological studies on peatland testate amoebae were done in ombrotrophic mire, which have relatively short hydrological and hydrochemical gradients. Also in ombrotrophic mire was the only existing study in which vascular plants, non-vascular plants, testate amoebae and water chemistry were explored together [21]. By contrast, fens and transitional mires were much less studied for testate amoebae in relation to water chemistry [17,19,22–25], and no single study ever addressed before the comparative response of testate amoebae and vegetation to the full fen–bog gradient.
This study addresses the general question of responses of contrasted groups of organisms to ecological gradients. For
this aim, we studied the diversity and community structure of testate amoebae and vegetation in relation to water table depth and water chemistry along the full rich fen to bog gradient in the subalpine peatlands of a central Alpine valley. Questions are: how are testate amoebae, mosses and vascular plants related to measured water depth, pH and water chemistry, and how can we explain the found relationships?
Study Sites
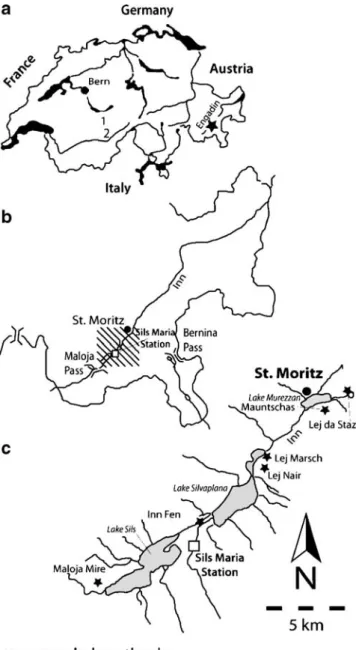
The study sites are located between 1,810 and 1,864 ma.s.l. in the Upper Engadin valley, SE Swiss Alps (Fig. 1, Table 1). This area is sub-continental, with relatively dry
Figure 1 Location of the study sites in Upper Engadin, south-eastern Switzerland
summers, contrasting with the sub-Atlantic western and northern part of the Swiss Alps. The actual timberline is at ca. 2,100–2,250 m elevation, with scattered trees up to the potential timberline at 2,400 m. The forest trees are Larix decidua and Pinus cembra growing up to 2,400 m and locally Picea excelsa up to about 2,000 m. In moist depressions and on dry mire grows Pinus montana (mountain pine; erect form of Pinus mugo).
All sampling sites are in mire vegetation. The main mire sampled is Mauntschas, a Sphagnum mire at the valley bottom surrounded by natural (but managed) subalpine forest. This mire includes a broad range of peatland habitat types such as minerotrophic transitional mire, sloping fen, and mountain-pine bog. Locally, the floristic composition indicates the influence of calcium-rich spring water (e.g. Primula farinosa), whereas other places seem ombrotrophic with hummocks of Sphagnum fuscum with Oxycoccus sp. and Andromeda polifolia. Some higher and therefore drier parts of the mire are dominated by S. fuscum and are covered by mountain-pine forest.
The other sampled peatlands represent various trophy and vegetation types. Maloja mire lies on the side of the valley bottom and is surrounded by non-natural (planted) Pinus mugo forest. This oligotrophic poor fen is dominated by Sphagnum fallax, Carex rostrata, and Eriophorum angustifolium. Inn Fen is a peaty meadow along the river Inn, dominated by sedges and with scattered Alnus incana and Salix; the samples are mainly vascular plant detritus. The mires of Lej da Staz, Lej Marsch, and Lej Nair lie adjacent to small lakes (Lej=lake) at or close to the valley bottom and are surrounded by managed natural subalpine forest. Lej Marsch and Lej da Staz mires represent typical examples of terrestrialization with floating Sphagnum mats near the lakeshore and more stable peat closer to the surrounding upland forest, and sampling was done in transects along this gradient. Lej Nair mire is a calcareous sloping fen with very rich vegetation with e.g. Campylium stellatum.
Methods
Field Sampling and Laboratory Treatments
All field sampling was done within three consecutive days in August 2007. At each of the 97 sampling sites GPS coordinates were determined, a sample was collected for the study of testate amoebae, mosses, and water chemistry the depth to the water table (DWT) was measured, and within ca 0.5 m2 presence/absence of vascular plant taxa and micro-habitat type was noted. Thirteen micro-habitat types were distinguished on the basis of surface features such as hummock, hollow, lawn, moss cover, moss type (Sphagnum, brown-mosses, hepatics, acrocarps, etc.) and dominant vascular plants; these types are shown by different symbols in the ordinations. For full data, see Electronic supplementary material, Table 1. The sampling sites cover the widest spectrum of mire habitats available in this Alpine valley, as judged on surface wetness and minerotrophy plant indicators. Nomenclature follows Lauber and Wagner [26] for vascular plants and Ochyra et al. [27] for mosses.
Conductivity, pH and cations (Ca2+ and Mg2+) were measured in the Hydrobiology Department of the Adam Mickiewicz University in Poznań on water extracted from the samples according to standard methods for hydro-chemical analyses [28]. Conductivity was corrected for pH (Sjors 1950). Samples for testate amoebae were stirred in warm water (ca 40 °C) and washed over sieves of 20 and 300 μm mesh. The fraction 20– 300 μm was used for the analysis. The testate amoebae were identified and counted at ×200 and ×400 magni-fications by ŁL under the direct supervision of ML. Eighty-four samples yielded full data and were thus used for numerical analysis; the remaining few had insufficient volume for chemical analysis and/or yielded too low numbers of testate amoebae. The identification of testate amoebae aimed at the highest possible
Table 1 Coordinates of the six study sites in Engadine, SE Switzerland and number of samples
Site name Latitudea Longitudea Altitude (a.s.l.) Number of samplesb
Mauntschas 46°27′27″ 09°51′22″ 1,818 m 36 (+5) Lej da Staz 46°29′50″ 09°52′10″ 1,810 m 10 (+1) Lej Marsch 46°28′31″ 09°49′11″ 1,813 m 10 (+2) Lej Nair 46°28′13″ 09°49′12.5″ 1,864 m 10 (+2) Inn Fen 46°24′28″ 09°42′10″ 1,803 m 11 (+2) Maloja mire 46°24′19″ 09°41′24.3″ 1,850 m 8 (+0)
aApproximate average for each site; see Electronic supplementary material, Table1for coordinates of individual sampling plots bSamples with incomplete measurements (in parentheses)
taxonomic resolution [29–31]; some difficult taxa were discussed with specialists in testate amoeba taxonomy. Numerical Analysis
The data sets of testate amoebae (96 taxa) and environ-mental variables (5 units) are quantitative; those of vascular plants (74 taxa) and mosses (20 taxa) are presence/absence (Electronic supplementary material, Tables 2 and 3). The numerical analysis was carried out using the software R version 2.8.1 [32].
Correlation coefficients of taxonomic richness among the biotic data-sets (testate amoebae, vascular plants and mosses) were calculated, and the patterns of taxonomic richness were analysed along the gradient of extremely rich fen to bog.
Multiple factor analysis (MFA), a method that seeks for common structures among data matrices, was applied to the data-sets of testate amoebae, vascular plants, mosses, vegetation (vascular plants and mosses together) and water chemistry in order to assess the general structure of the data and to determine the relationships among the data-sets [33]. The data-set“vegetation” was created for easier comparison of the results with results published elsewhere. Hellinger-transformation [34] was applied to the data-sets of testate amoebae, vascular plants and mosses, as this alleviates the double-zero problem in the principal components analysis (PCA) that forms part of MFA.
Site scores of a global PCA were used for cluster analysis according to Ward, and the resulting dendrogram was projected in the MFA ordination space. We classified the peatland types on the basis of the position of sample in the first two axes of the MFA ordination.
Direct gradient analysis (RDA) was applied on Hellinger-transformed data-sets of testate amoebae, vascular plants and mosses, and this was repeated in a run in which vascular plants and mosses were combined in one data-set ‘vegeta-tion’. Explanatory variables were water table depth, pH, the three water chemistry variables (conductivity, Ca and Mg) and sample scores on the first four axes of separately
performed detrended correspondence analyses (DCA) on the data-sets of testate amoebae, vascular plants and mosses. These four axes together explained 34%, 27% and 26% of the variation, respectively, for the testate amoeba, vascular plant and moss data-sets. This analysis enabled us to assess the relationships between the biological and environmental data-sets and to quantify the proportions of variance in the biological data-sets explained by water table depth, water chemistry and both together using variance partitioning [35]. Adjusted R2 was used in all RDA as an estimate of the proportion of explained variance, as non-adjusted R2(used in many comparable ecological studies) is not comparable among data sets with different numbers of explanatory variables [36]. The analysis was repeated with the testate amoeba data transformed to presence/absence, in order to exclude any bias due to the presence/absence character of the vegetation data. The relationships between vegetation and environmental data was studied in two ways, once carrying out the analysis with vascular plants and mosses combined in one set, and once again with the two data-sets separate, as was done in a previous study on five Sphagnum peatlands in Europe [37]. The variance parti-tioning of testate amoebae, vascular plants and mosses was repeated against a different set of explanatory variables, namely the sample scores on the first four axes of DCA of the other two biotic variables (e.g. for testate amoebae, the explanatory variables used were the DCA sample scores for axes 1–4 of vascular plants and of mosses).
Results
Water Table Depth and Hydrochemistry
Although the total of studied sites covers long ecological gradients, a large proportion falls in a short part of the gradients, as follows: DWT ranges from−20 to 76 cm, but most samples are between 0 and 18 cm; water pH covers 3.6 to 7.1, but is mostly 4.0 to 6.0; conductivity is 31.6– 3,503 μS, but mostly <600 µS; Ca is 0.08–176 mg/l, but mostly <50 mg/l; and Mg is 0.03–59 mg/l, but mostly <12 mg/l (Electronic supplementary material, Table1).
All pairs of environmental variables are strongly and significantly correlated (Electronic supplementary material, Fig.1, Table2). DWT is negatively correlated with all other variables but the correlation coefficient (r) is always lower than for any pair of chemical variables, and a threshold of DWT=20 cm is observed above which any correlation with chemical variables disappears. All pairs of chemical variables are positively correlated, strongest between Ca and Mg (r=0.9) and between Ca and conductivity (r=0.8). The correlation patterns among measured environmental variables on the scatter plots (Electronic supplementary
Table 2 Non-parametric correlation matrix of measured environmen-tal variables in mires of Engadine (SE Switzerland)
Cond pH Mg Ca DWT Cond 1 0.76 0.83 0.85 −0.49 pH 0.76 1 0.75 0.81 −0.62 Mg 0.83 0.75 1 0.92 −0.58 Ca 0.85 0.81 0.92 1 −0.66 DWT −0.49 −0.62 −0.58 −0.66 1
material, Fig.1) generally fit well to the micro-habitats as described in the field (based on vegetation and topography). In all scatter plots, the hayfield and wet brown-moss sites are located at the highest end of the gradient, and the
Sphagnum–brown-moss transition sites are in the middle of the gradient. However, the lowest values of Ca, Mg, conductivity and pH are in moderately wet Sphagnum lawn rather than in the driest sites (hummocks). The poor–rich gradient is best illustrated by pH and log-transformed conductivity. A bimodal distribution is observed for pH, and also for Ca and Mg that form two clusters. The first cluster includes mineral-rich habitats dominated by vascular plants and brown-moss and the second cluster includes mineral-poor Sphagnum–dominated sites.
Species Richness Patterns
Taxon richness of testate amoebae is significantly correlated only with that of mosses (r20.40, p<0.05), not with that of vascular plants (r2= 0.15, p > 0.05). Moss species and vascular plant species richness are weakly, but significantly, correlated (r2=0.25, p<0.05).
Figure2shows the patterns of diversity (taxon richness) per sample and the overall diversity per habitat type for testate amoebae, mosses and vascular plants. It is based on cluster analysis of site scores of a global PCA projected on the ordination plot of the MFA of vegetation, testate amoebae and environmental data, which divided the ecological gradient into four habitat categories (shown in Fig. 3, explained in more detail below). Diversity of
Figure 2 Species richness of vascular plants, mosses and testate amoebae along the trophy gradient, per sample (left axis; grey symbols, bars on graph indicate +/−1 SE) and per habitat type (right axis, black symbols). Different letters next to the grey symbols of a group indicate significance of average species richness difference among habitats (independent t tests)
Figure 3 Ordination plot of sites from the multiple factor analysis based on vegetation (presence/absence data), testate amoebae (percentage data), and environmental variables (water table depth and water chemistry) with projection of groups resulting from a cluster analysis made with Ward's method
vascular plants is lowest in extremely rich fen (6 taxa in total), which was usually strongly dominated by a single sedge taxon, but high and comparable in the other three habitats (25 or 26 taxa). The pattern for mosses is opposite with highest diversity in the extremely rich fen end of the gradient (28 taxa) and declining towards the bog (9 taxa in rich fen, eight in poor fen, and six in bog). Testate amoeba diversity peaked in rich fen (80 taxa) was lowest in bog (25) and intermediate in extremely rich fen and in poor fen (53 and 54, respectively).
Average vascular plant diversity increased less clearly but significantly from 2 taxa per site in extremely rich fen to 5.1 in bog. For mosses, the significant decrease from extremely rich fen (7.2 taxa per site) towards bog (1.3) was very similar to the trend of overall diversity. For testate amoebae, diversity per sample was maximal in extremely rich fen (22.2 taxa per site) and rich fen (23.9) and not significantly different between these two, but declined significantly towards poor fen (12.7) and again towards bog (7.8).
Ecological Gradients and Correlations Among Testate Amoebae, Vegetation and Environmental Variables In Fig. 3, dimension 1 of the MFA explains 16% of the variance and shows a wetness and trophic gradient. From left to right the water table increases and the four main habitat types are passed: mesotrophic Sphagnum bog;
moderately wet Sphagnum lawn; wet brown-moss lawn; and extremely rich fen. The pattern in Fig.3reminds of the ‘horse-shoe’ effect common in PCA and CA when the data are dominated by a strong gradient. The sites near the plot margins represent the two extremes of the poor–rich gradient, e.g. site M84 (rich meadow) and M54 (eroded raised bog; DWT=70 cm).
In the first MFA (Table 3), the highest correlation coefficient is observed between environmental variables (DWT and hydrochemistry) and testate amoebae (r=0.57). By contrast, the correlation between vegetation and environment is much weaker (r=0.29). This pattern is the same when presence/absence testate amoeba data are used rather than percentages (Table3). When the vegetation data is split into vascular plants and mosses, the highest correlation is still between testate amoebae and environ-mental variables, regardless of whether presence/absence or percentages are used (Table3). Neither mosses nor vascular plants are strongly correlated to environmental variables, and testate amoebae are more strongly correlated to mosses than to vascular plants.
In Table4, the first series of RDA shows the proportion of taxon data explained by each explanatory variable taken individually. This proportion ranged between 2.3% and 20.4% for environmental variables (all were significant) and between 1.3% and 15.8% for biotic variables (sample scores of DCA axes on moss, vascular plants or testate
Vegetation Vascular Mosses Testate amoebae Environment MFA
Testate amoeba data as percentages
Vegetation 1 0.40 0.29 0.84
Testate amoebae 0.40 1 0.57 0.78
Environment 0.29 0.57 1 0.69
MFA 0.84 0.78 0.69 1
Testate amoeba data as presence absence
Vegetation 1 0.4 0.29 0.83
Testate amoebae 0.4 1 0.56 0.77
Environment 0.29 0.56 1 0.69
MFA 0.83 0.77 0.69 1
Vegetation split into vascular plants and mosses, testate amoeba data as percentages
Vascular 1 0.34 0.33 0.22 0.72
Mosses 0.34 1 0.46 0.27 0.77
Testate amoebae 0.33 0.46 1 0.55 0.75
Environment 0.22 0.27 0.55 1 0.61
MFA 0.72 0.77 0.75 0.61 1
Vegetation split into vascular plants and mosses, testate amoeba data as presence absence
Vascular 1 0.34 0.41 0.22 0.73
Mosses 0.34 1 0.48 0.27 0.77
Testate amoebae 0.41 0.48 1 0.52 0.79
Environment 0.22 0.27 0.52 1 0.59
MFA 0.73 0.77 0.79 0.59 1
Table 3 Correlations between groups of variables in the mul-tiple factor analysis (MFA) and between each group of variable and the global MFA model of vegetation, testate amoebae and environmental variables data from mires of Engadine (SE Switzerland)
Vegetation data is binary (pres-ence/absence), testate amoeba data is either percentage or binary, environmental data (wa-ter table depth and wa(wa-ter chem-istry) is quantitative
amoebae; significant in all cases but eight). On average, each of the five environmental variables explained a higher fraction of the testate amoeba data than of vegetation, vascular-plant, or moss data. The ranking among environ-mental variables varied among the analyses: depth to the water table explained the highest proportion of variance for vegetation and for vascular plants while pH explained the highest proportion of variance for mosses and testate amoebae. Ca was the second strongest variable for testate amoebae and the third for mosses, but it was weakest for vegetation and vascular plants. Correlations of either conductivity or Mg were weakest for all groups.
Variance partitioning between water table depth and water chemistry variables shows that between 2.1% and 6.0% of the taxon data were explained by DWT and water chemistry jointly (Table 5). Therefore, when the water chemistry data was used as a covariable, DWT explained only between 2.9% (for mosses) and 6.4% (testate amoebae percentages). Likewise, when the DWT data were used as a covariable, water chemistry explained only between 3.2% (vascular plants) and 17.9% (testate amoebae percentages). The shared variance ranged between 17.4% (mosses) and 25.2% (testate amoebae presence/absence) of the total variance explained by all biotic variables.
According to Table6, RDA variance partitioning among groups of variables showed that vascular plants had the lowest correlation with all other abiotic variables, followed by mosses, and topped by testate amoebae (higher for percentages than for presence/absence). DCA sample scores of mosses explained a higher fraction of testate amoebae than of vascular plants, while DCA sample scores of vascular plants explained a similar fraction of mosses and of testate amoebae. DCA sample scores of testate amoebae explained less of the variance of vascular plants than of mosses. The total variance explained by the combined environmental variables and two biotic sets of was lowest for vascular plants, intermediate for mosses and testate amoeba presence/absence data and highest for testate amoebae percentages.
Discussion
Mire Hydrology and Hydrochemistry
In our main study site Mauntschas mire, abundant plants indicative of minerotrophic conditions co-occur with
Table 4 Summary of RDA on vegetation, testate amoebae and environmental variables data from mires of Engadine (SE Switzerland): fraction of variance explained and significance of individual explanatory variables taken alone and by groups
Variable Vegetation Vascular plants Mosses Amoebae (1/0) Amoebae (%)
%a p value %a p value %a p value %a p value %a p value
Cond 2.9% 0.003 2.7% 0.006 3.4% 0.002 6.6% 0.001 9.6% 0.001
pH 5.7% 0.001 4.5% 0.001 8.5% 0.001 15.5% 0.001 20.4% 0.001
Mg 2.9% 0.001 2.3% 0.033 4.5% 0.001 7.6% 0.001 11.6% 0.001
Ca 3.5% 0.001 2.6% 0.010 5.5% 0.001 10.3% 0.001 14.9% 0.001
DWTb 7.5% 0.001 8.0% 0.001 6.5% 0.001 9.5% 0.001 13.6% 0.001
mos_1 n.a. 2.3% 0.029 n.a. 2.6% 0.023 4.1% 0.006
mos_2 n.a. 6.3% 0.001 n.a. 12.5% 0.001 15.8% 0.001
mos_3 n.a. 2.0% 0.074 n.a. 2.8% 0.013 3.7% 0.010
mos_4 n.a. 2.8% 0.003 n.a. 2.3% 0.035 2.2% 0.101
vas_1 n.a. n.a. 6.6% 0.001 9.1% 0.001 10.8% 0.001
vas_2 n.a. n.a. 3.5% 0.007 1.5% 0.343 1.3% 0.521
vas_3 n.a. n.a. 2.3% 0.004 2.5% 0.023 2.9% 0.030
vas_4 n.a. n.a. 3.8% 0.001 1.8% 0.136 1.4% 0.391
amo_1 6.7% 0.001 5.3% 0.001 9.9% 0.001 n.a. n.a.
amo_2 4.7% 0.001 5.7% 0.001 2.5% 0.024 n.a. n.a.
amo_3 2.3% 0.017 1.6% 0.248 3.7% 0.001 n.a. n.a.
amo_4 2.1% 0.041 2.1% 0.038 1.7% 0.231 n.a. n.a.
mos_x, vas_x, amo_x sample scores (axes 1–4) of detrended correspondence analysis of respectively moss, vascular plants and testate amoeba data used as explanatory variables in the RDA
aPercentage of variance explained (adjusted R2 bDepth to water table
ombrotrophic indicators such as S. fuscum [38]. Minero-trophy indicators dominate most of the mire surface, being absent only in some of the driest and highest parts. Some authors explained the presence of minerotrophic plants in Mauntschas mire by deposition of wind-blown dust trans-ported from non-forested areas above the tree line on an
otherwise rain-fed bog [39], but our field observations strongly suggest that minerotrophic groundwater and runoff influences the vegetation and thus we consider the mire as a minerotrophic fen [40]. Some other mires in this study are oligotrophic, and possibly ombrotrophic, also in their wetter parts.
Species data Variables Covariables Percenta p value
Vascular Abioticb n.a. 10.0% 0.001
Mossescand amoebaec 4.3%
Mossesc n.a. 8.1% 0.001
Abiotic and amoebaec 3.5% 0.002
Amoebaec n.a. 9.8% 0.001
Abiotic and mossesc 3.8%
Abioticb, mossescand Amoebaec n.a. 17.6% 0.001
Mosses Abioticb n.a. 13.4% 0.001
Vascularcand amoebaec 4.0%
Vascularc n.a. 11.6% 0.001
Abiotic and amoebaec 3.4%
Amoebaec n.a. 13.0% 0.001
Abiotic and vascularc 6.8% 0.002
Abioticb, vascularcand amoebaec n.a. 23.7% 0.001
Amoebae (1/0) Abioticb n.a. 19.5% 0.001
Vascularcand mossesc 7.3%
Vascularc n.a. 9.6% 0.001
Abiotic and mossesc 2.2%
Mossesc n.a. 14.4% 0.001
Abiotic and vascularc 2.9%
Abioticb, vascularcand mossesc n.a. 25.0% 0.001
Amoebae (%) Abioticb n.a. 30.3% 0.001
Vascularcand mossesc 13.5%
Vascularc n.a. 11.5% 0.001
Abiotic and mossesc 4.4% 0.024
Mossesc n.a. 19.8% 0.001
Abiotic and vascularc 1.5%
Abioticb, vascularcand mossesc n.a. 36.7% 0.001
Table 6 Summary of RDA on vascular plant (74 species), moss (ten Sphagnum, ten other species), testate amoeba and environmental variables data from mires of Engadine (SE Switzerland)
Variance partitioning of vascular plants, mosses or testate amoeba data using three sets of explan-atory variables: (1) abiotic vari-ables (depth to water table and water chemistry), (2) and (3) two of the three sets of biotic variables (amoeba, vascular plants and mosses), excluding self
1/0 presence-absence data, % percentage data
a
Percentage of variance exp-lained (adjusted R2)
b
Conductivity, pH, Mg, Ca, depth to water table
c
DCA sample scores on hellinger-transformed presence-absence data, axes 1–4
Table 5 Summary RDA on vegetation, testate amoebae and environmental variables data from mires of Engadine (SE Switzerland) Variables in RDA
model
Covariables Vegetation Vascular Mosses Amoebae (1/0) Amoebae (%)
%a p value %a p value %a p value %a p value %a p value Cond, pH, Mg, Ca DWT 4.8% 0.001 3.2% 0.001 8.2% 0.001 11.3% 0.001 17.9% 0.001
Shared 2.1% n.a. 2.0% n.a. 2.3% n.a. 4.9% n.a. 6.0% n.a.
DWT Cond, pH, Mg, Ca 4.1% 0.001 4.7% 0.001 2.9% 0.001 3.4% 0.001 6.4% 0.001 Cond, pH, Mg, Ca, DWT n.a. 11.0% 0.001 10.0% 0.001 13.4% 0.001 19.5% 0.001 30.3% 0.001 Unexplained variance 89.0% 90.0% 86.6% 80.5% 69.7%
Variance partitioning of vegetation (vascular plants + mosses) and testate amoeba data. Environmental variables used are either depth to water table (DWT), water chemistry or both
Species Richness Patterns
Patterns of taxon diversity clearly differed among the three groups of organisms studied. Testate amoebae had their highest diversity in rich fen. Extremely rich fens had a relatively low diversity of vascular plants and to some degree also of testate amoebae, but a high diversity of mosses. Our plot size (0.5 m2) is somewhat small for estimating the diversity of vascular plants in habitats where the plants are large and clonal such as in extremely rich fen, but it was the best compromise for this study as using a larger surface would have meant including different micro-habitats in the bog-end of the gradient (e.g. isolated hummocks as well as the surrounding brown moss lawns). Previous studies on plant diversity along the bog–fen gradient revealed a broad range of contrasting patterns including: highest plant diversity (vascular and mosses combined) in rich fens [41, 42], highest vascular plant diversity in rich fen [43], highest vascular plant diversity in moderately rich fen [44], no clear pattern for moss diversity (Vitt 1995 [43]), contrasting patterns of moss diversity versus pH within five peatland types [45] and lower diversity of vascular plants + mosses on frost mounds than in bogs and lawns [46] .
Not many studies exist on testate amoeba diversity along the poor–rich and surface-wetness gradients. Heal [22,23] conducted two such studies along the fen–bog gradient in the UK. In the first study of eight peatlands, Heal [22] recorded ca. 30 taxa on average in fen, but only 19 in bog. In the second study of six peatlands, Heal [23] recorded the highest testate amoeba diversity in fen (ca. 30), the lowest in bog hummocks (ca. 21) and intermediate diversity in bog pools (ca. 25). Mazei et al. [47] observed a strong effect of moisture on testate amoeba diversity in a Sphagnum bog: the diversity was lowest (3 taxa) in the driest habitat and higher in intermediately humid habitats (ca. 15). By contrast, Opravilova and Hajek [42] did not find any correlation between testate amoeba diversity and the poor– rich gradient.
Our results agree well with most of these observations, suggesting that Sphagnum peatlands, although an appropri-ate habitat for testappropri-ate amoebae, is not the habitat where their highest diversity is found. As a result of the contrasting patterns in our data, we observed a significant though not very strong correlation between moss and testate amoebae diversity across the full gradient from extremely rich fen to bog. The observations in literature quoted above fit in this pattern, but to our knowledge this relationship has not before been demonstrated in a single study. It may in this context be relevant that the testate amoebae/moss diversity correlation is in our data stronger than the moss/vascular plant diversity correlation. This suggests that testate amoebae and mosses depend on similar abiotic factors
and/or that biotic interactions between these two different functional groups shape their respective community struc-ture. The lower correlation of diversity between mosses and vascular plants is an indication that these two functional groups are influenced by partly different sets of environ-mental factors [48] and/or that the biotic interactions between them are weaker than between mosses and testate amoebae. A key factor must be the water and nutrient transport that is active in vascular plants but mainly passive in the other two groups. The observed patterns are in agreement with the influence of vertical trophic gradients on the structure of plant and microbial communities in mires [37]. Further discussion of these relationships in the light of RDA results follows below.
Ecological Gradients and Correlations Among Testate Amoebae, Vegetation, and Environmental Variables MFA confirmed the existence of a main ecological gradient and the validity of splitting this gradient into the four categories of extremely rich fen, rich fen, poor fen and bog. In direct gradient analysis (RDA) with single explanato-ry variables (Table 5), those showing the strongest correlation with taxon data were either DWT (with vegetation and with vascular plants) or pH (with mosses and with testate amoebae). Further, Ca was important for mosses and especially for testate amoebae. This study therefore agrees with numerous earlier studies in identify-ing pH and water table depth as important factors shapidentify-ing the structure or vascular plant and moss communities [43,
49–55]. For testate amoebae, water table depth is generally considered the most important, but stronger correlations with pH have also been reported [9,25].
Our results show that vascular plants and mosses respond differently to the hydrological and hydrochemical gradients (Tables4 and5). In the RDA on vegetation data (vascular plants and mosses combined), environmental variables explained only 11% of the variance. However, separate analyses resulted in an even lower correlation for vascular plants (10%) but a significantly higher correlation for mosses (13.4%). The ranking was also different: water table depth was more important for vascular plants, and pH for both mosses and for testate amoebae (see below). As in a previous study [37], Ca was more important for mosses than for vascular plants, in agreement with the role that Ca plays in the competition between brown-mosses and Sphagnum [56].
Mosses and vascular plants are affected by different sources of water even when they are growing together; mosses may experience ombrotrophic conditions at the mire surface while vascular plants still may have access to minerotrophic water deeper in the peat. This is clearly shown when we compare the results of this study to those
of Mitchell et al. [21]. In the latter, the water for chemistry measurement was collected close to the water table deeper in the peat, and the vascular plant data were more strongly correlated than the moss data to the water chemistry. In the present study, on the other hand, the water for chemistry measurement was extracted from the mosses themselves, and the correlation between the mosses and water chemistry was higher than between vascular plants and water chemistry. In agreement with these observations, Hajkova et al. [43] found in a study of a rich fen–bog gradient in the
Carpathian Mountains that in 84% of the sampling sites the pH was higher in groundwater than in water squeezed from mosses. They also found that the vascular plants were primarily related to groundwater chemistry and the mosses to the chemistry of the water squeezed from them. Kohzu et al. [57] found further evidence for this vertical gradient along a fen–bog gradient in Japan: stable isotopes provided clear differences in the15N content of twelve vascular plant species in relation to rooting depth, indicating that deeper-rooted plants access N from deeper peat layers. These different studies all illustrate the importance of vertical trophic gradients in peatlands and how this gradient leads to life-form niche separation.
The horizontal and vertical pH gradients in peatlands are also key component of ombrotrophication; autogenic succession can lead to development of Sphagnum hum-mocks and ultimately to raised-bog formation [58]. Once established, Sphagnum is able to modify the chemistry of surface water [8]. Consequently, rich fens with patchy Sphagnum-dominated vegetation are under mixed influence of allogenic cation input by water of high pH flowing in from the catchment and autogenic change by Sphagnum lowering the pH and cation concentrations. A rise in groundwater table would increase the minerotrophic influ-ence, favouring rich fen at the expense of ombrotrophic bog. Alternatively, during periods of lower groundwater the minerotrophic influence is also low, thus giving competitive advantage to Sphagnum and other bog species. Such patterns have repeatedly been observed in palaeoecological records [59–61].
Only few Sphagnum taxa such as Sphagnum Sect. Subsecunda and S. warnstorfii are able to survive under (moderately) mineral-rich conditions, whereas others, among which S. fuscum, need mineral-poor habitats [62]. It is therefore surprising that in several mires in the Upper Engadine S. fuscum seems to persist under a variable influence of minerals. The S. fuscum hummocks in Maun-tschas mire are surrounded by brown-moss lawn and locally even by Scorpidium scorpioides. Although the latter has been shown to occur in a variety of habitats depending on the biogeographical location [63], it is generally considered as indicative of Ca-rich water, and indeed in our Upper Engadin data set its optimum was at 60 mg/l Ca2+
(Lamentowicz et al., in preparation). S. fuscum hummocks may develop in rich fens and stratigraphic analyses of such “miniature bogs” reveal a sharp transition from rich fen to bog vegetation [64].
The next challenge will be to understand more precisely which factors control the different communities and what the underlying mechanisms are. This will on the one hand require more detailed descriptive studies including seasonal and spatial patterns, on the other hand manipulative experiments to test the effect of different variables aiming to avoid confounding factors such as covariation between water table depth and pH.
Acknowledgements We thank Ryszard Ochyra and Iwona Melosik for the identification of the mosses, Ralf Meisterfeld for help in the identification of some difficult testate amoeba taxa and Bertrand Fournier, Aurélie Thébault, François Gillet and Daniel Borcard for advice on numerical analyses. The study is part of the European Union project Millennium (SUSTDEV-2004-3.1.4.1). This research was further supported by the National Centre of Competence in Research (NCCR) on Climate, (Bern, Switzerland). Funding to EM by Swiss NSF project no. 205321-109709/1 and CCES projects RECORD and BigLink is kindly acknowledged. Further funding to ML by Foundation for Polish Science (FNP; Outgoing Fellowship KOLUMB) is acknowledged.
References
1. Gause GF (1934) The struggle for existence. Williams & Wilkins, Baltimore
2. Wardle DA (2006) The influence of biotic interactions on soil biodiversity. Ecol Lett 9:870–886
3. Wilkinson DM (1998) Fragments of an entangled bank: do ecologists study most of ecology? Oikos 82:393–394
4. Wardle DA (2002) Communities and ecosystems: linking the aboveground and belowground components. Princeton University Press, Princeton
5. Bridgham SD, Pastor J, Janssens JA, Chapin C, Malterer TJ (1996) Multiple limiting gradients in peatlands: a call for a new paradigm. Wetlands 16:45–65
6. Wheeler BD, Proctor MCF (2000) Ecological gradients, subdivi-sions and terminology of north-west European mires. J Ecology 88:187–203
7. Mitchell EAD, Borcard D, Buttler AJ, Grosvernier P, Gilbert D, Gobat JM (2000) Horizontal distribution patterns of testate amoebae (Protozoa) in a Sphagnum magellanicum carpet. Microb Ecol 39:290–300
8. Clymo RS (1963) Ion exchange in Sphagnum and its relation to bog ecology. Ann Bot 27:309–324
9. Mitchell E, Charman D, Warner B (2008) Testate amoebae analysis in ecological and paleoecological studies of wetlands: past, present and future. Biodivers Conserv 17:2115–2137 10. Foissner W (1997) Protozoa as bioindicators in agroecosystems,
with emphasis on farming practices, biocides, and biodiversity. Agric Ecosyst Environ 62:93–103
11. Schröter D, Wolters V, De Ruiter PC (2003) C and N mineralisa-tion in the decomposer food webs of a European forest transect. Oikos 102:294–308
12. Aoki Y, Hoshino M, Matsubara T (2007) Silica and testate amoebae in a soil under pine–oak forest. Geoderma 142:29–35
13. Wilkinson DM (2008) Testate amoebae and nutrient cycling: peering into the black box of soil ecology. Trends Ecol Evol 23:596–599
14. Lavoie C, Zimmermann C, Pellerin S (2001) Peatland restoration in southern Quebec (Canada): a paleoecological perspective. Ecoscience 8:247–258
15. Laggoun-Défarge F, Mitchell EAD, Gilbert D, Disnar J-R, Comont L, Warner B, Buttler A (2008) Cutover peatland regeneration assessment using organic matter and microbial indicators (bacteria and testate amoebae). J Appl Ecol 45:716– 727
16. Charman DJ (2001) Biostratigraphic and palaeoenvironmental applications of testate amoebae. Quat Sci Rev 20:1753–1764 17. Opravilova V, Hajek M (2006) The variation of testacean
assemblages (Rhizopoda) along the complete base-richness gradient in fens: a case study from the Western Carpathians. Acta Protozoologica 45:191–204
18. Mazei YA, Tsyganov AN, Bubnova OA (2007) Structure of a community of testate amoebae in a Sphagnum dominated bog in upper sura flow (Middle Volga Territory). Biol Bull 34:382–394 19. Booth RK, Sullivan ME, Sousa VA (2008) Ecology of testate
amoebae in a North Carolina pocosin and their potential use as environmental and paleoenvironmental indicators. Ecoscience 15:277–289
20. Tolonen K, Warner BG, Vasander H (1992) Ecology of Testaceans (Protozoa: Rhizopoda) in mires in southern Finland: I. Autecol-ogy. Arch Protistenkd 142:119–138
21. Mitchell EAD, Buttler A, Grosvernier P, Rydin H, Albinsson C, Geenup AL, Heijmans MMPD, Hoosbeek MR, Saarinen T (2000) Relationships among testate amoebae (Protozoa), vegetation and water chemistry in five Sphagnum-dominated peatlands in Europe. New Phytol 145:95–106
22. Heal WO (1961) The distribution of testate amoebae (Rhizopoda: Testacea) in some fens and bogs in northern England. J Linn Soc, Zool 44:369–382
23. Heal WO (1964) Observations of the seasonal and spatial distribution of testacea (Protozoa: Rhizopoda) in Sphagnum. J Anim Ecol 33:395–412
24. Lamentowicz M, Mitchell EAD (2005) The ecology of testate amoebae (Protists) in Sphagnum in north-western Poland in relation to peatland ecology. Microb Ecol 50:48–63
25. Mitchell EAD, Buttler AJ, Warner BG, Gobat JM (1999) Ecology of testate amoebae (Protozoa: Rhizopoda) in Sphagnum peatlands in the Jura mountains, Switzerland and France. Ecoscience 6:565– 576
26. Lauber K, Wagner G (2007) Flora helvetica. Paul Haupt, Bern 27. Ochyra R, Żarnowiec J, Bednarek-Ochyra H (2003) Census
catalogue of Polish mosses. W. Szafer Institute of Botany, Polish Academy of Sciences, Krakow
28. Hermanowicz W, Dożańska W, Dojlido J, Koziorowski B (1999) Fizyczno-chemiczne badania wody iścieków. Arkady, Warszawa 29. Grospietsch T (1958) Wechseltierchen (Rhizopoden). Kosmos
Verlag, Stuttgart
30. Ogden CG, Hedley RH (1980) An Atlas of Freshwater Testate Amoebae. Oxford University Press, London
31. Clarke KJ (2003) Guide to identification of soil protozoa—testate amoebae. Freshwater Biological Association, Ambleside, U.K 32. Thompson R, Kamenik C, Schmidt R, Pla S, Rieradevall M,
Catalan J (2008) Testing a new multigroup inference approach to reconstructing past environmental conditions. J Limnol 67:155– 162
33. Escofier B, Pagès J (1994) Multiple factor analysis. Comput Stat Data Anal 18:121–140
34. Rao CR (1995) A review of canonical coordinates and an alternative to correspondence analysis using Hellinger distance. Qüestiió 19:23–63
35. Borcard D, Legendre P, Drapeau P (1992) Partialling out the spatial component of ecological variation. Ecology 73:1045–1055 36. Peres-Neto P, Legendre P, Dray S, Borcard D (2006) Variation partitioning of species data matrices: estimation and comparison of fractions. Ecology 87:2614–2625
37. Mitchell EAD, Buttler A, Grosvernier P, Rydin H, Albinsson C, Greenup AL, Heijmans MMPD, Hoosbeek MR, Saarinen T (2000) Relationships among testate amoebae (Protozoa), vegeta-tion and water chemistry in five Sphagnum-dominated peatlands in Europe. New Phytol 145:95–106
38. Grunig A (1994) Mires and man: mire conservation in a densely populated country—the Swiss experience. Excursion guide and proceedings of the symposium of the International Mire Conser-vation Group (IMCG), Switzerland, 1992. Mires and man: mire conservation in a densely populated country—the Swiss experi-ence Excursion guide and proceedings of the symposium of the International Mire Conservation Group (IMCG), Switzerland, 1992
39. Held T, Wortmann M (1994) Unappreciated by the cross-country skiers - the outstanding mires in the famous Upper Engandine. Birmensdorf: Swiss Federal Institute of Forest, Snow and Landscape Research. In: Grünig, A (ed) Mires and Man Mire conservation in a densely populated country—the Swiss experi-ence Excursion guide and symposium proceedings of the 5th field symposium of the international mire conservation group (IMCG), Switzerland 1992, pp. 218–233
40. Lamentowicz M, Van der Knaap P, Lamentowicz Ł, Van
Leeuwen JFN, Mitchell EAD, Goslar T, Kamenik C (2009) A near-annual palaeohydrological study based on testate amoebae from an Alpine mire: surface wetness and the role of climate during the instrumental period. J Quat Sci (in press)
41. Glaser PH, Janssens JA, Siegel DI (1990) The response of vegetation to chemical and hydrological gradients in the lost river peatland, Northern Minnesota. J Ecol 78:1021–1048
42. Hájek M, Horsák M, Hájkova P, Dítě D (2006) Habitat diversity of central European fens in relation to environmental gradients and an effort to standardise fen terminology in ecological studies. Perspect Plant Ecol Evol Syst 8:97–114
43. Hájkova P, Wolf P, Hajek M (2004) Environmental factors and Carpathian spring fen vegetation: the importance of scale and temporal variation. Ann Bot Fenn 41:249–262
44. Vitt DH (1990) Growth and production dynamics of boreal mosses over climatic, chemical and topographic gradients. Bot J Linn Soc 104:35–59
45. Vitt DH, Li YH, Belland RJ (1995) Patterns of bryophyte diversity in peatlands of continental Western Canada. Bryologist 98:218–227
46. Beilman DW (2001) Plant community and diversity change due to localized permafrost dynamics in bogs of western Canada. Can J Bot 79:983–993
47. Mazei YA, Bubnova OA (2007) Species composition and structure of testate amoebae community in a Sphagnum bog at the initial stage of its formation. Biol Bull 34:619–628
48. Bragazza L, Gerdol R (2002) Are nutrient availability and acidity-alkalinity gradients related in Sphagnum-dominated peatlands? J Veg Sci 13:473–482
49. Vitt DH, Slack NG (1984) Niche diversification of Sphagnum relative to environmental factors in northern Minnesota peatlands. Can J Bot 62:1409–1430
50. Vitt DH, Chee W-L (1990) The relationships of vegetation to surface water chemistry and peat chemistry in fens of Alberta, Canada. Vegetatio 89:87–106
51. Bragazza L (1997) Sphagnum niche diversification in two oligotrophic mires in the southern Alps of Italy. Bryologist 100:507–515
52. Bragazza L, Gerdol R (1999) Hydrology, groundwater chemistry and peat chemistry in relation to habitat conditions in a mire on the South-eastern Alps of Italy. Plant Ecol 144:243–256 53. Andrus RE (1986) Some aspects of Sphagnum ecology. Can J Bot
64:416–426
54. Hájek M, Hekera P, Hájková P (2002) Spring fen vegetation and water chemistry in the Western Carpathian flysch zone. Folia Geobot 37:205–224
55. Navratil J, Navratilova J, Hajek M (2006) Relationships between environmental factors and vegetation in nutrient-enriched fens at fishponds margins. Folia Geobot 41:353–376
56. Malmer N, Horton DG, Vitt DH (1992) Element concentrations in mosses and surface waters of western Canadian mires relative to precipitation chemistry and hydrology. Ecography 15:114–128 57. Kohzu A, Matsui K, Yamada T, Sugimoto A, Fujita N (2003)
Significance of rooting depth in mire plants: Evidence from natural (15) N abundance. Ecol Res 18:257–266
58. Hughes PDM, Barber KE (2003) Mire development across the fen-bog transition on the Teifi floodplain at Tregaron Bog,
Ceredigion, Wales, and a comparison with 13 other raised bogs. J Ecol 91:253–264
59. Vitt DH (1994) An overview of factors that influence the development of Canadian peatlands. Mem Entomol Soc Can 169:7–20
60. van der Linden M, Barke J, Vickery E, Charman DJ, van Geel B (2008) Late Holocene human impact and climate change recorded in a North Swedish peat deposit. Palaeogeogr Palaeoclimatol Palaeoecol 258:1–27
61. Kuhry P, Nicholson BJ, Gignac LD, Vitt DH, Bayley SE (1993) Development of Sphagnum dominated peatlands in boreal continental Canada. Can J Bot 71:10–22
62. Daniels RE, Eddy A (1985) Handbook of European Sphagna. HMSO, London
63. Vitt DH, van Wirdum G, Halsey L, Zoltai S (1993) The effects of water chemistry on the growth of Scorpidium scorpioides in Canada and the Netherlands. Bryologist 96:106–111
64. Bellamy JD, Rieley J (1967) Some ecological statistics of a “miniature bog”. Oikos 18:33–40