REVIEWS OF INFECTIOUS DISEASES • VOL. 12, NO. I • JANUARY-FEBRUARY 1990 ©1990 by The University of Chicago. All rights reserved. 0612-0882/90/1201-0029$02.00
Global Genetic Structure and Molecular Epidemiology of Encapsulated
Haemophilus influenzae
James M. Musser;" J. Simon Kroll, Dan M. Granoff, E. Richard Moxon, Bernard R. Brodeur,
Jose Campos, Henri Dabernat, Wilhelm Frederiksen, Josee Hamel, Gregory Hammond, E. Arne Hf'iby, Kristin E. Jonsdottir, Mustafa Kabeer,
Ingegerd Kallings, Waheed N. Khan, Mogens Kilian, Kathleen Knowles, H. J. Koornhof, Barbara Law, Karl I. Li, Janet Montgomery, Patricia E. Pattison, Jean-Claude Piffaretti, Aino K. Takala,
Mee Len Thong, Robert A. Wall, Joel I. Ward, and Robert K. Selander
From the Department of Biology, Mueller Laboratory, Pennyslvania State University, University Park,' Infectious
Disease Unit, Department of Paediatrics, John Radcliffe Hospital, Headington, Oxford,' Edward Mallinckrodt Department of Pediatrics, Washington University School of Medicine, St. Louis; Hybridoma Section, Bureau of Microbiology, Laboratory Centre for Disease Con trot Health
and Welfare Canada, Ottawa,' Departments of Microbiology and Pediatrics, Hospital Infantil San Juan de Dios, Barcelona,' Laboratoire Central de Microbiologie,C H. U Toulouse Purpan; Toulouse; Statens Seruminstitut, Copenhagen,' Cadham Provincial Laboratory, Winnipeg,' National Institute of Public Health, Oslo; Department of Bacteriology, University of Iceland, Reykjavik,' The National Bacteriology Laboratory, Stockholm,' Children's Hospital National Medical Center, Washington,nc;Department of Oral Biology, Royal Dental College, Aarhus; Montreal Children's Hospital; Montreat' South African Institute for Medical Research, Johannesburg; Department of Pediatrics and Child Health, University of Manitoba, Winnipeg,' Children's Hospital of Pittsburgh, Pennsylvania,' Papua New Guinea Institute of Medical Research, Goroka;Instituto Cantonale Batteriosierologico: Lugano; National Public Health Institute, Helsinki; Division oj Microbiology, Department oj Pathology, North Brisbane Hospitals Board, Brisbane; Medical Research Council Laboratories, Faraja; Department oj Pediatrics, Harbor-UCLA Medical Center, University oj California, Los Angeles
A collection of 2,209 isolates of six polysaccharide capsule types ofHaemophi/us
influen-zoe, including 1,975 serotype b isolates recovered in 30 countries was characterized for electrophoretically demonstrable allele profiles at 17 metabolic enzyme loci. Two hun-dred eighty distinct multilocus genotypes were distinguished, and cluster analysis revealed two primary phylogenetic divisions. The population structure of encapsulatedH.influenzae
is clonal. Currently, most of the invasive disease worldwide is caused by serotype b strains of nine clones, Strains producing serotypec,e,and f capsules belong to single divisions and have no close genetic relationships to strains of other serotypes, Serotype a and b strains occur in both primary phylogenetic divisions, probably as a result of transfer and recombination of serotype-specific sequences of thecapregion between clonal lineages. A close genetic relatedness between serotype d isolates and some strains of serotypes a and b was identified, There are strong patterns of geographic variation, on an intercon-tinental scale, in both the extent of genetic diversity and the clonal composition of popu-lations of encapsulated strains, The analysis suggests that the present distribution of clones is, in part, related to patterns of racial or ethnic differentiation and historical demographic movements of the human host populations.
Receivedfor publication 22 February 1989and in revised form 13 June 1989.
Research leading to this review was supported by grant no. AI24332 from the National Institute of Allergy and Infectious Diseases (to R. K. S. and D. M, G.), by contract AID-2429-8-312 from the Board on Science and Technology for International De-velopment (BOSTID), National Research Council (to D. M. G.), by a Program Grant from the Medical Research Council, U.K. (to E. R. M.), and by grant 8S.3.16.8.E from the Caisse Nation-ale d'Assurances Maladie des Travailleurs Salaries (to H. D.). J. S. K. is a Lister Institute Research Fellow.
7S
This paper is dedicated to Dr. Margaret Pittman.
C. M. Sommers and L. M. Tremblay provided technical as-sistance.The authors thank T. S. Whittam for help with data anal-ysis. The senior author thanks K. A. Zeznick for extensive en-couragement.
• Present affiliation: Department of Pathology and Labora-tory Medicine, Hospital of the University of Pennsylvania, Philadelphia, Pennsylvania.
Please address request for reprints to Dr. Robert K. Selander, Department of Biology, Mueller Laboratory, Pennsylvania State University, University Park, Pennsylvania 16802.
76
Encapsulated strains ofHaemophilus influenzaeare a major cause of meningitis and other serious in-vasive diseases, including septicemia, obstructive epiglottitis, cellulitis, and septic arthritis, in young children in many parts of the world [1-3]. Because of their great public health importance, encapsulated strains, especially those expressing the serotype b polysaccharide, have been the subject of intensive research in the United States and Europe during the past 10 years. Early immunologic and metabolic studies demonstrated heterogeneity among strains [4-6], but attempts to understand the epidemiology of disease caused by encapsulated organisms initially were hindered by the lack of high-resolution, stable genetic marker systems for strain discrimination and classification.
Early in the present decade, techniques were de-veloped for classifying serotype b isolates on the basis of variation in the electrophoretic mobility patterns of the major outer-membrane proteins (OMPs) [7-10] and lipopolysaccharide [11, 12], serologic di-versity in lipopolysaccharide antigens [9, 13, 14], and other phenotypic characters [15-17]. An examina-tion of 51 serotype b isolates recovered from chil-dren in St. Louis with invasive infections identified nine distinctive OMP pattern subtypes and demon-strated that five subtypes, designated as IH, lL, 2H, 2L, and 3L, accounted for 9211,70 of the strains [18]. In a survey of 256 invasive isolates from a variety of clinical settings in 22 states in the United States, Granoff et al. [19] distinguished 21 OMP subtypes and discovered that about 70% of cases were caused by strains of three subtypes (IH, 2L, and 3L). Sub-sequently, van Alphen et al, [9] examined 80 isolates from invasive infections in the Netherlands where, in striking contrast to those in the United States, 8411,70 of isolates had the same OMP pattern (type 1; sub-type 3L in the Granoff laboratory system); moreover, no strains of IH, lL, or 2H were identified.
In an effort to measure genetic diversity and evolu-tionary genomic relationships among serotype b iso-lates classified by OMP type and biotype, Musser et al. [20] analyzed genetically determined elec-trophoretic variation in 16metabolic enzymes in 177 isolates from the United States. They identified 32 distinctive multilocus enzyme genotypes (electro-phoretic types, ETs) [20] and determined that 7311,70 of invasive disease episodes were caused by strains of only three ETs. This work also demonstrated that serotype b capsule is expressed in strains belonging
Musser et al.
to four rather distantly related groups of chro-mosomal genotypes, each of which is associated with a characteristic set of OMP patterns [20]. To explain the occurrence of strong nonrandom associations of multilocus enzyme genotype, OMP subtype, and bio-type, and the repeated recovery of isolates with iden-tical properties in widely separated geographic regions and over a 40-year period, researchers hy-pothesized [20] and subsequently confirmed [21,22] that the structure of natural populations of serotype bH.influenzaeis basically clonal as a consequence of infrequent recombination of chromosomal genes. Two important characteristics of the epidemiol-ogy of serotype bH. influenzaewere identified in these studies. First, although there is extensive genetic diversity among strains expressing type b capsule, most disease is caused by a very small number of clonal chromosomal genotypes, which are marked by ETs. Second, comparison of results from studies in the United States and the Netherlands suggested the existence of strong patterns of geographic vari-ation, on an intercontinental scale, in both the ex-tent of genetic diversity and the clonal composition of populations.
Little is known about the genetics of populations ofH. influenzaein areas of the world other than the United States and western Europe [23]. To study genetic structure and molecular epidemiology on a global scale, we assembled a large collection of en-capsulatedH. influenzaestrains recovered in many countries over the past 40 years. One objective was to generate baseline data that would permit prospec-tive assessment of the effects of vaccination on the genetic diversity and structure of populations of in-vasive and carrier strains. Additionally, we wanted to examine possible correlations between patterns of geographic variation in genetic diversity and clonal composition of the serotype b populations and patterns of human racial/ethnic differentiation and historical demographic movement. For im-munoprophylactic research, development, and ap-plication, it may be important to understand the global clone distribution of type b strains.
We here present a comprehensive analysis of the genetic structure and molecular epidemiology of en-capsulated H. influenzae, based on 2,209 isolates from six continents. The population genetic analysis is based primarily on electrophoresis of 17 chro-mosomally encoded metabolic enzymes, with addi-tional information being supplied by OMP
subtyp-Global Population Structure ojH.influenzae
ing [8, 24, 25] and the restriction fragment length polymorphism (RFLP) pattern of the capregion [24, 26].
Materials and Methods Bacterial Isolates
A collection of 2,209 isolates of encapsulatedH. in-fluenzaerecovered from individuals in 30 countries on six continents was examined (table 1). The sam-ple includes 52 isolates of serotype a, 1,975 of sero-type b, 13of serosero-typeC,27 of serotype d, 92 of
sero-type e, and 50 of serosero-type f. Of the serosero-type b strains, 1,814were cultured from blood, cerebrospinal fluid, or other normally sterile body fluid, 91 from the nasopharynx of healthy individuals, 54 from severe lower respiratory tract infections (predominantly in Malaysia), and six from the eyesof patients with con-junctivitis. Most isolates of other serotypes were re-covered from asymptomatic carriers or from patients with surface infections. However, 11 isolates of sero-type a, six of serosero-type f, and two each of serosero-types d and e were cultured from patients with invasive in-fections. The collection includes 24 isolates obtained between 1939and 1954 [27], but most of the isolates were recovered between 1965 and 1987.
Of the carrier isolates, 46 were recovered from as-sociated children in three day care centers in Spain [28], 10 were from Amerinds living on the Fort Apache Indian Reservation in Arizona, 20 were from Alaskan Natives in a variety of areas in the state, nine were from associated South Korean children taken to Norway for adoption, and six were from unknown sources in the United States and Canada. Most isolates were obtained from a collection as-sembled by the senior author and from collections maintained by the coauthors. In addition, the fol-lowing individuals each supplied a small number of isolates: J. O. Achola, University of Nairobi, Kenya; M. Arpi, Statens Seruminstitut, Copenhagen, Den-mark; M. Catalano, National Research Council, Buenos Aires, Argentina; B. W. Catlin, Medical Col-lege of Wisconsin, Milwaukee, Wisconsin; P. D. Ell-ner, Columbia-Presbyterian Medical Center, New York, New York; R. J. Fallon, Ruchill Hospital, Glas-gow, Scotland; P. Fleming, Hospital for Sick Chil-dren, Toronto, Ontario, Canada; E. J. Hansen, Uni-versity of Texas Health Science Center, Dallas, Texas; H. Heffernan, National Health Institute,
Welling-77
ton, New Zealand; T. Konda, National Institute of Health, Tokyo, Japan; J. Levy, Rochester General Hospital, Rochester, New York; M. Loeb, Univer-sity of Rochester School of Medicine and Dentis-try, Rochester, New York; M. Magdasy, Central Pub-lic Health Laboratory, Montevideo, Uruguay; K. McGowan, St. Christopher's Hospital, Philadelphia, Pennsylvania; T. Oguri, Juntendo University, Tokyo, Japan; S. J. Oppenheimer, Hospital Universiti Sains Malaysia, Kelantan, Malaysia; T. H. Pennington, University of Aberdeen, Scotland; C. A. Reichart, Johns Hopkins Medical Institutions, Baltimore, Maryland; S. H. Sell, Vanderbilt University Medi-cal School, Nashville, Tennessee; A.L.Smith, Chil-dren's Orthopedic Hospital and Medical Center, Seattle, Washington; M. Soraekit, Mahidal Univer-sity, Thailand; J. Spainhour, Children's Hospital of Philadelphia, Philadelphia, Pennyslvania; ,Y. Ter-awaki, Shinshu University School of Medicine, Mat-sumoto, Japan; T. Tupasi, Makati Medical Center, Philippines; M. K. Wagner, Kapiolani Women's and Children's Medical Center, Honolulu, Hawaii; L. B. Weiner, Upstate Medical Center, Syracuse, New York; and R. Yogev, Children's Memorial Hospital, Chicago, Illinois.
Electrophoresis of Enzymes
Isolates were grown overnight at 37°C in 150 mL of brain-heart infusion broth (Difco; Detroit, Mich.), supplemented with NAD and hemin, each at 2 mg/ mL. Cells were harvested by centrifugation, sus-pended in 2 mL of 50mM Tris-hydrochloride, pH
8.0, containing 5mM EDTA, and sonicated
(Bran-son Sonifier Cell Disruptor, model 200, with micro-tip; Danbury, Conn.) for 30 seconds at 50070 pulse, with ice-bath cooling. After centrifugation at 20,000
x
g for 20 minutes at 4°C, the clear supernatant(lysate) was stored at -70°C.
Techniques of horizontal starch-gel electrophore-sis and the demonstration of specific enzyme activ-ity were similar to those described elsewhere [20, 29, 30]. The 17 enzymes assayed were carbamylate ki-nase (CAK), nucleoside phosphorylase (NSP), phos-phoglucose isomerase (PGI), malic enzyme (MAE), malate dehydrogenase (MDH), glucose-6-phosphate dehydrogenase (G6P), glutamic oxaloacetic transam-inase (GOT), adenylate ktransam-inase (ADK), 6-phospho-gluconate dehydrogenase (6PG), leucylalanine pep-tidase 1 (PEl), leucylalanine peppep-tidase 2 (PE2),
78 Musser et al.
Table 1. Composition of the sample of encapsulated H. influenzae, groupedby geographic source.
No. of No. of No. of No. of
isolates ETs isolates ETs
Sero- Sero- Sero-
Sero-Collection type type Collection type type
Geographic source period b Other b Other Geographic source period b Other b Other
"North America 936 104 Africa 93 27
Canada 1969-1986 376a 40 The Gambia 1983-1984 30m 5 6 2
United States 1939-1954, Ghana 1983-1984 5 3
1968-1987 560b 12 77 10 Kenya 1980s 10 9 4 8
Europe 623 60 Rep. of South Africa 1984-1986 48n 18
Denmark- 1940-1942, Papua New Guinea 1980-1985 60 4 9 4
1980-1986 46 18 Other 143 29
England 1983-1985 21 149 8 52 Argentina 1986 40 2
Finland 1985 l00d 12 Australia 1984-1986 40p 10
France 1980s 77e 10 Guatemala 1986 1 1
Iceland 1977-1986 40£ 6 Hawaii 1985-1986 22 11
The Netherlands 1975-1982 8 4 Mexico 1986 lq 1
Norway 1980-1985 39 11 New Zealand 1985-1986 19r 5
Scotland 1983-1986 20 7 Dominican Republic 1980 55 2 14 2
Spain 1980s 71g 3 Uruguay 1986 1s 1 Sweden 1982-1986 78h 13 Unknown 14 8 Switzerland 1982-1986 123i 18 Asia 120 17 Total 1,975 234 182 98 Japan 1981-1985 12j 3 Malaysia 1971-1979 80k 39 11 19 Philippines 1986 9 4 South Korea 1985 9\ 3 Thailand 1986 10 4
aAlberta (26), Ontario (81), Quebec (84), Manitoba (145), New Brunswick (6), Prince Edward Island (26), and British Columbia (8). bAlabama (1), Alaska (88), Arizona (34), California (1), Colorado (2), Florida (1), Illinois (11), Indiana (1), Louisiana (1), Maryland (31), Massachusetts (1), Minnesota (45), Missouri (7), New York (78), North Carolina (2), Oklahoma (52), Pennsylvania (136), Rhode Island (1), Tennessee (13), Texas (27), Washington, D.C. (1), Washington state (10), Wisconsin (16), Hawaii excluded.
CIncludes Greenland.
dEspoo (1), Helsinki (19), Joensuu (9), Jyvaskyla (6), Kajaani (1), Kemi (1), Kokkola (3), Kotka (2), Kuopio (9), Lappeenranta (3), Oulu (18), Pori (3), Porvoo (1), Rovaniemi (2), Savonlinna (2), Tammisaari (2), Turku (7), EPKS (6), PHKS (2), VAKS (1), and unknown (2).
eAix en Provence (3), Bordeux (2), Clermont Ferrand (3), Colombes (1), Compiegne (2), Creteil (10), Le Mans (2), Longjumeau (2), Mulhouse (2), Nantes (2), Nice (2), Reims (5), Rennes (3), Strasbourg (11), Toulouse (21), Versailles (4), and Villeneuve Saint Georges (2). fAkureyri (3), Breiddalsvik (1), Budardalur (1), Djupivogur (1), Egilsstadir (1), Eskifjordur (1), Gardabaer (1), Hafnarfjordur (1), Husavik (1), Keflavik (2), Keflavik (U.S.) naval base (1), Kopavogur (2), Reykjavik (23), and Vestmannaeyjar (1).
g Barcelona area (47), Catalonia (18), northern Spain (3), southern Spain (3).
hBoden (1), Eskilstuna (4), Galve (1), Jonkoping (28), Kalmar (2), Karlskrona (1), Linkoping (2), Norrkoping (2), Skovde (3), Stock-holm (19), Umea (1), Vasteras (4), Vastervik (2), Vaxdo (2), Visby (3), and unknown (3).
iBern (24), Geneva (55), Lausanne (15), Lugano (1), San Gall (16), Winterthur (2), Zurich (10). j Matsumoto (7), Tokyo (5).
kKuala Lumpur.
IIsolated from nose or throat of adopted South Korean children minutes after arrival at Fornebu Airport, Oslo, Norway. mMany areas throughout the country.
nCape Town (7), Durban (2), Johannesburg (32), unknown (7).
oBuenos Aires.
pBrisbane (38), Melbourne (2).
qMexico City.
rAuckland (7), Christchurch (1), Hastings (4), Nelson (1), Palmerston North (2), Taumarunui (1), Wellington (2), Whakatane (1). SMontevideo.
Global Population Structure ofH. influenzae
leucine aminopeptidase (LAP), phosphoglucomu-tase (PGM), catalase (CAT), glutamate genase (GLD), glyceraldehyde-3-phosphate dehydro-genase (G3P), and fumarase (FUM).
Electromorphs (allozymes) of each enzyme were equated with alleles at the corresponding structural gene locus, and distinctive combinations of alleles over the 17 enzyme loci, representing multilocus chromosomal genotypes, were designated as elec-trophoretic types (ETs) [30].
Serotyping
Serotypes were determined by slide agglutination with serotype-specific sera or by the antiserum agar method. Strains of serotype b that were of ETs not previously identified [20, 29] were reserotyped in the laboratory of D. M. G. by countercurrent immuno-electrophoresis with specific type b rabbit antisera, prepared under contract for the Institute of Medi-cine. Isolates with multilocus enzyme genotypes that were very different from those of other isolates of the same serotype were reserotyped and tested for capregion pattern in the laboratory of E. R. M. Electrophoresis of OMPs
Isolates of serotype a were typed previously for OMP pattern by Allan et al. [25]. Some serotype b isolates also were typed previously [24] and the OMP pat-terns of additional serotype b isolates were deter-mined in the laboratories ofJ.I. W., E. R. M., and K.I. L. by the methods of Barenkamp et aI. [8] or Loeb et al. [7], with standards supplied by D. M. G. In brief, electrophoresis was performed on detergent-soluble outer-membrane derivatives in an8070-17.5%
Laemmli linear gradient polyacrylamide gel system [31]. The serotype a isolates were assigned to cate-gories on the basis of the gradient gel results and were further classified as H, L, or U, depending upon the electrophoretic mobility of a heat-modifiable protein (PI, with an apparent molecular mass of ""45,000 [25]) on 11070acrylamide gels [32]. For sero-type b strains, the heat-modifiable protein PI has three electrophoretic variants, designated H (50 kDa), L (49 kDa), and U «49 kDa), based on mo-bility in the Laemmli gel system. Because a detailed comparison of the OMP patterns of serotype a and serotype b strains was not made, pattern designa-tions are not necessarily cognate between serotypes.
79
RFLP Analysis of thecapRegion
Isolates were typed forcapregion RFLP pattern by the methods described elsewhere [24, 26]. Briefly, chromosomal DNA was digested with restriction en-donucleaseEcoRI, and fragments were resolved ac-cording to size on agarose gels, transferred to ni-trocellulose filters, and probed with radiolabeled pU038, a cloned fragment of serotype bH.
influen-zoe
chromosomal DNA carrying genes involved in capsule synthesis [33]. The hybridization pattern was visualized by autoradiography. Strains were selected to include ETs representing the breadth of genotypic diversity and geographic origin in each of the major lineages of encapsulatedH. influenzae.Statistical Analysis
Genetic diversity at an enzyme locus among ETs or isolateswascalculated ash = (1 - l:xt)[n/(n - 1)], whereXi is the frequency of the ith allele andnis
the number of ETs or isolates in a sample [34]. Mean genetic diversity (ll) is the arithmetic average ofh
values for all loci.
Genetic distance between pairs of ETs was ex-pressed as the proportion of enzyme loci at which different alleles were represented (mismatches), and clustering of ETs was performed from a matrix of pairwise genetic distances by the average-linkage method [30, 35].
Results
Genetic and Genotypic Diversity
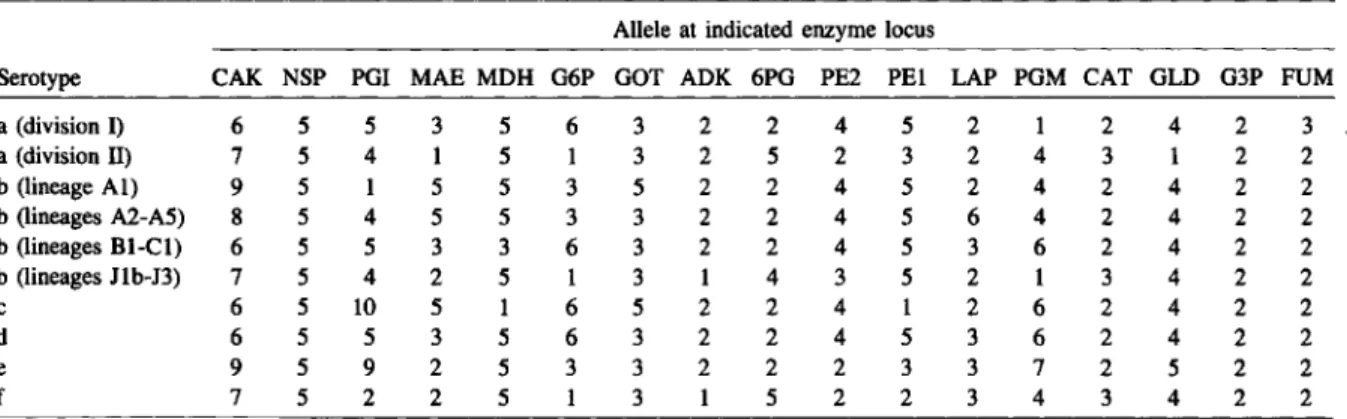
All 17 enzyme loci assayed were polymorphic for from three (G3P) to 11 (PGI) alleles encoding elec-trophoretically distinctive variants, with an average of 6.4 alleles per locus. The failure of extracts of some isolates to show activity for one or two enzymes was attributed to the presence of null alleles, the highest frequency of which occurred at the NSP locus (2.8% of the isolates). A total of 280 distinctive multilocus genotypes (ETs) was identified (table 2), among which mean genetic diversity per locus (ll) was 0.467 (table 3). Most ETs (63%) were represented by sin-gle isolates, but 103 ETs (37%) had multiple isolates (range, 2-497 isolates). The number ofETs per sero-type ranged from seven for serosero-type d isolates to 182 for serotype b isolates. There was no sharing of ETs between serotypes.
80 Musser et of.
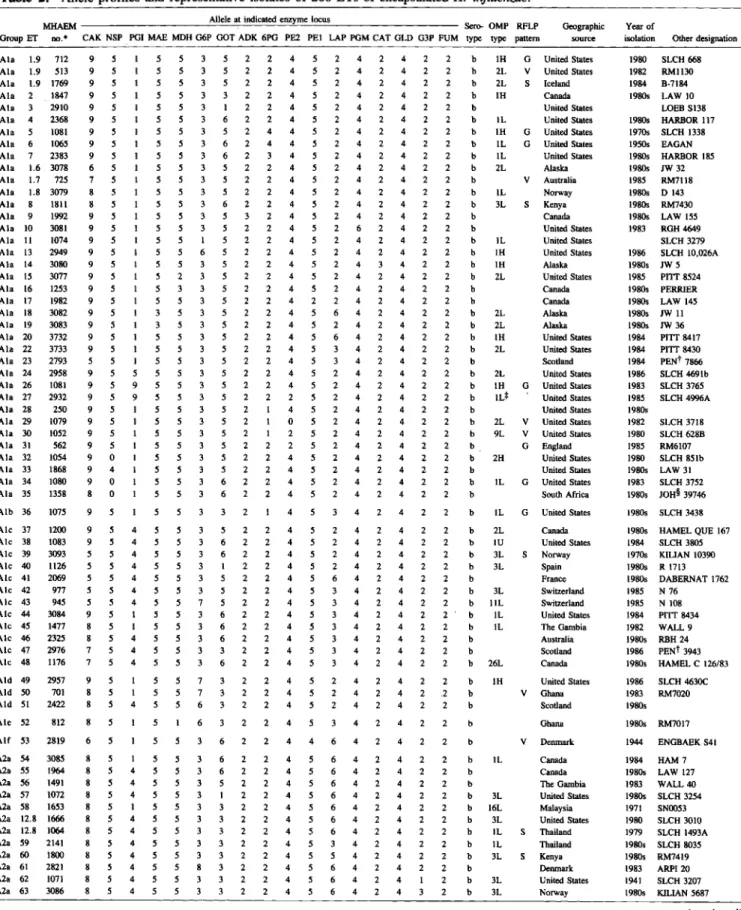
Table 2. Allele profiles and representative isolates of 280 ETs of encapsulatedH. influenzae.
MHAEM Allele at indicated enzyme locus Sero-OMP RFLP Geographic Year of
Group ET 110.* CAK NSP POI MAE MOH G6P GOT ADK 6PO PE2 PEl LAP POM CAT GLD G3P FUM type type pattern source isolation Other designation Ala 1.9 712 9 5 1 5 5 3 5 2 2 4 5 2 4 2 4 2 2 b IH G United States 1980 SLCH 668
Ala 1.9 513 9 5 1 5 5 3 5 2 2 4 5 2 4 2 4 2 2 b 2L V United States 1982 RM1130
Ala 1.9 1769 9 5 1 5 5 3 5 2 2 4 5 2 4 2 4 2 2 b 2L S Iceland 1984 B-7184
Ala 2 1847 9 5 1 5 5 3 3 2 2 4 5 2 4 2 4 2 2 b lH Canada 1980s LAW 10
Ala 3 2910 9 5 1 5 5 3 I 2 2 4 5 2 4 2 4 2 2 b United States LOEB S138
Ala 4 2368 9 5 1 5 5 3 6 2 2 4 5 2 4 2 4 2 2 b IL United States 1980s HARBOR 117
Ala 5 1081 9 5 1 5 5 3 5 2 4 4 5 2 4 2 4 2 2 b lH G United States 19708 SLCH 1338
Ala 6 1065 9 5 1 5 5 3 6 2 4 4 5 2 4 2 4 2 2 b IL G United States 19508 EAGAN
Ala 7 2383 9 5 1 5 5 3 6 2 3 4 5 2 4 2 4 2 2 b IL United States 1980s HARBOR 185
Ala 1.6 3078 6 5 1 5 5 3 5 2 2 4 5 2 4 2 4 2 2 b 2L Alaska 1980s IW 32
Ala 1.7 725 7 5 1 5 5 3 5 2 2 4 5 2 4 2 4 2 2 b V Australia 1985 RM7118
Ala 1.8 3079 8 5 1 5 5 3 5 2 2 4 5 2 4 2 4 2 2 b lL Norway 1980s D 143
Ala 8 1811 8 5 1 5 5 3 6 2 2 4 5 2 4 2 4 2 2 b 3L S Kenya 19808 RM7430
Ala 9 1992 9 5 1 5 5 3 5 3 2 4 5 2 4 2 4 2 2 b Canada 1980s LAW ISS
Ala 10 3081 9 5 1 5 5 3 5 2 2 4 5 2 6 2 4 2 2 b United States 1983 RGH 4649
Ala 11 1074 9 5 1 5 5 1 5 2 2 4 5 2 4 2 4 2 2 b lL United States SLCH 3279
Ala 13 2949 9 5 1 5 5 6 5 2 2 4 5 2 4 2 4 2 2 b lH United States 1986 SLCH 1O,026A
Ala 14 3080 9 5 1 5 5 3 5 2 2 4 5 2 4 3 4 2 2 b IH Alaska 1980s JW 5
Ala IS 3077 9 5 1 5 2 3 5 2 2 4 5 2 4 2 4 2 2 b 2L United States 1985 PITT 8524
Ala 16 1253 9 5 1 5 3 3 5 2 2 4 5 2 4 2 4 2 2 b Canada 1980s PERRIER
Ala 17 1982 9 5 1 5 5 3 5 2 2 4 2 2 4 2 4 2 2 b Canada 1980s LAW 145
Ala 18 3082 9 5 1 3 5 3 5 2 2 4 5 6 4 2 4 2 2 b 2L Alaska 1980s IWll
Ala 19 3083 9 5 1 3 5 3 5 2 2 4 5 2 4 2 4 2 2 b 2L Alaska 1980s IW 36
Ala 20 3732 9 5 1 5 5 3 5 2 2 4 5 6 4 2 4 2 2 b lH United States 1984 PITT 8417
Ala 22 3733 9 5 1 5 5 3 5 2 2 4 5 3 4 2 4 2 2 b 2L United States 1984 PITT 8430
Ala 23 2793 5 5 1 5 5 3 5 2 2 4 5 3 4 2 4 2 2 b Scotland 1984 PENt 7866
Ala 24 2958 9 5 5 5 5 3 5 2 2 4 5 2 4 2 4 2 2 b 2L United States 1986 SLCH 4691b
Ala 26 1081 9 5 9 5 5 3 5 2 2 4 5 2 4 2 4 2 2 b IH G United States 1983 SLCH 3765
Ala 27 2932 9 5 9 5 5 3 5 2 2 2 5 2 4 2 4 2 2 b lL* United States 1985 SLCH 4996A
Ala 28 250 9 5 1 5 5 3 5 2 1 4 5 2 4 2 4 2 2 b United States 19808
Ala 29 1079 9 5 1 5 5 3 5 2 1 0 5 2 4 2 4 2 2 b 2L V United States 1982 SLCH 3718 Ala 30 1052 9 5 1 5 5 3 5 2 1 2 5 2 4 2 4 2 2 b 9L V United States 1980 SLCH 628B
Ala 31 562 9 5 1 5 5 3 5 2 2 2 5 2 4 2 4 2 2 b G England 1985 RM6107
Ala 32 1054 9 0 1 5 5 3 5 2 2 4 5 2 4 2 4 2 2 b 2H United States 1980 SLeH 851b
Ala 33 1868 9 4 1 5 5 3 5 2 2 4 5 2 4 2 4 2 2 b United States 1980s LAW 31
Ala 34 1080 9 0 1 5 5 3 6 2 2 4 5 2 4 2 4 2 2 b lL G United States 1983 SLCH 3752
Ala 35 1358 8 0 1 5 5 3 6 2 2 4 5 2 4 2 4 2 2 b South Africa 1980s JOH§ 39746
Alb 36 1075 9 4 4 4 b lL G United States 19808 SLCH 3438
Ale 37 1200 9 5 4 5 5 3 5 2 2 4 5 2 4 2 4 2 2 b 2L Canada 19808 HAMEL QUE 167
Ale 38 1083 9 5 4 5 5 3 6 2 2 4 5 2 4 2 4 2 2 b lU United States 1984 SLCH 3805
Ale 39 3093 5 5 4 5 5 3 6 2 2 4 5 2 4 2 4 2 2 b 3L Norway 19708 KILIAN 10390
Ale 40 1126 5 5 4 5 5 3 1 2 2 4 5 2 4 2 4 2 2 b 3L Spain 19808 R 1713
Ale 41 2069 5 5 4 5 5 3 5 2 2 4 5 6 4 2 4 2 2 b France 1980s DABERNAT 1762
Ale 42 977 5 5 4 5 5 3 5 2 2 4 5 3 4 2 4 2 2 b 3L Switzerland 1985 N 76
Ale 43 945 5 5 4 5 5 7 5 2 2 4 5 3 4 2 4 2 2 b ilL Switzerland 1985 N 108
Ale 44 3084 9 5 1 5 5 3 6 2 2 4 5 3 4 2 4 2 2 b lL United States 1984 PITT 8434
Ale 45 1477 8 5 1 5 5 3 6 2 2 4 5 3 4 2 4 2 2 b lL The Gambia 1982 WALL 9
Ale 46 2325 8 5 4 5 5 3 6 2 2 4 5 3 4 2 4 2 2 b Australia 1980s RBH 24
Ale 47 2976 7 5 4 5 5 3 3 2 2 4 5 3 4 2 4 2 2 b Scotland 1986 PENt 3943
Ale 48 1176 7 5 4 5 5 3 6 2 2 4 5 3 4 2 4 2 2 b 26L Canada 1980s HAMEL C 126/83
AId 49 2957 9 1 7 2 2 4 5 4 4 2 2 b IH United States 1986 SLCH 4630C
AId 50 701 8 1 7 2 2 4 5 4 4 2 .2 b V Ghana 1983 RM7020
AId 51 2422 8 4 6 2 2 4 5 4 4 2 2 b Scotland 1980s
Ale 52 812 6 2 4 4 2 4 b Ghana 1980s RM7017
Alf 53 2819 6 6 2 4 4 6 4 4 2 b V Denmark 1944 ENGBAEK S41
A2a 54 3085 8 5 1 5 5 3 6 2 2 4 5 6 4 2 4 2 2 b lL Canada 1984 HAM 7
A2a 55 1964 8 5 4 5 5 3 6 2 2 4 5 6 4 2 4 2 2 b Canada 19808 LAW 127
A2a 56 1491 8 5 4 5 5 3 5 2 2 4 5 6 4 2 4 2 2 b The Gambia 1983 WALL 40
A2a 57 1072 8 5 4 5 5 3 1 2 2 4 5 6 4 2 4 2 2 b 3L United States 1980s SLCH 3254
A2a 58 1653 8 5 1 5 5 3 3 2 2 4 5 6 4 2 4 2 2 b 16L Malaysia 1971 SN0053
A2a 12.8 1666 8 5 4 5 5 3 3 2 2 4 5 6 4 2 4 2 2 b 3L United States 1980 SLCH 3010
A2a 12.8 1064 8 5 4 5 5 3 3 2 2 4 5 6 4 2 4 2 2 b lL S Thailand 1979 SLCH 1493A
A2a 59 2141 8 5 4 5 5 3 3 2 2 4 5 3 4 2 4 2 2 b lL Thailand 1980s SLCH 8035
A2a 60 1800 8 5 4 5 5 3 3 2 2 4 5 5 4 2 4 2 2 b 3L Kenya 1980s RM7419
A2a 61 2821 8 5 4 5 5 8 3 2 2 4 5 6 4 2 4 2 2 b Denmark 1983 ARPI20
A2a 62 1071 8 5 4 5 5 3 3 2 2 4 5 6 4 2 4 1 2 b 3L United States 1941 SLCH 3207
A2a 63 3086 8 5 4 5 5 3 3 2 2 4 5 6 4 2 4 3 2 b 3L Norway 19808 KILIAN 5687
Global Population Structure ofH.influenzae 81
Table 2. (continued)
MHAEM Allele at indicated enzyme locus Sero-OMP RFLP Geographic Year of
Group ET no.· CAK NSP POI MAE MOH G6P GOT ADK 6PO PE2 PEl LAP POM CAT GLD G3P FUM type type pattern source isolation Other designation
A2a 64 1078 8 5 4 5 5 3 3 2 2 4 1 6 4 2 4 2 2 b 3L S United States 1982 SLCH 3715A
A2a 65 1888 8 5 4 5 5 3 3 2 2 4 7 6 4 2 4 2 2 b Canada 19805 LAW 51
A2a 66 1062 8 5 4 5 5 3 3 2 2 4 5 6 4 2 4 2 3 b ilL S United States 1980 SLCH 1445
A2a 67 3734 8 5 4 5 5 3 3 2 2 4 5 6 4 2 II 2 2 b 3L Norway 19708 KILIAN 9703
A2a 68 1313 8 5 4 5 5 3 3 2 2 4 5 6 4 2 1 2 2 b 3L Norway 19708 KILIAN 3754
A2a 69 1595 8 5 4 5 6 3 3 2 2 4 5 6 4 2 4 2 2 b Malaysia 1975 SN1352
A2a 70 319 8 5 4 0 5 3 3 2 2 4 5 6 4 2 4 2 2 b PapuaNew Guinea 1980 SLCH 4294
A2a 71 558 8 5 4 5 5 3 3 2 2 2 5 6 4 2 4 2 2 b G England 1983 RM6094
A2a 72 1751 8 5 4 5 5 3 3 3 2 2 5 6 4 2 4 2 2 b 3L Iceland 1977 8-3786
A2a 73 1245 8 5 4 5 5 3 3 2 2 5 5 6 4 2 4 2 2 b Canada 19805 HAMEL MONTREAL
A2a 74 1301 8 5 2 5 5 3 3 2 2 5 5 6 4 2 4 2 2 b 2L South Africa 19805 CAPE TOWN 6559 A2a 12.6 1058 6 5 4 5 5 3 3 2 2 4 5 6 4 2 4 2 2 b 14L S United States 1980 SLCH 1256
A2a 12.10 476 0 5 4 5 5 3 3 2 2 4 5 6 4 2 4 2 2 b ilL Hawaii 19805 WAGNER 741
A2a 12.9 1373 9 5 4 5 5 3 3 2 2 4 5 6 4 2 4 2 2 b 16L Japan 1982 KAWAKAMI 39
A2a 75 3089 9 5 4 5 5 3 3 2 2 4 5 6 1 2 4 2 2 b 3L Denmark 19805 KILIAN M1840
A2a 12.11 2358 1 5 4 5 5 3 3 2 2 4 5 6 4 2 4 2 2 b 29L Philippines 19805 SLCH 8661
A2a 76 1348 1 5 4 5 5 3 3 2 2 4 5 3 4 2 4 2 2 b South Africa 19805 JOH§ 40422
A2a 12.7 3735 7 5 4 5 5 3 3 2 2 4 5 6 4 2 4 2 2 b 3L United States 1984 PITT 8416
A2a 77 930 7 5 4 5 2 3 3 2 2 4 5 6 4 2 4 2 2 b 3L Switzerland 1983 N 201
A2a 78 1055 9 5 4 5 2 3 3 2 2 4 5 6 4 2 4 2 2 b 16L S United States 19708 SLCH 1059
A2a 79 942 5 5 4 5 2 3 3 2 2 4 5 6 4 2 4 2 2 b 3L Switzerland 1985 N III
A2a 12.5 1060 5 5 4 5 5 3 3 2 2 4 5 6 4 2 4 2 2 b 3L S United Stales 19508 SLCH 1333
A2a 80 2833 5 5 4 5 5 3 3 2 2 4 5 3 4 2 4 2 2 b Denmark 1983 ·ARP168
A2a 81 1343 5 5 4 5 5 3 3 2 2 4 5 5 4 2 4 2 2 b 3L South Africa 19805 JOH§ LANCER
A2a 82 2852 5 5 4 5 5 3 3 2 2 4 5 2 4 2 4 2 2 b Sweden 1982 NK 653/82
A2a 83 2315 5 5 4 5 5 3 3 2 2 4 5 6 2 2 4 2 2 b Australia 19805 RBH 14
A2a 84 3090 5 5 4 5 5 3 3 2 2 4 5 6 1 2 4 2 2 b Canada 1984 HAM 13
A2a 85 3087 5 5 4 6 5 3 3 2 2 4 5 6 4 2 4 2 2 b 3L Canada 1984 HAM 16
A2a 21.8 2575 8 5 4 5 5 6 3 2 2 4 5 6 4 2 4 2 2 b lL Finland 1985 IHI23222
A2a 21.9 2820 9 5 4 5 5 6 3 2 2 4 5 6 4 2 4 2 2 b Sweden 1985 RM7109
A2a 21.5 2310 5 5 4 5 5 6 3 2 2 4 5 6 4 2 4 2 2 b Australia 1984 RBH 1
A2a 86 2955 5 5 4 5 5 8 3 2 2 4 5 6 4 2 4 2 2 b 3L United States 1985 SLCH 45858
A2a 87 2784 5 5 4 5 5 1 3 2 2 4 5 6 4 2 4 2 2 b Finland 1985 IHI23368
A2a 88 2546 5 5 4 5 5 7 3 2 2 4 5 6 4 2 4 2 2 b Finland 1985 IHI23255
A2a 89 2077 9 5 4 5 5 7 3 2 2 4 5 6 4 2 4 2 2 b France 19805 DABERNAT 1775
A2a 12.0 1694 0 5 4 5 5 3 3 2 2 4 5 6 4 2 4 2 2 b 3L New Zealand 1985 AS850619
A2a 90 2237 0 0 4 5 5 3 3 2 2 4 5 6 4 2 4 2 2 b Sweden 1982 NK952
A2a 91 1840 7 0 4 5 5 3 3 2 2 4 5 6 4 2 4 2 2 b 3L Canada 19805 LAW 3
A2a 92 1804 8 0 4 5 5 3 3 2 2 4 5 6 4 2 4 2 2 b United States 1983 RM1005
A2a 93 2979 5 0 4 5 5 3 3 2 2 4 5 6 4 2 4 2 2 b Scotland 1983 PENt 62782
A2a 94 2714 9 4 4 5 5 3 3 2 2 4 5 6 4 2 4 2 2 b United States 19805 CHOP' 19
A2a 95 2708 8 4 4 5 5 3 3 2 2 4 5 6 4 2 4 2 2 b United Stales 1986 CHOP' 13
A2a 96 2824 5 4 4 5 5 3 3 2 2 4 5 6 4 2 4 2 2 b Greenland 1983 ARPI89-83
A2a 97 2609 7 4 4 5 5 3 3 2 2 4 5 6 4 2 4 2 2 b Canada 19805 HAMEL PEII 26
A2a 98 3088 7 7 4 5 5 3 3 2 2 4 5 6 4 2 4 2 2 b United States 19805 YOGEV III
A2a 99 1625 8 7 4 5 5 3 3 2 2 4 5 6 4 2 4 2 2 b 3L Malaysia 1975 SNI204
A2a 100 1673 7 5 4 5 5 3 3 4 2 4 5 6 4 2 4 2 2 b 3L Canada 1980 SLCH 1687F
A2a 101 1067 7 5 4 5 5 3 3 2 3 4 5 6 4 2 4 2 2 b 14.1L S United States 1980 SLCH 1993 A2a 102 1077 7 5 4 5 5 3 3 2 4 4 5 6 4 2 4 2 2 b 22L S United Stales 1980 SLCH 3516
A2a 103 1057 7 5 4 5 5 3 3 2 2 4 5 6 6 2 4 2 2 b 5.1L Alaska 1980 SLCH 1211
A2a 104 995 7 5 4 5 5 3 3 2 2 4 5 6 2 2 4 2 2 b 3L Switzerland 1986 N 58
A2a 105 1036 8 5 4 5 5 3 3 2 2 4 5 6 6 2 4 2 2 b Switzerland 1985 N 16
A2a 106 3091 8 5 4 5 1 3 3 2 4 4 5 6 4 2 4 2 2 b 13L Alaska 1985 JW19
A2a 107 3092 8 5 4 5 5 3 3 2 1 4 5 6 4 2 4 2 2 b Canada 1969 TOR 31
A2a 108 933 5 5 4 5 5 3 3 2 I 4 5 6 4 2 4 2 2 b 3L Switzerland 1983 N204
A2a 109 1305 8 5 2 5 5 3 3 2 1 4 5 6 4 2 4 2 2 b 2L South Africa 19805 CAPE TOWN 9723
A2a llO 3736 5 5 4 5 5 3 3 2 2 4 5 6 4 2 12 2 2 b lL Denmark KILIAN ll4
A2a III 1255 5 5 4 5 5 3 3 2 2 4 5 6 4 2 12 3 2 b Canada 19808
A2b 112 1937. 7 2 4 6 4 4 2 2 b Canada 19805 LAW 100
A2b ll3 1244 8 2 4 6 4 4 2 2 b Canada 19805 CHILETTE
A2b ll4 3737 6 2 4 6 4 4 2 2 b 5L Alaska 19805 JW 81
A2c ll5 1314 4 4 4 4 4 b 2L South Africa 19805 DURBAN 63
A2d ll6 188 8 4 6 4 6 4 4 2 b 16L Dominican Republic 1980s CEF 79
A2d ll7 212 5 4 2 4 6 4 4 2 b Dominican Republic 19805 SUL837
A2d ll8 1059 7 4 3 4 6 4 4 2 b 5L United States 19805 SLCH 1287
A2e 21.6 1053 6 4 6 2 2 4 6 4 4 2 b 13L United States 1979 SLCH 808A
A2e 119 1068 6 4 6 2 3 4 6 4 4 2 b llL United States 19805 SLCH 3012
A2e 120 3095 6 4 6 2 2 4 6 6 4 2 b 13L Alaska 19808 JW 80
82 M~uet~
Table 2. (continued)
Allele at indicated enzyme locus
Geographic source
Year of
isolation Other designation
su 127 2804 BIg 162 747 BIg 163 1810 BId 155 3100 Ble 156 3099 A4 129 1670 AS 130 1300 2862 RM8012 JW67 CHOP' 21 ENGBAEK T28 SLCH 1481a RM8069 LAW 136 SLCH 8362a WAGNER 2954 DABERNAT 2280 770177 SLCH 8009 RM7414 WALL 13 WAGNER 6618 SLCH 1209 WALL 42 SLCH 1971 PITT 8447 CEF 8 SULB 83 SULB 85 840062 N 207 12681 JOH§ 128011 RM6137 RM1168 RM61SO RM8039 RM7033 1980 1984 1980s 1980s 1980s 1944 1981 1985 1980s 1980 1986 1943 ENGBAEK K7 1980s WAGNER 6546 1980s SLCH 1687C 1980s CAPE TOWN 5274 1980s RGH 5531 1973 SN0573 1977 1980 1980s 1982 1980s 1985 1980s IW 65 1980s D14 1982 1984 1980 1980s 1980s 1984 1985 1980 1980s 1963 1985 1984 1980s 1972 RM7271 1986 RM7429 1981 RMI042 1980s RM7031 1980s RM7032 1973 RM7191 1974 RM7198 1973 RM7190 1986 RM7421 1983 WALL 18 1985 KAWAKAMI10 1980s RM7205 1986 RM7416 1986 B-I014 1985 N 60 RM1167 1975 RM7270 Hawaii Hawaii United States United States Alaska United States Denmark Denmark South Africa Canada
Dominican Republic 1980s SULB 31
England United States England United States Papua New Guinea
Alaska United States Malaysia United States United States Canada Papua New Guinea Hawaii France The Netherlands Kenya Kenya TheGambia Hawaii United States The Gambia United States United States Dominican Republic Dominican Republic Dominican Republic South Africa Switzerland South Africa South Africa South Korea S S S S S S S S S D Malaysia D Kenya T United States D D D D D
T Papua New Guinea T Papua New Guinea T Malaysia T Malaysia T Malaysia The Gambia Switzerland Cl United States CI Malaysia IL 6U 6U 6U 6U 1U 6U 6U 6U 6U 6U 1U Japan 5L N TheGambia 5L N Kenya Iceland 1U 1U 1U 1U 1U N Kenya 1U 13L 13L 23U 24U b b b b b b b b b b b b b b b b b b b b b b b b b b b b b b b b b b b b b d d d d d d d b b b b 2 2 2 2 2 2 2 2 2 2 2 2 2 2 2 2 2 2 1 I 2 2 2 2 2 2 2 2 2 2 2 2 2 2 2 2 2 2 2 3 3 2 2 2 2 2 2 2 2 2 2 2 2 2 2 2 2 2 2 2 2 2 2 2 2 2 2 2 2 2 2 3 2 2 4 4 4 4 4 4 4 4 4 4 4 4 4 4 4 4 4 4 4 4 4 4 4 4 4 4 4 4 4 4 4 4 4 4 4 4 4 4 4 2 4 4 4 4 4 11 2 2 2 2 2 2 2 2 2 2 2 2 2 2 2 2 2 2 2 2 2 2 2 2 2 2 2 2 2 2 2 2 2 4 2 4 2 2 4 2 4 2 2 2 2 4 4 4 4 4 4 4 6 2 4 2 2 6 2 4 2 2 6 6 6 6 6 4 4 4 4 6 6 6 6 6 6 6 6 6 4 4 6 6 6 6 6 6 6 6 4 4 4 2 4 4 2 4 4 2 4 6 2 4 3 6 2 4 2 4 12 4 6 6 6 6 3 6 4 2 4 2 2 3 3 3 3 6 6 3 5 5 5 5 3 5 2 2 2 3 2 5 6 5 5 6 6 2 4 2 2 6 4 6 6 6 4 12 6 4 4 5 5 5 7 5 5 5 5 5 5 5 5 5 5 5 5 5 5 5 5 5 5 5 7 7 7 7 5 5 5 6 4 4 4 4 3 4 4 4 4 4 4 4 4 4 4 4 4 4 4 4 4 4 4 4 4 4 4 4 4 4 4 4 4 2 2 2 1 2 2 4 4 2 4 5 2 4 5 4 4 4 4 4 5 4 2 4 2 3 2 2 2 2 2 2 2 2 2 2 2 2 2 2 2 2 2 2 2 2 2 2 2 2 2 2 2 2 2 2 2 4 2 4 4 2 2 2 2 2 2 2 2 2 2 2 2 2 2 2 2 2 2 2 2 2 2 2 2 2 2 2 2 2 2 2 2 2 2 2 4 2 2 4 2 2 4 2 2 4 2 2 2 2 2 2 2 2 2 2 2 2 2 2 4 2 2 4 3 3 6 3 3 3 3 3 3 3 3 3 3 3 3 3 3 3 3 3 3 3 6 6 6 6 6 6 6 6 7 6 6 6 3 6 7 6 6 3 6 6 6 6 7 6 6 6 6 6 6 6 6 6 7 3 3 3 3 3 3 3 3 3 3 3 3 3 3 3 3 3 3 3 3 3 3 5 5 5 5 5 6 6 6 5 5 5 5 6 6 6 6 6 6 6 6 6 6 6 6 6 6 6 6 2 6 2 6 2 6 3 3 3 3 3 3 3 3 3 3 3 3 3 3 3 3 3 3 3 3 3 3 2 4 5 4 4 4 4 4 4 4 5 5 5 5 5 5 5 5 5 5 5 5 5 5 5 5 5 5 5 5 5 5 2 4 4 5 5 5 5 5 5 5 6 4 2 11 5 5 5 o 5 5 5 5 5 5 5 5 5 5 5 5 5 5 5 5 5 7 7 7 5 5 5 o 5 5 5 5 5 6 6 6 6 6 6 6 6 6 4 6 6 6 6 6 6 6 6 6 6 6 6 6 6 6 6 6 6 6 6 6 6 6 6 6 6 6 6 6 6 6 6 6 6 6 6 6 6 6 6 6 6 6 6 6 4 6 5 10 5 6 5 10 5 484 206 571 518 584 787 706 S06 704 705 728 735 727 993 517 746 472 1778 1092 3096 2716 2809 A3 128 Ale 121 Ale 122 Ale 123 Ale 124 Ale 125 Ale 126 Bla 131 3097 Bla 132 1629 BIb 25.6 1063 BIb 133 798 BIb 134 1973 BIb 135 2163 BIb 136 2033 BIb 137 2135 BIb 138 881 BIb 139 2139 BIb 140 1795 BIb 141 1481 BIb 142 1480 BIb 143 1056 BIb 144 1493 BIb 145 1066 BIb 146 3098 BIb 147 171 BIb 148 215 BIb 149 225 BIb 150 874 BIb 151 912 BIb 152 1334 BIb 153 1347 Blc 154 Blf 157 Blf 158 Blf 159 Blf 160 Blf 161 Dla 177 Dla 178 B2c 169 B2b 165 B2b 166 B2b 167 B2b 168 B2a 164 B2d 170 1802 B3 171 1485 B4 172 1370 B4 173 742 B4 174 1797 B5 175 1788 Cl 176 (continued)
Global Population Structure of H influenzae 83
Table 2. (continued)
Allele at indicated enzyme locus
Geographic source
Year of
isolation Other designation
Gl 218 1804 J2 238 1303 13 239 1084 Kia 240 511 Olb 179 520 Olb ISO 743 Olb 181 569 02 182 565 02 183 566 D3 184 785 D4 185 568 05 186 lS03 EI 187 lS05 FI 188 602 FI 189 603 FI 190 619 F2a 191 492 F2a 192 784 F2a 193 634 F2a 194 755 F2a 195 585 F2a 196 644 F2a 197 592 F2a 198 596 F2a 199 589 F2a 200 590 F2a 201 624 F2b 202 615 F2b 203 709 227 532 228 539 229 550 230 724 231 3106 232 3107 RM6167 RM7415 RM7280 RM6166 RM6178 RM6177 RM6211 RM6228 RM6215 RM7287 RM6208 RM6229 RM6219 RM6227 SLCH 3491 JW28 JW43 SLCH 3191 SLCH 3205 1968 RMI271 1973 RM7267 1981 RM6135 1970 RM6129 1964 RM6132 1983 RMS032 1975 RM6134 1986 RM7422 1986 RM7424 1964 RM6168 1964 RM6169 1965 RM6185 RMIOl8 1983 RMS031 1967 RM6200 1973 RM7279 RM6151 1972 RM6210 1962 RM6158 1963 RM6162 RM6155 RM6156 1966 RM6190 1963 1986 1973 1963 1964 1964 1972 1976 1973 19708 1971 1977 1974 1976 1986 RM7423 RMI147 1977 RM6083 1966 RM6073 1964 RM6059 1966 RM6064 1962 RM6070 1967 RM6079 1968 RM6068 1965 RM6062 1963 RM6069 1967 RM60SO 19808 RM7115 1968 CATLIN 6325 1968 CATUN 5788 19808 CAPE TOWN 8811 1947 RABINOWITZ 1979 RMI121 1983 19808 1980 1954 1940 England Kenya Malaysia England England England England England England Malaysia England England England England Unknown England England England England England England England England England England United States Dominican Republic United States United States United States Alaska Alaska United States United States South Africa E England E England E England E United States United States E England E Malaysia Unknown E England England E England E Unknown E Unknown E England E E E E E E E E E E Unknown CI Malaysia CI England CI Unknown CI England CI United States C2 England C2 Kenya Kenya o M M M M E Kenya o United States Anom·· England 1965 RM6181 E PapuaNew Guinea 19808 RM7066
2H M 4H M 2H M 6H M 6H M 6H M 6H M 6H M 4H 4H 4H 5H 8-Htt 8H 8H 0 8H 8H a b b b b b b b b b 17H 2 2 2 2 2 2 2 2 2 I I 2 2 2 2 2 2 2 2 2 2 2 2 2 2 2 2 2 2 2 2 2 2 2 2 2 2 2 2 2 2 2 2 2 2 2 2 2 2 2 2 2 2 2 2 2 2 2 2 2 2 2 2 2 3 4 4 4 5 5 5 5 5 5 5 5 5 5 5 5 5 5 4 4 4 4 4 4 4 4 4 4 4 4 4 2 4 2 2 2 2 2 2 2 2 2 2 2 2 2 2 3 3 3 3 4 6 6 6 7 5 7 7 7 7 7 7 7 6 7 7 7 7 4 6 6 6 4 4 4 4 4 4 4 4 4 2 2 7 2 7 2 2 4 3 3 3 4 3 3 3 3 3 5 3 3 3 3 2 2 2 3 3 2 2 2 4 7 2 2 7 2 2 7 2 2 3 7 2 5 2 2 3 7 2 5 2 2 5 7 2 5 2 2 6 7 2 5 2 2 3 7 2 5 2 2 3 7 2 5 2 2 3 7 2 5 2 2 3 8 2 5 2 2 3 7 2 5 3 2 3 6 2 5 2 2 3 7 2 5 2 2 2 2 2 2 2 2 2 7 3 3 3 3 3 3 3 3 3 3 3 3 3 3 5 5 5 5 5 4 4 4 2 2 2 2 2 2 2 2 2 2 I 2 2 2 2 2 2 2 2 2 2 2 2 2 2 2 2 2 2 2 2 2 2 2 2 2 2 2 2 2 5 5 5 5 5 4 4 4 4 3 3 4 4 4 2 2 2 2 2 2 2 2 2 2 2 2 2 2 2 2 2 2 2 2 3 3 3 3 3 3 3 3 3 3 3 3 3 3 4 4 6 6 6 6 6 5 2 2 4 6 6 2 4 2 5 5 2 2 4 6 4 2 4 2 2 4 5 6 6 4 4 4 6 4 2 4 2 4 4 2 6 2 2 4 3 6 2 2 4 3 6 2 2 4 5 6 2 4 2 3 6 2 2 2 3 6 2 4 2 3 6 2 2 2 3 3 2 4 2 3 3 2 4 2 3 3 2 4 2 3 3 2 4 2 3 3 2 4 2 3 3 2 4 2 2 3 2 4 2 2 4 2 I 2 3 3 3 3 3 3 3 3 3 3 4 3 3 3 5 5 4 5 5 5 5 5 5 5 3 5 5 5 3 5 3 5 5 5 5 5 5 5 5 5 5 2 2 2 2 2 2 2 2 2 2 2 2 2 2 2 2 2 2 2 4 4 4 4 4 4 4 4 4 4 9 2 4 4 4 4 4 4 4 4 9 9 9 9 9 9 9 9 9 9 9 10 10 10 5 5 5 5 5 o o o 8 5 5 o 5 5 4 5 4 4 5 5 6 7 5 5 9 9 9 9 9 9 9 o 9 9 9 5 5 o 5 5 9 2 5 5 9 2 5 5 9 2 5 9 5 9 2 5 9 5 9 2 5 9 5 9 2 5 9 5 9 2 5 9 7 9 2 5 9 0 9 2 5 9 5 9 2 5 9 5 9 2 5 9 5 9 2 5 9 5 9 2 5 9 5 9 2 5 9 2 9 2 6 0 10 5 6 0 10 5 6 0 10 5 6 10 6 10 o 13 6 7 6 7 7 7 7 o 7 7 7 7 7 7 7 7 o 4 SIS 553 543 529 534 540 549 538 601 1796 756 600 612 61l 645 662 649 763 642 663 653 661 1076 3108 3109 1069 1070 233 234 235 236 237 F2c 204 F2c 205 F2c 206 F2c 207 F2c 208 F2c 209 F2c 210 F2c 211 F2c 212 F2c 213 F2c 214 F2c 215 F2c 216 F2c 217 Hla 219 Hla 220 Hla 221 Hlb 222 Hlb 223 Hlb 224 Hlb 225 Hlb 226 lib Jla Jla Ila Ila Ila JIb JIb JIb JIb JIb (continued)
84 Musser et al:
Table 2. (continued)
MHAEM Allele at indicated enzyme locus Sero-OMP RFLP Geographic Year of
Group ET no.· CAK NSP POI MAE MDH G6P GOT ADK 6PO pm PEl LAP POM CAT GLD G3P FUM type type pattern source isolation Other designation
Klb 241 686 2 4 2 2 England 1966 RM6252 Klc 242 697 7 5 2 2 3 5 2 2 2 7 3 4 2 2 F England RM6263 Klc 243 698 7 5 2 2 3 5 2 2 3 7 3 4 2 2 England 1984 RM6265 Klc 244 771 7 5 2 2 3 5 2 2 3 2 3 4 2 2 F Malaysia 19705 RM7299 Klc 245 757 7 5 2 2 3 5 2 2 3 4 3 4 2 2 Malaysia 1971 RM7281 Klc 246 758 7 5 2 2 3 5 2 2 2 4 3 4 2 2 Malaysia 19705 RM7282 Klc 247 768 7 5 2 2 3 5 2 2 5 4 3 4 2 2 Malaysia 1970s RM7295 Klc 248 761 7 5 2 2 3 5 2 2 6 4 3 4 2 2 Malaysia 19705 RM7285 Klc 249 759 7 5 2 2 3 5 2 2 1 4 3 4 2 2 F Malaysia 19705 RM7283 Klc 250 770 7 5 2 2 3 5 2 2 1 2 3 4 2 2 F Malaysia 19705 RM7298 Klc 251 764 5 5 2 2 3 5 2 2 5 4 3 4 2 2 F Malaysia 1970s RM7290 Klc 252 760 7 0 2 2 3 5 2 2 1 4 3 4 2 2 Malaysia 19705 RM7284 Klc 253 762 7 0 2 2 3 5 2 2 3 4 3 4 2 2 F Malaysia 19705 RM7286 Klc 254 765 5 0 2 2 3 5 2 2 6 4 3 4 2 2 F Malaysia 1970s RM7292
KId 255 776 0 4 United States 1984 RM8009
K2a 256 514 7 5 3 2 5 4 5 2 2 3 6 2 2 0 United States RM1137
K2a 257 689 7 5 3 2 5 4 5 2 2 3 7 2 2 England 1967 RM6255
K2a 258 699 7 5 3 2 5 4 5 2 2 2 7 2 2 UN** England 1984 RM6266
K2a 259 693 7 5 3 2 5 4 5 1 2 3 7 2 2 0 England 1967 RM6259
K2a 260 688 7 0 3 2 5 4 5 2 2 3 7 2 2 0 England 1966 RM6254
K2a 261 696 7 0 3 2 5 4 5 2 2 2 7 2 2 0 England 1968 RM6262
K2a 262 669 7 5 3 2 5 4 5 2 1 3 6 2 2 0 England 1963 RM6235
K2a 263 678 7 5 3 2 5 4 5 2 1 3 7 2 2 0 England 1964 RM6244
K2a 264 673 7 5 3 2 5 4 5 2 1 5 6 2 2 UN** England 1963 RM6239
K2a 265 671 7 0 3 2 5 4 5 2 1 3 6 2 2 0 England 1963 RM6237
K2a 266 679 7 0 3 2 5 4 5 2 1 3 7 2 2 England 1964 RM6245
L1 267 1798 2 Kenya 1986 RM7417
NOTE. Seetext or footnotetotable 3 for enzyme abbreviations. • Musser Haemophilus.
tPennington.
* Similar to subtype l L, but not identical. § Johannesburg.
/IChildren's Hospital of Philadelphia. IPrince Edward Island . •• Anomalous.
ttSimilar to subtype 8, but apparently lacks PI band.
**
Undefined.Genetic Relationships Among Multilocus Enzyme Genotypes
The dendrogram in figure 1 summarizes estimates of the genetic relationships of the 280 ETs, based on allelic variation at the 17enzyme loci. At a genetic distance of 0.20, there were 56 branches, each repre-sented by a single ET or a cluster ofETs. 1\velve ma-jor lineages diverging at distances greater than 0.42 were designated by the capital letters A through L; clusters ofETs in these lineages were numbered (e.g., AI, A2, etc.), and groups of ETs in a cluster were designated with lower case letters. Lineages A through0 were separated from lineages H through L at a genetic distance of 0.66, which means that ETs in these two primary divisions of the dendro-gram (I and II) differed, on average, at 10 of the 17 loci assayed.
Major lineage A, in division I, was composed en-tirely of ETs of serotype b isolates. (Cluster Al and clusters A2 through A5 included ETs previously as-signed by Musser et al. [20, 29] to clone families [groups of closely allied clones] designated as A and B, respectively.) Lineage B, which diverged from lin-eage A at a genetic distance of 0.43, contained ETs of isolates producing capsule types a, b, and d. (Sero-type b isolates in this lineage previously wereassigned to clone family C [20, 29].) Clusters Dl through El contained the ETs of all the serotype c isolates stud-ied, and lineages F and0,which were separated from lineages A through E at a genetic distance of 0.58, included all ETs represented by serotype e isolates. Lineages H and I, clusters 11 through J3, and clusters Kl through Ll included ETs of isolates of serotype a, b, and f, respectively.(Serotype b strains in clusters
Global Population Structure ofH. influenzae 8S
Table 3. Mean genetic diversity (11) at 17enzyme loci in 280 ETs of encapsulatedH. influenzae. Mean genetic diversity (no. of alleles)
Enzyme Serotype locus
*
a b c d e f Total CAK 0.700 (4) 0.808 (9) 0.182 (2) 0.000 (I) 0.486 (3) 0.204 (3) 0.812 (9) NSP 0.257 (2) 0.224 (5) 0.509 (2) 0.000 (I) 0.385 (4) 0.474 (3) 0.286 (6) PGI 0.567 (3) 0.606 (6) 0.600 (4) 0.000 (I) 0.181 (2) 0.519 (2) 0.770 (11) MAE 0.552 (3) 0.398 (5) 0.000 (1) 0.286 (2) 0.000 (I) 0.071 (2) 0.623 (6) MDH 0.343 (3) 0.391 (5) 0.509 (2) 0.000 (I) 0.187 (4) 0.071 (2) 0.358 (6) G6P 0.514 (2) 0.532 (6) 0.600 (4) 0.000 (I) 0.630 (4) 0.495 (2) 0.647 (8) GOT 0.538 (4) 0.501 (6) 0.345 (3) 0.571 (2) 0.340 (3) 0.508 (2) 0.538 (7) ADK 0.324 (2) 0.135 (4) 0.000 (I) 0.000 (I) 0.000 (1) 0.000 (I) 0.274 (4) 6PG 0.567 (3) 0.260 (5) 0.000 (1) 0.000 (I) 0.495 (3) 0.071 (2) 0.449 (5) PE2 0.552 (3) 0.214 (5) 0.345 (3) 0.476 (2) 0.181 (2) 0.071 (2) 0.485 (6) PEl 0.605 (4) 0.147 (6) 0.855 (5) 0.000 (I) 0.185 (3) 0.304 (2) 0.526 (8) LAP 0.748 (5) 0.661 (6) 0.836 (5) 0.286 (2) 0.243 (4) 0.680 (5) 0.731 (8) PGM 0.652 (4) 0.355 (4) 0.473 (3) 0.286 (2) 0.299 (5) 0.738 (5) 0.589 (8) CAT 0.552 (3) 0.135 (4) 0.000 (I) 0.286 (2) 0.000 (I) 0.071 (2) 0.300 (5) GLD 0.495 (2) 0.044 (4) 0.000 (I) 0.286 (2) 0.288 (3) 0.508 (2) 0.345 (6) G3P 0.095 (2) 0.065 (3) 0.436 (2) 0.286 (2) 0.065 (2) 0.071 (2) 0.090 (3) FUM 0.467 (2) 0.043 (3) 0.473 (3) 0.000 (I) 0.185 (3) 0.000 (I) 0.116 (3) Average 0.502 (3.0) 0.325 (5.1) 0.363 (2.5) 0.162 (1.5) 0.242 (2.8) 0.286 (2.4) 0.467 (6.4)*
Abbreviations: CAK, carbamylate kinase; NSP, nucleoside phosphorylase; PGI, phosphoglucose isomerase; MAE, malic enzyme; MDH, malate dehydrogenase; G6P, glucose 6-phosphate dehydrogenase; GOT, glutamic oxaloacetic transaminase; ADK, adenylate kinase; 6PG, 6-phosphogluconate dehydrogenase; PE2, leucylalanine peptidase-2; PEl, leucylalanine peptidase-I; LAP, leucine aminopeptidase; PGM, phosphoglucomutase;CAT, catalase; GLD, glutamate dehydrogenase; G3P, glyceraldehyde-3-phosphate dehydrogenase; and FUM, fumarase.Jl through J3 previously were assigned to clone fam-ily D [29].)
In summary, multilocus enzyme electrophoresis revealed two major genetic divisions among encap-sulatedH. influenzae. Division I contained all ETs of serotype c and d strains, one phylogenetic line of serotype a strains, and most ETs (950,10) and isolates (990,10) of serotype b. Division II included all ETs of serotype f, a second major line of ETs expressing serotype a capsule, and a genetically heterogeneous second group of ETs of serotype b isolates. Thus, ETs of isolates of serotypes a and b occurred in each of the two primary phylogenetic divisions that are separated at a genetic distance of 0.66.
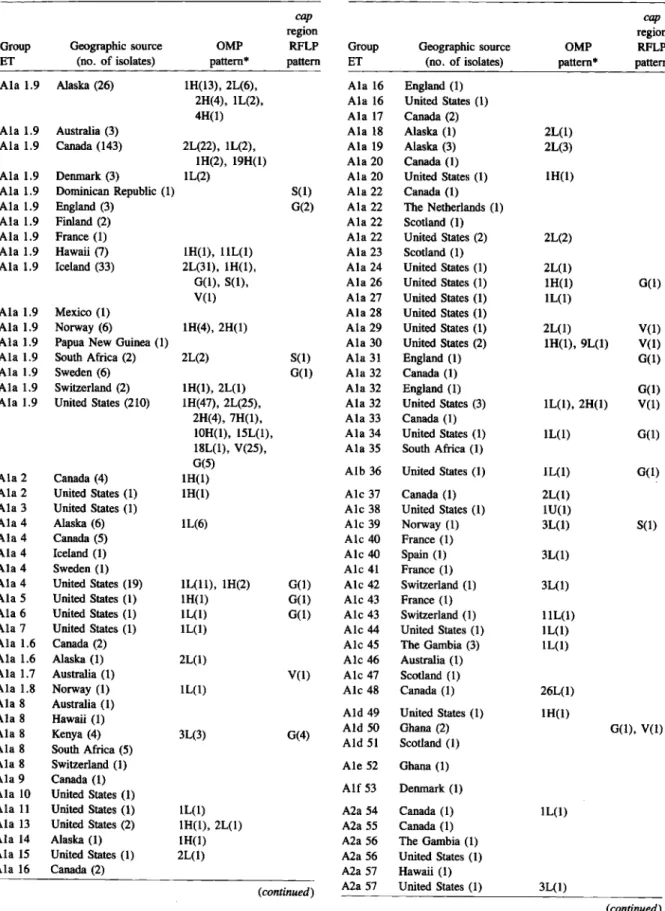
The allele profiles and additional characteristics of representative isolates of the 280 ETs of encapsu-latedH. influenzaeare presented in table 2; infor-mation on the geographic origin, OMP type, and cap region RFLP pattern of the isolates assigned to each ET is given in table 4. ETs were numbered in con-secutive order according to their positions in the den-drogram (figure 1),with the exception of ETs that were identical at all loci except-the CAK locus to the
four common multilocus genotypes (ETs I, 12, 21, and 25) earlier identified by Musser et al. [20], for which are reserved the numbers previously assigned. After the appearance of the paper describing these four ETs [20], two additional enzymes were identi-fied, carbamylate kinase and nucleoside phosphory-lase, that can be assayed inH. influenzaeisolates. Carbamylate kinase is strongly polymorphic in sero-type b isolates, and many electrophoretic variants of this enzyme are represented among isolates pre-viously grouped in each of the four common ETs (ETh 1, 12, 21, and 25). Consequently, isolates of each of these ETs are now differentiated into a series of ETs on the basis of alleles of CAK (e.g., ET 12.5, 12.6, 12.7, 12.8, etc.).
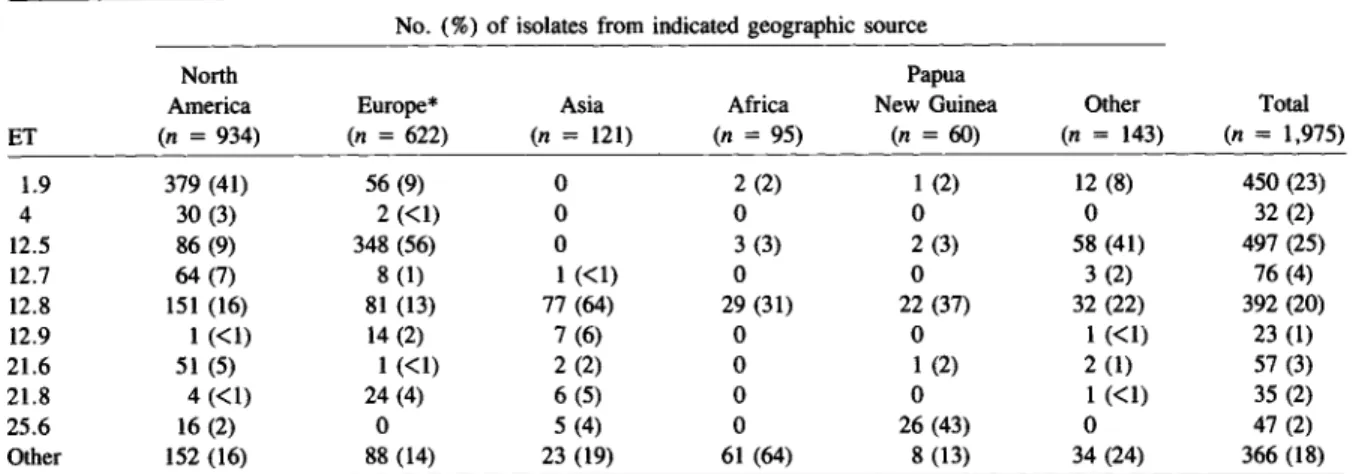
The great majority (800,10) of serotype bETs are in groups Ala, Ale, A2a, A2e, and Bl b, and most isolates are ofETs in groups Ala (280,10), A2a (600,10), and BIb (60,10). The four ETs represented by the largest number of isolates are ET 1.9 (810,10 of lates in group Ala), ET 12.5 and 12.8 (750,10 of iso-lates in group A2a), and ET 25.6 (400,10 of isoiso-lates in group Blb). Isolates of these four multilocus
geno-86 Musser et al.
Table 4. Characteristics of280ETs (representedby 2,209
isolates) of encapsulatedH. influenzae. Table 4. (continued)
cap cap
region region
Group Geographic source OMP RFLP Group Geographic source OMP RFLP
ET (no. of isolates) pattern* pattern ET (no. of isolates) pattern* pattern
Ala 1.9 Alaska (26) IH(I3), 2L(6), Ala 16 England (1)
2H(4), IL(2), Ala 16 United States (1)
4H(1) Ala 17 Canada (2)
Ala 1.9 Australia (3) Ala 18 Alaska (1) 2L(I)
Ala 1.9 Canada (143) 2L(22), IL(2), Ala 19 Alaska (3) 2L(3)
IH(2), 19H(1) Ala 20 Canada (1)
Ala 1.9 Denmark (3) IL(2) Ala 20 United States (1) IH(1)
Ala 1.9 Dominican Republic (1) S(l) Ala 22 Canada (1)
Ala 1.9 England (3) G(2) Ala 22 The Netherlands (1)
Ala 1.9 Finland (2) Ala 22 Scotland (1)
Ala 1.9 France (1) Ala 22 United States (2) 2L(2)
Ala 1.9 Hawaii (7) IH(1), IIL(1) Ala 23 Scotland (1)
Ala 1.9 Iceland (33) 2L(31), IH(1), Ala 24 United States (1) 2L(1)
G(I), S(1), Ala 26 United States (1) IH(1) G(1)
V(1) Ala 27 United States (1) IL(1)
Ala 1.9 Mexico (1) Ala 28 United States (1)
Ala 1.9 Norway (6) 1H(4), 2H(1) Ala 29 United States (1) 2L(I) V(1)
Ala 1.9 Papua New Guinea (1) Ala 30 United States (2) IH(I), 9L(1) V(1)
Ala 1.9 South Africa (2) 2L(2) S(1) Ala 31 England (1) G(I)
Ala 1.9 Sweden (6) G(1) Ala 32 Canada (1)
Ala 1.9 Switzerland (2) IH(1), 2L(1) Ala 32 England (1) G(1)
Ala 1.9 United States (210) IH(47), 2L(25), Ala 32 United States (3) IL(1), 2H(1) V(1)
2H(4), 7H(1), Ala 33 Canada (1)
IOH(I), 15L(1), Ala 34 United States (1) IL(1) G(1)
18L(1), V(25), Ala 35 South Africa (1) G(5)
Alb 36 United States (1) IL(1) G(1)
Ala 2 Canada (4) IH(1)
Ala 2 United States (1) IH(1) Alc 37 Canada (1) 2L(I)
Ala 3 United States (1) Alc 38 United States (1) IU(1)
Ala 4 Alaska (6) IL(6) Alc 39 Norway (1) 3L(I) S(1)
Ala 4 Canada (5) Alc 40 France (1)
Ala 4 Iceland (1) Alc 40 Spain (1) 3L(I)
Ala 4 Sweden (1) Alc 41 France (1)
Ala 4 United States (19) IL(1I), IH(2) G(1) Alc 42 Switzerland (1) 3L(1)
Ala 5 United States (1) IH(1) G(1) Alc 43 France (1)
Ala 6 United States (1) IL(1) G(1) Alc 43 Switzerland (1) IIL(1)
Ala 7 United States (1) IL(1) Alc 44 United States (1) IL(l)
Ala 1.6 Canada (2) Alc 45 The Gambia (3) IL(1)
Ala 1.6 Alaska (1) 2L(I) Ale 46 Australia (1)
Ala 1.7 Australia (1) V(1) Alc 47 Scotland (1)
Ala 1.8 Norway (1) IL(1) Ale 48 Canada (1) 26L(1)
Ala 8 Australia (1)
AId 49 United States (1)
Ala 8 Hawaii (1) IH(I)
Ala 8 Kenya (4) 3L(3) G(4) AId 50 Ghana (2) G(1), V(1)
Ala 8 South Africa (5) AId 51 Scotland (1)
Ala 8 Switzerland (1) Ale 52 Ghana (1)
Ala 9 Canada (1)
Alf 53
Ala 10 United States (1) Denmark (1)
Ala 11 United States (1) IL(1) A2a54 Canada (1) IL(l)
Ala 13 United States (2) IH(1), 2L(1) A2a55 Canada (1)
Ala 14 Alaska (1) IH(1) A2a56 The Gambia (I)
Ala 15 United States (I) 2L(1) A2a56 United States (1)
Ala 16 Canada (2) A2a57 Hawaii (I)
(continued) A2a57 United States (1) 3L(I)
Global Population Structure oj H influenzae 87
Table 4. (continued) Table 4. (continued)
cap cap
region region
Group Geographic source OMP RFLP Group Geographic source OMP RFLP
ET (no. of isolates) pattern* pattern ET (no. of isolates) pattern* pattern
Ala 58 Malaysia (5) 16L(l) G(l) Ala 71 England (I) S(l)
Ala 12.8 Alaska (3) 3L(3) Ala 72 Iceland (I) 3L(l)
Ala 12.8 Argentina (I) 2L(l) Ala 73 Canada (I)
Ala 12.8 Australia (2) Ala 74 South Africa (I) 2L(l)
Ala 12.8 Canada (72) 3L(6) Ala 12.6 Australia (I)
Ala 12.8 Denmark (2) Ala 12.6 Denmark (I)
Ala 12.8 Dominican Republic (20) Ala 12.6 France (3)
Ala 12.8 England (l) Ala 12.6 Philippines (l) 18L(1)
Ala 12.8 Finland (44) 3L(3) Ala 12.6 Switzerland (I)
Ala 12.8 France (5) 2L(l) Ala 12.6 United States (4) 14L(I), 18L(I) S(l)
Ala 12.8 The Gambia (18) 2L(6) Ala 12.10 Hawaii (I) IIL(l)
Ala 12.8 Ghana (2) S(2) Ala 12.9 Canada (I)
Ala 12.8 Hawaii (4) Ala 12.9 Dominican Republic (l)
Ala 12.8 Japan (10) 3L(3), 16L(I) Ala 12.9 Finland (3)
Ala 12.8 Malaysia (52) 3L(l0), 18L(3), S(2) Ala 12.9 France (I)
IL(I), 2L(1), Ala 12.9 Japan (2) 16L(2)
13.IL(l), Ala 12.9 Netherlands (1)
27L(1) Ala 12.9 Norway (2)
Ala 12.8 New Zealand (4) 3L(4) Ala 12.9 South Korea (5)
Ala 12.8 Norway (5) Ala 12.9 Sweden (5) S(l)
Ala 12.8 Papua New Guinea (22) IL(9), 3L(5), S(3) Ala 12.9 Switzerland (2)
13L(l) Ala 75 Denmark (1) 3L(1)
Ala 12.8 Philippines (6) IL(3), 3L(2), Ala 12.11 Philippines (1) 29L(1)
18L(I) Ala 76 South Africa (l)
Ala 12.8 South Africa (9) 2L(2) S(1) Ala 12.7 Alaska (l4) 3L(14)
Ala 12.8 Scotland (1) Ala 12.7 Australia (1)
Ala 12.8 South Korea (2) Ala 12.7 Canada (23) 3IL(I) S(l)
Ala 12.8 Sweden (14) Ala 12.7 Denmark (I) 3L(l)
Ala 12.8 Switzerland (9) Ala 12.7 England (1)
Ala 12.8 Thailand (7) 2L(3), 3L(4), S(1) Ala 12.7 Hawaii (2)
1L(I) Ala 12.7 Malaysia (1)
Ala 12.8 United States (76) 3L(20), 13L(6), S(2) Ala 12.7 Norway (2)
14L(l) Ala 12.7 Switzerland (4)
Ala 12.8 Uruguay (l) 2L(l) Ala 12.7 United States (27) 3L(9), 13L(3)
Ala 59 Malaysia (I) 3L(I) Ala 77 Switzerland (2) 3L(I)
Ala 59 Thailand (I) IL(I) Ala 78 United States (2) urnt,16L(1) S(l)
Ala 60 Denmark (I) Ala 79 Switzerland (1) 3L(1)
Ala 60 Kenya (4) 3L(1) S(4) Ala 12.5 Alaska (2) 3L(2)
Ala 60 Malaysia (4) 3L(3) Ala 12.5 Argentina (3) 3L(1)
Ala 60 South Africa (1) Ala 12.5 Australia (24)
Ala 60 Sweden (1) Ala 12.5 Canada (63) 3L(7)
Ala 61 Denmark (1) Ala 12.5 Denmark (22) 3L(2)
Ala 62 United States (1) 3L(1) Ala 12.5 Dominican Republic (18)
Ala 63· Norway (1) 3L(1) Ala 12.5 England (12)
Ala 64 United States (I) 3L(1) S(1) Ala 12.5 Finland (23) 3L(2)
Ala 65 Canada (I) Ala 12.5 France (60) 3L(6)
Ala 66 United States (1) IIL(1) S(1) Ala 12.5 Greenland (3)
Ala 67 Denmark (1) Ala 12.5 Hawaii (2)
Ala 67 Finland (1) Ala 12.5 Iceland (3) 3L(3) S(1)
Ala 67 Norway (1) 3L(1) Ala 12.5 New Zealand (11) 3L(11)
Ala 68 Norway (I) Ala 12.5 Netherlands (5) 3L(3)
Ala 68 South Africa (1) Ala 12.5 Norway (16) 3L(3)
Ala 69 Malaysia (4) A2a 12.5 Papua New Guinea (2) 3L(2)
Ala 70 Papua New Guinea (2) Ala 12.5 South Africa (3)
88 Musser et01.
Table 4. (continued) Table 4. (continued)
cap cap
region region
Group Geographic source OMP RFLP Group Geographic source OMP RFLP
ET (no. of isolates) pattern * pattern ET (no. of isolates) pattern* pattern
A2a 12.5 Scotland (13) A2a 102 United States (1) 22L(1) S(1)
A2a 12.5 Spain (69) A2a 103 Alaska (7) 5L(6), 3L(I), S(1)
A2a 12.5 Sweden (34) 5.1L(1)
A2a 12.5 Switzerland (88) 3L(10) A2a 103 United States (1)
A2a 12.5 United States (21) 3L(8) S(1) A2a 104 Switzerland (2) 3L(1)
A2a80 Denmark (1) A2a 105 Canada (1)
A2a80 United States (1) A2a 105 Dominican Republic (1) A2a 81 South Africa (1) 3L(1) A2a 105 South Africa (2)
A2a82 France (2) A2a 105 Switzerland (2)
A2a82 Sweden (6) A2a 106 Alaska (1) 13L(1)
A2a82 United States (1) 3L(I) A2a 107 Canada (1)
A2a 83 Australia (1) A2a 108 Switzerland (1) 3L(1)
A2a84 Canada (1) A2a 108 United States(I)
A2a 85 Canada (1) 3L(1) A2a 109 South Africa (1) 2L(1)
A2a21.8 Alaska (1)
nrnt
A2a 110 Denmark (1) lL(1)A2a 21.8 Dominican Republic (1) A2a 110 Finland (1)
A2a 21.8 Finland (19) lL(3) A2a 111 Canada(I)
A2a 21.8 Iceland (1) lL(1)
A2b 112 Canada (1) A2a 21.8 Malaysia (6) lL(1)
A2a 21.8 Sweden (4) A2b 113 Canada (1)
A2a 21.8 United States (1) lL(1) A2b 114 Alaska (1) 5L(1)
A2a21.9 Sweden (1) S(1) A2c 115 South Africa (1) 2L(1)
A2a 21.5 Australia (3)
A2a86 United States (1) 3L(1) A2d 116 Dominican Republic (1) 16L(1)
A2a87 Finland (1) A2d 117 Dominican Republic (1) 16L(I)
A2a 88 Finland (2) A2d 118 United States (1) 5L(1) S(1)
A2a89 France (1) A2e 21.6 Alaska (12) 13L(12)
A2a 12.0 Alaska (1) 3L(1) A2e 21.6 Canada (2)
A2a 12.0 Australia (2) A2e 21.6 Denmark (1)
A2a 12.0 Canada (4) 3L(I) S(I) A2e 21.6 Guatemala (1)
A2a 12.0 Denmark (1) A2e 21.6 New Zealand (1) 13L(I)
A2a 12.0 Finland (1) A2e 21.6 Papua New Guinea (1) 13L(I)
A2a 12.0 New Zealand (1) 3L(1) A2e 21.6 Philippines (1)
A2a 12.0 Switzerland (1) A2e 21.6 Thailand (1) 13L(1)
A2a90 Canada (1) A2e 21.6 United States (37) 13L(21), l1L(1), S(8)
A2a90 Sweden (1) 3L(I)t
A2a 91 Canada (1) 3L(1) A2e 119 United States (1) l1L(1)
A2a92 United States (1) S(1) A2e 120 Alaska (1) 13L(1)
A2a93 Canada (1) A2e 121 Canada (1)
A2a93 Dominican Republic (1) A2e 121 Hawaii (1) 13L(1)
A2a93 Finland (1) A2e 122 United States (2) S(2)
A2a 93 Scotland (2) A2e 123 United States (1)
A2a 93 Spain (1) A2e 124 Alaska (1) 13L(1)
A2a93 Sweden (2) A2e 125 United States (1)
A2a94 United States (1) A2e 126 Denmark (1)
A2a 95 United States (2)
A2a96 Denmark (1) A2f 127 Denmark (1)
A2a96 Greenland (1) A3 128 Hawaii (1)
A2a 97 Canada (1)
A2a98 United States (1) A4129 Canada (1)
A2a99 Malaysia (2) 3L(1) A5 130 South Africa (1) lL(1)
A2a 100 Canada (17) 3L(3) S(1)
A2a 100 Finland (2) Bla 131 United States (1)
A2a 101 United States (1) 14.1L(I) S(1) Bla 132 Malaysia (1) 6U(1)
Global Population Structure ofH. influenzae 89
Table 4. (continued) Table 4. (continued)
cap cap
region region
Group Geographic source OMP RFLP Group Geographic source OMP RFLP
ET (no. of isolates) pattern * pattern ET (no. of isolates) pattern* pattern BIb 25.6 Canada (6) 6U(1) 5(2) B2b 166 Papua New Guinea (1) aIU(1) aT(1)
BIb 25.6 Malaysia (4) 6U(2) B2b 167 The Gambia (2) aIU(2) aT(2)
BIb 25.6 Papua New Guinea (26) 6U(4) 5(1) B2b 167 Malaysia (7) aIU(7) aT(7)
BIb 25.6 Thailand (1) 6U(1) B2b 168 Malaysia (1) aIU(1) aT(1)
BIb 25.6 United States (10) 6U(9) 5(3) B2c 169 Malaysia (2) aIU(2) aT(2)
BIb 133 United States (1) 5(1)
BIb 134 Canada (1) B2d 170 Kenya (1) aIU(1) aN(1)
BIb 135 Papua New Guinea (2) 6U(2) B3 171 The Gambia (2) BIb 136 Hawaii (1)
BIb 137 Denmark (2) B4172 Japan (sero b) (1)
BIb 137 France (1) B4173 The Gambia (sero a) (3) a5L(3) aN(3)
BIb 138 Netherlands (1) 6U(1) 5(1) B4173 Malaysia (sero a) (1) aIU(1) aT(1) BIb 138 Papua New Guinea (1) 6U(1) B4 174 Kenya (sero a) (1) a5L(1) aN(l)
BIb 139 Kenya (I) 6U(1) B5175 Iceland (I)
BIb 139 Malaysia(I) 5(1) CI 176 Switzerland (I)
BIb 139 Sweden (1)
BIb 140 Kenya (1) 5(1) Dla 177 United States (1) c1(1)
BIb 141 Canada (2) Dla 178 Malaysia (1) cl(l)
BIb 141 The Gambia (5) 6U(3) Dlb 179 Unknown (1)
BIb 141 South Africa (4) Dlb 180 Malaysia (3) c1(3)
BIb 141 Sweden (2) Dlb 181 England (1) cl(1)
BIb 142 Hawaii (1)
BIb 143 United States (1) 23U(1) 5(1) 02 182 Unknown (1) c1(1)
BIb 144 The Gambia (1) 02 183 England(I) cl(1)
BIb 145 Alaska (1) 6U(1) 03 184 United States (1) cl(1)
BIb 145 Canada (1)
04185 England (1) c2(1)
BIb 145 Dominican Republic (1)
BIb 145 New Zealand (2) 6U(1), 12U(1) 5(1) 05 186 Kenya (1) c2(1)
BIb 145 Papua New Guinea (3) 5(1) EI 187 Kenya (1) BIb 145 United States (1) 24U(I) 5(1)
BIb 146 United States (1) FI 188 England (1) e(1)
BIb 147 Dominican Republic (6) FI 189 England (5) e(2)
BIb 148 Dominican Republic (1) FI 190 England (2) e(2)
BIb ]49 Dominican Republic (1) 6U(1) F2a 191 England (2)
BIb 150 South Africa (2) 6U(1) F2a 191 United States (3) e(1)
BIb 150 Switzerland (2) F2a 191 Unknown (1)
BIb 151 Switzerland (2) 6U(I) S(1) F2a 192 United States (1)
BIb 152 South Africa (12) 6U(2) S(1) F2a ]93 England (3) e(l)
BIb 153 South Africa (1) F2a 194 Malaysia (1) e(1)
Blc 154 Dominican Republic(1) F2a 195 Unknown (3)
F2a 196 England (2) e(1)
BId 155 Alaska (1) IU(1) F2a 197 England (4)
Ble 156 South Korea (1) F2a 198 England (1) e(1)
Btf 157 England (11) d(9) F2a 199 Unknown (1) e(1)
F2a 200 Unknown (I) e(1)
Btf 158 United States (1) d(1)
F2a 201 England (1) e(1)
Blf 159 England (4) d(2)
Blf 160 United States (1) F2b 202 England (1) Anom:t:
air
161 Papua New Guinea (1) d(1) F2b 203 Papua New Guinea (1) e(1)BIg 162 Malaysia (8) d(8) F2c 204 England (31) e(3)
BIg 163 Kenya (1) d(1) F2c 205 Kenya (2)
B2a 164 United States (1) alU(I) aT(1) F2c 206 Malaysia (1) e(1)
F2c 207 England(1) e(l)
B2b 165 Papua New Guinea (2) aIU(2) aT(2) F2c 208 England (2) e(1)
90 Musser et al.
Table 4. (continued) Table 4. (continued)
cap cap
region region
Group Geographic source OMP RFLP Group Geographic source OMP RFLP
ET (no. of isolates) pattern* pattern ET (no. of isolates) pattern* pattern
F2c 209 England (1) KId 255 United States (1)
F2c 210 England (2) e(1) K2 256 United States (1) 0(1) F2c 211 England (1) e(1) K2 256 Unknown (1) F2c 212 England (1) K2 257 England (1) F2c 213 Malaysia (1) K2 258 England (1) UnN(1) F2c 214 England (2) e(2) K2 259 England (1) 0(1) F2c 215 England (5) e(I) K2260 England (7) O(1),UnN(1) F2c 216 England (6) e(3) K2 261 England (1) 0(1) F2c 217 England (1) e(I) K2 262 England (2) 0(1)
GI2I8 Kenya (1) e(1) K2 262 Unknown (2) 0(2)
Hia 219 England (13) a2H(10), a7H(3) aM(13) K2 263 England (3) 0(1)
Hia 219 Unknown (1) a2H(I) aM(I) K2264 England (1) UnN(1)
Hia 220 England (1) a4H(1) aM(I) K2 265 England (5) 0(3)
Hia 221 England (1) a2H(1) aM(1) K2 266 England (4) Hib 222 England (1) a6H(I) aM(1) L1 267 Kenya (1)
Hlb 223 England (1) a6H(1) aM(I) * For most geographic source groups, strains were randomly Hlb 224 England (3) a6H(3) aM(3) selected for OMP subtype analysis. The OMP subtype designations Hib 225 England (1) a6H(I) aM(1) for serotype b isolates are those reported by the Granoff laboratory Hib 226 England (1) a6H(1) aM(1) [8, 19], and serotype a OMP patterns have been distinguished by Ila 227 England (2) a4H(2) aM(2) the Moxon laboratory [25]. To avoid confusion, serotype a pattern Ila 228 England (1) a4H(I) aM(1) designations are preceded by the letter "a." Note that serotype a and Ila 229 England (3) a4H(2), a8H(1) aM(3) serotype b strains with the same OMP type designation may actual-ly not be identical in OMP electrophoretic pattern. Thecap region
Ilb 230 Dominican Republic (1) a5H(1) aM(1) RFLP patterns have been reported previously [24, 26]. The num-JIa 231 United States (1) ber of isolates identified of each OMP pattern orcap region RFLP JIa 232 United States (1) 0(1) pattern is given in parentheses.
JIb 233 United States (1) 8-H§(1) tPattern similar to, but not identical with, designated OMP subtype.
JIb 234 Alaska (1) 8H(1)
:j:Anomalous.
JIb 235 Alaska (2) 8H(2) 0(1)
§ Similar to type 8 but apparently lacking the PI band. JIb 235 Norway (1) 30H(I)
NUnclassified. JIb 236 Canada (1) 8H(I)
JIb 236 United States (1) 8H(1) JIb 237 United States (1) 8H(1)
J2238 South Africa (1) 25L(1) types account for 70010 of all serotype b strains in 13 239 United States (1) I7H(1) the sample, and, moreover, 81070 of all type b strains KIa 240 United States (1) examined belong to only nine of the 280 multilocus
enzyme genotypes identified (table 4).
Kib 241 England (2) 0(1)
Kic 242 England (1) F(I)
Kic 243 England (1) capRegion RFLP Patterns and Genotypic Diversity
Kic 244 Malaysia (1) F(1) incapRegion RFLP Pattern
Kic 245 Malaysia (1)
Klc 246 Malaysia (1) Thecap region is a 20- to 40-kilobase (kb) segment Kic 247 Malaysia (1) of the chromosome containing genes necessary for Kic 248 Malaysia (1) the production of capsule polysaccharide [33, 36,
Kic 249 Malaysia (2) F(1)
37]. Previously 14cap region RFLP patterns were
Klc 250 Malaysia (1) F(I)
identified among 222 isolates of six serotypes
exam-Kic 251 Malaysia (2) F(I)
Kic 252 Malaysia (1) ined [21]. The approximate sizes (in kilobases) of the Kic 253 Malaysia (1) F(1) DNA fragments characterizing each pattern are
in-Kic 254 Malaysia (1) F(1) dicated in figure 2; their distributions among the
Global Population Structure ofH. influenzae
I and described in detail elsewhere [21]. All RFLP patterns were serotype specific.
For both serotypes a and b, thecapregion pat-terns of isolates in the two primary phylogenetic di-visions were very different. The a(T) and a(N) pat-terns of serotype a strains in division I have three of four fragments of common size, but fragments of similar size do not occur in the a(M) pattern of serotype a strains in divisionII. Serotype b strains in divisionIhad patterns b(S), b(V), and b(G), which share most of their fragments, whereas serotype b strains in divisionIIhad the b(O) pattern, which has only two of its seven fragments (2.1 and 2.7 kb, which are type b specific) in common with the other sero-type b patterns.
Each of the 14capregion RFLP patterns occurred in isolates of several multilocus genotypes, with as many as 30 ETs being identified among the 53 iso-lates with pattern b(S). For patterns b(S), b(O), d, and e, mean genetic diversity(H) among ETs was roughly equivalent to that recorded for ETs of all isolates of the same serotype, whereas among ETs of the other probe patterns,Hwas, on average, equal to only640J0of that ofETs of the same serotype (ta-ble 5) [21].These results reflect the circumstance that cappatterns are found in isolates that are nonran-dom samples of clones of each serotype.
Genotypic Diversity Within OMP Patterns of Serotype b Strains
The OMP electrophoretic patterns of 587 serotype b isolates were determined and assigned to 33 cate-gories. These include 25 patterns previously de-scribed [19, 20] and eight newly identified subtypes, as follows: 13.1L, which is similar to but distinguish-able from 13L, and 25L, 26L, 27L, 29L, 31L, 30H, and 12U.Most OMP patterns were confined to some-what closely related clones, with an average of 37070 of the total genetic diversity and 54070 of serotype b genetic diversity being apportioned among ElS rep-resented by isolates of the nine more common OMP subtypes (table 6).
OMP types in cluster Al were IH (80 isolates), 2H (11 isolates), IL (33 isolates), 2L (115 isolates), 3L (three isolates), 11L (two isolates), and 4H, 19H, 9L, 15L, 18L, 26L, and IU, each of which was recorded in a single isolate. Cluster A2 contained OMP types IL (26 isolates), 2L (16 isolates), 3L (172 isolates), 5L (eight isolates), llL (four isolates), 13L (51 isolates), 14L (two isolates), 16L (six isolates),
91
Table S. Mean genetic diversity(H)among ETswithincap
locus RFLP patterns ofH. influenzae.
No. of Mean no. of No. of
Pattern isolates alleles ETs. BETs
a(T) 17 1.77 7 0.235 a(N) 5 1.29 3 0.196 a(M) 30 1.94 12 0.306 b(G) 14 1.88 10 0.261 b(V) 14 1.53 6 0.208 b(S) 53 2.65 30 0.314 b(O) 4 1.59 3 0.373 c(I) 9 1.82 7 0.283 c(2) 2 1.29 2 0.294 d 22 1.41 6 0.161 e* 30 2.65 23 0:257 f(F) 7 1.47 7 0.148 f(O) 12 1.53 8 0.183 f(un)t 3 1.29 3 0.176 Total 222 1.72 124 0.467
* One isolate with a slightly anomalous hybridization pattern was not included in the sample.
t un = unclassified.
18L (six isolates), and one isolate each of 5.1L, 13.1L, 14.1L, 22L, 27L, 29L, and 31L. A116U isolates were in cluster BI, and 8Hisolates were confined to clus-ter J1.
Mean genetic diversity per locus among ETs syn-thesizing the H, L, or U outer membrane protein PI was, on average, 81070, 50070, and 47070, respectively, of that in the total sample of encapsulated strains and1'\160070 of that recorded for serotype b strains
Table6. Genetic diversity in relation to OMP pattern and PI type in serotype bH. influenzae.
Mean
No. of No. of no. of
OMP isolates ETs BETs alleles
IH 80 10 0.122 1.6 lL 59 19 0.223 2.2 2L 117 14 0.205 1.9 3L 180 30 0.162 2.8 IlL 6 6 0.224 1.7 13L 50 7 0.171 1.5 16L 7 7 0.182 1.6 6U 33 11 0.165 1.6 8H 6 4 0.118 1.2 H(divisionI) 94 11 0.122 1.6 H(divisionII) 8 5 0.216 2.1 H(pooled) 102 16 0.377 2.6 L 447 76 0.233 3.8 U 38 14 0.218 2.1 Total 587 103 0.319 4.4
92 Musser et al.
Sero- RFLP Representative RFlP Cluster N n type gm pattern OMPTypes .Iga pattern
A1a 35 549 b b(S), b(V). b(G) 1H,1l.2H,2l 1\ A1b 1 1 b 1\ A1c 12 16 b b(S) 1l,2l,3l,11l,26L 1\ A1d 3 4 b b(V). b(G) 1H A1e 1 1 b A1f 1 1 b A2a 69 1189 b b(S) 1l,2l.3l.13l,18l A2b 3 3 b 5l A2c 1 1 b 2l A2d 3 3 b b(S) 5l,16L A28 9 67 b b(S) 11l,13l A2f 1 1 b A3 1 1 b A4 1 1 b A5 1 1 b 1L B1a 2 2 b 6U B1b 22 114 b b(S) 6U,12U,23U,24U III B1c 1 1 b B1d 1 1 b 1U B18 1 1 b B1f 5 18 d d B19 2 9 d d B2a 1 1 a a(T) 1U B2b 4 13 a a(T) 1U B2c 1 2 a a(T) 1U B2d 1 1 a a(N) 1U B3 1 2 b
B4 3 6 a,b a(N), a(T) 1U,5l
B5 1 1 b C1 1 1 b 01a 2 2 c c(1) 01b 3 5 c c(1) 02 2 2 c c(1) 03 1 1 c c(1) 04 1 1 c c(2) 05 1 1 c c(2) E1 1 1 c F1 3 8 e e(1), e(2) F2a 11 24 e e(1) F2b 2 2 e e(1)
F2c 14 57 e e(1), e(2), e(3) G1 1 1 e e(1) H1a 3 16 a a(M) 2H,4H H1b 5 7 a a(M) 6H 11a 3 6 a a(M) 4H 11b 1 1 a a(M) 5H