The effect of retinyl palmitate added to iron-fortified maize
porridge on erythrocyte incorporation of iron in African children
with vitamin A deficiency
Lena Davidsson*, Pierre Adou, Christophe Zeder, Thomas Walczyk and Richard Hurrell
Laboratory for Human Nutrition, Institute of Food Science and Nutrition, Swiss Federal Institute of Technology, PO Box 474, CH-8803 Ru¨schlikon, Switzerland and Institut National de Sante´ Publique, Adjame´,PO Box 47, 01 Abidjan, Coˆte d’Ivoire
(Received 17 June 2002 – Revised 26 March 2003 – Accepted 22 April 2003)
Retinyl palmitate added to Fe-fortified maize bread has been reported to enhance Fe absorption in adult Venezuelan subjects but not in Western Europeans. It is not known to what extent these results were influenced by differences in vitamin A status of the study subjects. The objective of the present study was to evaluate the influence of retinyl palmitate added to Fe-fortified maize porridge on erythrocyte incorporation of Fe in children with vitamin A deficiency, before and after vitamin A supplementation. Erythrocyte incorporation of Fe-stable isotopes was measured 14 d after intake of maize porridge (2·0 mg Fe added as ferrous sulfate) with and without added retinyl pal-mitate (3·5 mmol; 3300 IU). The study was repeated 3 weeks after vitamin A supplementation (intake of a single dose of 210 mmol retinyl palmitate; ‘vitamin A capsule’). Vitamin A status was evaluated by the modified relative dose – response (MRDR) technique. Retinyl pal-mitate added to the test meal reduced the geometric mean erythrocyte incorporation of Fe at baseline from 4·0 to 2·6 % (P¼ 0·008, n 13; paired t test). At 3 weeks after vitamin A supplementation, geometric mean erythrocyte incorporation was 1·9 and 2·3 % respectively from the test meal with and without added retinyl palmitate (P¼ 0·283). Mean dehydroretinol:retinol molar ratios were 0·156 and 0·125 before and after intake of the single dose of 210 mmol retinyl palmitate; ‘vitamin A capsule’ (P¼ 0·15). In conclusion, retinyl palmitate added to the labelled test meals significantly decreased erythrocyte incorporation of Fe in children with vitamin A deficiency at baseline but had no statistically significant effect 3 weeks after vitamin A supplementation. The difference in response to retinyl palmitate added to Fe-fortified maize porridge on erythrocyte incorporation of Fe before and after intake of the vitamin A capsule indicates, indirectly, changes in vitamin A status not measurable by the MRDR technique. The lack of conclusive data on the effect of retinyl palmitate on Fe absorption indicates the complexity of the interactions between vitamin A status, dietary vitamin A and Fe metabolism.
Iron: Vitamin A: Retinyl palmitate: Children: Modified relative dose – response technique
Interactions between vitamin A and Fe metabolism have been demonstrated in several human studies and the current knowledge of the effect of vitamin A on haemato-logical indicators was recently reviewed by Fishman et al. (2000) and by Semba & Bloem (2002). Substantial evidence exists that vitamin A deficiency is associated with anaemia and that vitamin A supplementation also can be expected to increase haemoglobin (Hb) concen-trations in anaemic children and pregnant women. The mechanisms by which vitamin A deficiency induces anaemia have not been clearly demonstrated but have been suggested to include impaired differentiation and pro-liferation of haematopoietic cells, disturbed erythropoietin synthesis, reduced mobilisation of body Fe stores and/or effects on Fe metabolism through sequestration of Fe
during the acute-phase response to infection (for reviews, see Fishman et al. 2000; Semba & Bloem, 2002).
In addition, interactions between vitamin A and Fe, resulting in enhanced Fe absorption in human subjects, have been suggested (Layrisse et al. 1997; Garcia-Casal et al. 1998). The enhancing effect of retinyl palmitate on Fe absorption reported in adult Venezuelan peasants was recently evaluated but not confirmed in healthy Western European adults (Walczyk et al. 2003). The reasons for the contradictory results reported from Latin America and Europe are unknown. Although a number of differences in the experimental design can be identified between the two study sites, all studies were based on the measurement of erythrocyte incorporation of Fe iso-topes (radioactive or stable) as a proxy for Fe absorption.
* Corresponding author: Dr Lena Davidsson, fax þ 41 1 704 5710, email lena.davidsson@ilw.agrl.ethz.ch
Abbreviations:DR:R, dehydroretinol:retinol; Hb, haemoglobin; MRDR, modified relative dose – response; TfR, transferrin receptor. qThe Authors 2003
However, differences in nutritional status between the study populations can be speculated to have influenced the results. Until now, no information has been available on the effect of retinyl palmitate on erythrocyte incorpor-ation of Fe in individuals with vitamin A deficiency.
The aim of the present study was to evaluate the effect of retinyl palmitate on erythrocyte incorporation of Fe from a test meal based on maize porridge in African schoolchildren with vitamin A deficiency, before and after supplementation with 210 mmol (200 000 IU) retinyl palmitate. Nutritional status was evaluated by the modified relative dose – response (MRDR) technique and by plasma transferrin receptor (TfR) concentration, respectively, as these indicators of vitamin A and Fe status have been demonstrated not to be influenced by infections (Tanumihardjo et al. 1996b; Staubli Asobayire et al. 2001; Wieringa et al. 2002). Erythrocyte incorporation of Fe stable isotopes was measured 14 d after intake of labelled test meals (2·0 mg Fe added as ferrous sulfate), served with and without added retinyl palmitate (3·5 mmol; 3300 IU).
Subjects and methods Subjects
The sample size was based on previous data on erythrocyte incorporation of Fe in infants (Davidsson et al. 1994). It was estimated that ten children would be a sufficient sample size to detect a nutritionally significant difference in erythrocyte incorporation of 50 % with 90 % power and a type I error rate of 5 %. Thirteen children were included to allow for dropouts. The study was implemented in the northern part of Coˆte d’Ivoire, in a region where a high prevalence (34 %) of low plasma retinol concentration (, 0·7 mmol/l) in schoolchildren, indicating vitamin A deficiency in this population group (Sommer & Davidson, 2002), had been observed in a previous survey (Staubli Asobayire, 2000). Based on an initial screening study by the Institut National de Sante´ Publique, Abidjan, thirteen schoolchildren living in one of the villages included in our previous study of nutritional status (Staubli Asobayire et al. 2001) with low plasma retinol (, 0·7 mmol/l) were invited to participate in the study. All children were enrolled in the study at the same time. Children, their parents and/or guardians and their teachers were fully informed about the aims and pro-cedure of the study. Informed oral consent was obtained from at least one parent or guardian of each child. Oral con-sent was obtained from the village chief. At the end of the study, children with Fe deficiency or Fe-deficiency anaemia were treated with medicinal Fe. As distribution of vitamin A capsules is irregular in this region, all schoolchildren in the village were given a single dose of 210 mmol (200 000 IU) retinyl palmitate at the end of the study.
The study protocol was reviewed and approved by the ethical committee of the Children’s Hospital, Zu¨rich and by the Institut National de Sante´ Publique, Abidjan.
Test meals and study design
Individual servings of stiff maize porridge were prepared from 50 g maize flour (‘polenta’; Migros, Zurich,
sSwitzerland), 200 g water and 6 g sugar. Solutions of stable isotopes of Fe (57FeSO4 or 58FeSO4) were added
immediately before serving. Test meal A was served with-out added retinyl ester (retinyl palmitate) while test meal B contained 3·5 mmol (3300 IU) retinyl palmitate. Retinyl palmitate was added as water-soluble retinyl palmitate (Hoffmann LaRoche, Basel, Switzerland) as in previous studies (Layrisse et al. 1997; Garcia-Casal et al. 1998; Walczyk et al. 2003). A working solution of retinyl palmi-tate was prepared each day by mixing pre-weighed quan-tities of retinyl palmitate and water. Individual doses were added to the test meals immediately before consump-tion. Each test meal was administered twice, on four con-secutive days, after an overnight fast. Test meal A (without added retinyl palmitate; labelled with 57Fe) was served on days 1 – 2 and test meal B (with added retinyl palmitate; labelled with 58Fe) on days 3 and 4. Mineral water (Volvic; Danone, Paris, France) was used for prep-aration of test meals and served as a drink (200 g). As one hypothesis was that retinyl palmitate could influence Fe absorption at the mucosal level, the feeding of meals 1 and 2 in a random order was considered inappropriate. All meals were fed under close supervision and no food or drink was allowed for 3 h following intake of test meals. On day 19, the content of a vitamin A capsule (210 mmol retinyl palmitate, 200 000 IU; Hoffmann LaRoche) was squeezed directly into the mouth of each child. At 3 weeks later, a venous blood sample was drawn and labelled test meals with and without added retinyl palmi-tate were administered in an identical manner as during the first part of the study. The final blood sample was drawn 14 d after intake of the last test meal (day 57).
Modified relative dose – response test
Vitamin A status was evaluated by the MRDR test accord-ing to Tanumihardjo et al. (1996a) on days 18 and 57. After an overnight fast, each child was given 7·0 mmol (2·0 mg) 3,4-didehydroretinol (vitamin A2) dissolved in
oil. Doses of 3,4-didehydroretinol (225 ml) were adminis-tered directly into the mouth, using a Gilson Microman pipette with positive displacement mechanism (Gilson, Villiers-le-Bel, France). A high-fat snack (peanut butter sandwiches) was served after intake of 3,4-didehydroreti-nol. Venous blood samples were drawn 4 – 5 h later. Molar ratios of dehydroretinol:retinol (DR:R)$ 0·06 were used to define vitamin A deficiency.
Blood sampling and analyses
Venous blood (5 ml) was collected in EDTA-treated vacutainer tubes at each sampling. Baseline blood samples were drawn at the start of the study (day 1) and on day 40 (second baseline). In addition, blood samples were drawn on days 18 and 57 (14 d after intake of the last test meal in each series of studies). Blood samples were kept cool and protected against light until separation of plasma. Hb was determined in duplicate by the cyano-methaemoglobin method (Sigma Diagnostic Kits, St Louis, MO, USA). A three-level quality-control
material (Dia-HT-1,2,3; Diamed AG, Cressier sur Morat, Switzerland) was analysed in parallel.
Plasma samples were transported to Zu¨rich frozen (2 208C) and protected against light until analysis. Plasma retinol was analysed by HPLC (Merck-Hitachi, Tokyo, Japan) on a reversed-phase column (Hypersil ODS RP-18 200 £ 4·6 mm, 3 mm; Crom, Herrenberg-Kayh, Germany) according to Tanumihardjo et al. (1994a). A com-mercial reference material (NIST 968c; National Institute of Standards and Technology, Gaithersburg, MD, USA) was analysed together with the plasma samples. CV for retinol and 3,4-didehydroretinol analyses were 5 and 12 % respect-ively. The concentration of circulating TfR was measured by ELISA, using a commercial kit (Ramco Laboratories, Houston, TX, USA). The CV for TfR analysis was 4 %.
Stable-isotope labels
Stable-isotope solutions were prepared from isotopically enriched elemental Fe (Chemgas, Boulogne, France) by dissolution in diluted H2SO4. The isotopic composition of
Fe solutions was determined by negative thermal ionis-ation – MS, using a magnetic sector instrument (MAT 262; Finnigan MAT, Bremen, Germany). Fe concentrations of the solutions were determined by isotope dilution MS against a diluted commercially available Fe standard (Titrisol; Merck, Darmstadt, Germany).
Individual doses (2·0 mg 57Fe and 1·75 mg 58Fe per administration) were prepared by weighing the correspond-ing amounts of solution into Teflon containers. Containers were flushed with Ar to avoid oxidation. Fe with normal isotopic composition (FeSO4; Merck) was added to the 58FeSO
4solution to a total content of 2·0 mg Fe per dose.
Analysis of isotopic composition of blood samples Blood samples were analysed in duplicate for Fe isotopic composition under chemical blank monitoring. Sampling handling was done under clean laboratory conditions to reduce the risk of sample contamination. Whole blood samples were mineralised in a HNO3– H2O2mixture, using
microwave digestion. Fe was separated from the matrix by anion-exchange chromatography following a solvent/solvent extraction step into diethyl ether (Beer & Heumann, 1993; Kastenmayer et al. 1994). All isotopic analyses were per-formed by negative thermal ionisation – MS according to Walczyk (1997) using a magnetic sector field mass spec-trometer (MAT 262; Finnigan MAT) equipped with a multi-collector system for simultaneous ion beam detection. Because of the high enrichment of the stable-isotope labels and the low amounts of57Fe and58Fe expected to be incor-porated into erythrocytes, data were normalised for the natu-ral 54Fe:56Fe isotope ratio (Taylor et al. 1992). Relative differences in isotopic ratios between samples analysed in duplicate were 0·006 % for the57Fe:56Fe isotope ratio and 0·02 % for the58Fe:56Fe isotope ratio.
Calculation of iron erythrocyte incorporation
Based on the shift in Fe isotope ratios in blood samples and the amount of Fe circulating in the body, the amounts
of 57Fe label and 58Fe label present in the blood 14 d after test meal administration were calculated. Calculations were based on principles of isotope dilution and considered that the Fe stable-isotope labels were not mono-isotopic (Walczyk et al. 1997). Circulating Fe was calculated based on blood volume and Hb concentration, as described by Kastenmayer et al. (1994). Blood volume calculations were based on height and weight according to Linderkamp et al. (1977). Corrections were made for the altered base-line Fe isotope ratios during the second phase of the study.
Food analysis
Fe and Ca in the test meal were analysed by atomic absorption spectrometry (SpectrAA 400; Varian, Mulgrave, Australia) using a standard addition technique after digestion in a microwave system (MLS 1200; MLS GmbH, Leutkirck, Germany) in a mixture of HNO3– H2O2. Phytic acid (inositol
hexaphosphate) was measured by HPLC according to Sandberg & Ahderinne (1986). CV for Fe, Ca and phytic acid analyses were 5, 3 and 4 % respectively.
Statistics
Paired t tests were used for the evaluation of data, i.e. for comparisons of Hb, TfR, plasma retinol concentrations and DR:R ratios at different time points as well as for compari-sons of erythrocyte incorporation of Fe from test meals with and without added retinyl palmitate at baseline and 3 weeks after intake of the vitamin A capsule. In addition, paired t tests were used to compare erythrocyte incorpor-ation of Fe from test meals without added retinyl palmitate at baseline and 3 weeks after intake of the vitamin A cap-sule as well as to compare erythrocyte incorporation of Fe from test meals with added retinyl palmitate at the two time points. Fe erythrocyte incorporation data were log-transformed before statistical analysis and are presented as geometric means +1 SD, 2 1SD. Other results are pre-sented as arithmetic means and standard deviations.
Results
Four girls and nine boys (6 – 13 years old) participated in the study. Fe status did not change significantly during the study. Hb concentration was 110 (SD8) g/l at baseline and 106 (SD 11) g/l at the second baseline (day 40, P¼ 0·179); six and eight children were anaemic (Hb, 110 g/l) at baseline and on day 40 (Table 1). TfR concentration was 9·3 (SD 3·3) and 8·8 (SD 2·8) mg/l at these two time points (P¼ 0·255); seven children were Fe-deficient (TfR. 8·5 mg/l) (Table 1). Five children were Fe-deficient anaemic (Hb, 110 g/l and TfR. 8·5 mg/l) on days 1 and 40. Individual values for plasma retinol and MRDR are presented in Table 2. At each time point, seven to nine children had plasma retinol concentration below 0·7 mmol/l. Plasma retinol at baseline (0·659 (SD 0·182) mmol/l) was not significantly different from plasma retinol on day 40 (0·650 (SD 0·202) mmol/l; P¼ 0·80). Vitamin A deficiency was clearly demonstrated as all children had elevated DR:R ratios ($ 0·06) on day 18. Vitamin A liver stores were not improved significantly
after vitamin A supplementation (intake of a single dose of 210 mmol retinyl palmitate; ‘vitamin A capsule’). Mean DR:R decreased from 0·156 (day 18) to 0·125 (day 57), but this difference was not statistically significant (P¼ 0·15). On day 57, only one child had a DR:R ratio# 0·06.
Each test meal contained 0·19 mg native Fe, 20 mg Ca and 160 mg phytic acid (inositol hexaphosphate). Individ-ual values for erythrocyte incorporation of Fe from the
test meal, without and with added retinyl palmitate, are presented in Table 1. At baseline, erythrocyte incorporation of Fe was significantly lower from the test meal with added retinyl palmitate (geometric mean 2·6 v. 4·0 %; P¼ 0·008). No significant difference in erythrocyte incorporation of Fe from test meals with or without added retinyl palmitate was observed when the study was repeated 3 weeks after the intake of a single dose of 210 mmol retinyl palmitate (‘vitamin A capsule’; geometric mean 1·9 v. 2·3 %, Table 1. Haemoglobin (Hb) and transferrin receptor (TfR) concentrations and fractional erythrocyte incorporation from test meals with and without added retinyl palmitate at baseline and 3 weeks after intake of a vitamin A capsule (single dose of 210 mmol retinyl palmitate) in
thirteen schoolchildren* Baseline 3 weeks after vitamin A supplementation Fe erythrocyte incorporation (%) Fe erythrocyte incorporation (%) ID and sex Age (years) Hb (g/l) TfR (mg/l) No retinyl palmitate added 3·5 mmol retinyl palmitate added Hb (g/l) TfR (mg/l) No retinyl palmitate added 3·5 mmol retinyl palmitate added 1 F 8 104 9·4 5·4 3·8 94 9·2 1·1 1·1 2 F 6 109 13·9 6·6 6·7 106 10·4 4·9 2·8 3 F 6 110 6·3 2·4 0·8 119 4·5 1·7 1·0 4 M 7 101 9·4 4·4 4·7 112 10·4 4·0 3·2 5 M 6 118 9·1 0·8 1·2 120 9·6 1·1 0·3 6 M 8 104 9·5 4·1 2·2 91 9·6 0·7 1·1 7 M 9 118 13·0 3·2 1·3 94 14·5 1·5 1·6 8 M 12 92 16·6 2·6 1·2 96 12·4 2·3 1·6 9 M 8 123 5·9 3·3 2·9 120 6·8 3·2 1·9 10 M 13 108 7·3 8·4 4·2 107 7·6 10·7 20·4 11 M 12 120 6·0 4·6 1·5 109 6·0 7·0 3·8 12 F 10 110 7·8 4·2 4·6 114 6·6 1·1 1·9 13 M 12 112 7·3 10·8 6·5 91 6·5 1·9 2·2 Geometric mean 4·0 2·6 2·3 1·9 þ 1SD 7·8 5·3 5·2 5·0 21SD 2·1 1·2 1·0 0·7 P value† 0·008 0·283
ID, identification number; F, female; M, male. * For details of procedures, see p. 338.
† P values based on log-transformed data and paired t tests.
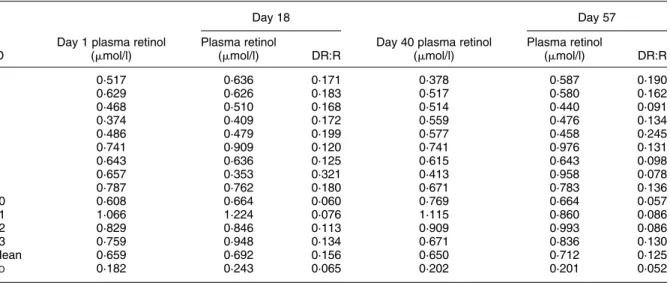
Table 2. Plasma retinol concentration and dehydroretinol:retinol (DR:R) molar ratios at baseline (days 1 and 18) and after intake of a vitamin A capsule (single dose of 210 mmol retinyl palmitate) (days 40 and 57) in thirteen schoolchildren*
Day 18 Day 57
ID
Day 1 plasma retinol (mmol/l)
Plasma retinol
(mmol/l) DR:R
Day 40 plasma retinol (mmol/l) Plasma retinol (mmol/l) DR:R 1 0·517 0·636 0·171 0·378 0·587 0·190 2 0·629 0·626 0·183 0·517 0·580 0·162 3 0·468 0·510 0·168 0·514 0·440 0·091 4 0·374 0·409 0·172 0·559 0·476 0·134 5 0·486 0·479 0·199 0·577 0·458 0·245 6 0·741 0·909 0·120 0·741 0·976 0·131 7 0·643 0·636 0·125 0·615 0·643 0·098 8 0·657 0·353 0·321 0·413 0·958 0·078 9 0·787 0·762 0·180 0·671 0·783 0·136 10 0·608 0·664 0·060 0·769 0·664 0·057 11 1·066 1·224 0·076 1·115 0·860 0·086 12 0·829 0·846 0·113 0·909 0·993 0·086 13 0·759 0·948 0·134 0·671 0·836 0·130 Mean 0·659 0·692 0·156 0·650 0·712 0·125 SD 0·182 0·243 0·065 0·202 0·201 0·052
ID, identification number.
P¼ 0·283). Erythrocyte incorporation of Fe from test meals without added retinyl palmitate was significantly higher (P¼ 0·029) at baseline (geometric mean 4·0 %) as com-pared with on day 40 (geometric mean 2·3 %). No statisti-cally significant difference was found for erythrocyte incorporation of Fe from test meals with added retinyl pal-mitate (P¼ 0·253) at the two time points (geometric mean 2·6 and 1·9 % respectively).
Discussion
A major finding in the present study was the different response to retinyl palmitate added to an Fe-fortified test meal on erythrocyte incorporation of Fe before and after vitamin A supplementation (intake of a single dose of 210 mmol retinyl palmitate; ‘vitamin A capsule’) in chil-dren with vitamin A deficiency. At baseline, the addition of retinyl palmitate to the test meal significantly reduced the geometric mean erythrocyte incorporation of Fe from 4·0 to 2·6 %. When the study was repeated 3 weeks after intake of a vitamin A supplement (210 mmol retinyl palmi-tate), no statistically significant difference in erythrocyte incorporation of Fe from the test meal with and without added retinyl palmitate was observed (geometric mean 1·9 v. 2·3 %). It is probable that the different response to added retinyl palmitate on erythrocyte incorporation of Fe from the labelled test meals was due to improved vita-min A status in the second phase of the study, although these changes were not measurable by analysis of plasma-retinol concentration or by using the MRDR technique.
The results from the present study, as well as those from our earlier study in healthy, adult Europeans (Walczyk et al. 2003), are not in agreement with the reports about an enhancing effect of retinyl palmitate on Fe absorption from Venezuela (Layrisse et al. 1997; Garcia-Casal et al. 1998). The significantly decreased erythrocyte incorpor-ation of Fe from the test meal with added retinyl palmitate at baseline in the present study was surprising. However, the lack of any statistically significant effect of added reti-nyl palmitate on erythrocyte incorporation of Fe as observed after vitamin A supplementation (intake of a single dose of 210 mmol retinyl palmitate) in the present study is in agreement with our previous finding in adult Europeans.
In the previous human studies of the effect of added retinyl palmitate on Fe absorption reported by us (Walczyk et al. 2003) and by Layrisse and colleagues (Layrisse et al. 1997; Garcia-Casal et al. 1998), erythrocyte incorporation of Fe isotopes 14 d after intake was used as a proxy for Fe absorption. This technique was first established for radioactive isotopes (Cook et al. 1972; Hallberg & Bjo¨rn-Rasmussen, 1972) and later for stable isotopes to enable studies in infants and children (Kastenmayer et al. 1994). The methodology is based on the assumption that a major, and constant, fraction (typically 80 – 90 %) of newly absorbed Fe isotopes is incorporated into erythrocytes within 14 d. Although very little is known about the mechanisms of the interactions between vitamin A status and Fe utilisation, the observation that erythrocyte incorporation of injected 59Fe was significantly reduced
in vitamin A-deficient animals (Mejia et al. 1979) is important in this context. No information is available on the incorporation rate of newly absorbed Fe into erythro-cytes in individuals with vitamin A deficiency, before and after vitamin A supplementation. This measurement was not included in the present study, as the protocol would have required the injection of an additional stable isotope of Fe. The present study therefore reports erythro-cyte incorporation of Fe without applying any incorpor-ation factor to convert the values to Fe absorption.
However, it is important to stress that measurements of erythrocyte incorporation of Fe represent the final result of several stages in Fe metabolism, including absorption and transport of Fe as well as erythropoiesis per se. Thus, the mechanism(s) of the influence of retinyl palmi-tate added to the diet and/or the influence of vitamin A status on one or more of these steps cannot be studied with the technique used in the present study or in the pre-vious studies of the influence of retinyl palmitate on Fe absorption (Layrisse et al. 1997; Garcia-Casal et al. 1998; Walczyk et al. 2003). Earlier studies in rats have reported contradictory data on the effects of vitamin A deficiency on Fe metabolism, indicating increased Fe absorption and retention (Amine et al. 1970; Roodenburg et al. 1994) or no difference in Fe absorption as compared with control animals (Mejia et al. 1979). In these animal experiments, Fe absorption was measured by whole-body counting (Amine et al. 1970; Mejia et al. 1979), measure-ments of faecal radioactivity (Mejia et al. 1979) or by the metabolic balance technique (Roodenburg et al. 1994). The conflicting results can probably be ascribed to differences in experimental design and/or to differences in vitamin A status of animals in the separate studies. It is interesting to note that differences in the distribution of Fe were observed between vitamin A-deficient and normal animals. For example, vitamin A-deficient animals accumulated more Fe in liver (Mejia et al. 1979) and spleen (Mejia et al. 1979; Roodenburg et al. 1994) than did healthy ani-mals. Such differences in the metabolism of newly absorbed Fe could be important factors also in the present study. However, there is no information available on the distribution of Fe in different organs related to vitamin A status in man.
An additional methodological constraint in the present study was the lack of sensitive techniques to monitor changes in vitamin A status. Plasma retinol concentrations are well known to be depressed by infections (Willumsen et al. 1997; Wieringa et al. 2002) and are therefore of limited value to identify vitamin A deficiency in individ-uals living in poor, rural communities such as the study site in the present study. A high prevalence of elevated C-reactive protein concentrations and helminth and malaria infections has recently been reported in school children living in this region (Staubli Asobayire, 2000; Staubli Aso-bayire et al. 2001). The children participating in the present study showed no obvious signs of current infection or other health problems during the study but minor infections can be assumed to be prevalent. For practical reasons, the study population was selected based on low plasma retinol con-centrations during a screening study about 6 – 8 weeks before the start of the present study. At baseline, eight
children had plasma retinol below 0·7 mmol/l and the number of children with low plasma retinol remained rela-tively stable throughout the study; seven to nine children had low plasma retinol (, 0·7 mmol/l) at each blood sampling.
The usefulness of the MRDR technique to evaluate vita-min A status in children in developing countries has been demonstrated previously (Tanumihardjo et al. 1990, 1994b, 1996a,b; Wieringa et al. 2002). Most importantly, this status indicator has been demonstrated not to be influ-enced by infections (Tanumihardjo et al. 1996b; Wieringa et al. 2002) and the MRDR technique was therefore used in the present study. Vitamin A deficiency was indicated by elevated DR:R ratios ($ 0·06) at the first MRDR test (day 18) in all children, and vitamin A liver stores had not increased significantly when re-evaluated 39 d after the intake of a single dose of 210 mmol retinyl palmitate; ‘vitamin A capsule’. The mean DR:R ratio decreased slightly, from 0·156 (day 18) to 0·125 (day 57) and in only one child was the DR:R ratio normalised to , 0·06 after intake of the vitamin A capsule. However, this child had a DR:R ratio of 0·06 on day 18 and the decrease in DR:R ratio (to 0·057) was thus marginal. Although the MRDR test is not a quantitative measure of vitamin A status, most children in the present study had substantially elevated DR:R ratios at baseline, clearly indicating vitamin A deficiency. Under these conditions, it can be assumed that the single dose of 210 mmol retinyl palmitate was uti-lised rapidly in different body compartments, but did not provide enough retinol to improve liver stores. Thus, the lack of improvement in DR:R ratios is not surprising (Tanumihardjo, 2001). No information is available on the dose of retinyl palmitate or other retinyl esters required to normalise DR:R ratios in individuals with vitamin A deficiency similar to the African children in the present study. However, the difference in response to added retinyl palmitate on erythrocyte incorporation of Fe from the labelled test meals before and after intake of a vitamin A capsule (single dose of 210 mmol retinyl palmitate) indi-cates changes in vitamin A status. These results highlight the need to develop sensitive techniques to better define vitamin A status at the cellular level.
In conclusion, added retinyl palmitate significantly decreased erythrocyte incorporation of Fe from the Fe-for-tified test meal in children with vitamin A deficiency at baseline but had no significant influence 3 weeks after the intake of a high-dose vitamin A supplement (single dose of 210 mmol retinyl palmitate). These results indicate, indirectly, changes in vitamin A status after intake of the vitamin A supplement, although no significant improve-ment in vitamin A status could be detected by the MRDR technique. Intake of a single dose of 210 mmol reti-nyl palmitate did not improve vitamin A liver stores in the African children with vitamin A deficiency participating in the present study. More information is clearly needed on the doses of retinyl esters required to normalise DR:R ratios in children with vitamin A deficiency to optimise the health benefits of vitamin A supplementation programmes.
The results from the present study add to the contradictory information on the influence of dietary
retinyl palmitate on Fe absorption as enhancing, inhibitory or as having no effect. The lack of conclusive data indi-cates the complexity of the interactions between vitamin A status, dietary vitamin A and Fe metabolism.
Acknowledgements
The authors are grateful for the excellent cooperation of children, parents, teachers and village elders in N’Die´ou, Coˆte d’Ivoire. Vitamin A capsules and retinyl palmitate were generously donated by Hoffmann LaRoche, Basel, Switzerland. Fruitful discussions with Dr Sherry Tanumihardjo are gratefully acknowledged.
References
Amine EK, Corey J, Hegsted DM & Hayes KC (1970) Comparative hematology during deficiencies of iron and vitamin A in the rat. J Nutr 100, 1033 – 1040.
Beer B & Heumann KG (1993) Isotope dilution mass spectrometry of microelectronically relevant heavy metal traces in high purity cobalt. Fresenius J Anal Chem 347, 351 – 355.
Cook JD, Layrisse M, Martinez-Torres C, Walker R, Monsen E & Finch CA (1972) Food iron absorption measured by an extrinsic tag. J Clin Invest 51, 805 – 815.
Davidsson L, Galan P, Kastenmayer P, et al. (1994) Iron bioavailability in infants: The influence of phytic acid and ascorbic acid in infant formulas based on soy isolate. Pediatr Res 36, 816 – 822.
Fishman SM, Christian P & West KP Jr (2000) The role of vitamins in the prevention and control of anaemia. Public Health Nutr 3, 125 – 150.
Garcia-Casal MN, Layrisse M & Solano L, et al. (1998) Vitamin A and beta-carotene can improve nonheme iron absorption from rice, wheat and corn by humans. J Nutr 128, 646 – 650.
Hallberg L & Bjo¨rn-Rasmussen E (1972) Determination of iron absorption from whole diet. A new two-pool model using two radioiron isotopes given as haem and non-haem iron. Scand J Haematol 9, 193 – 197.
Kastenmayer P, Davidsson L, Galan P, Cherouvrier F, Hercberg S & Hurrell RF (1994) A double stable isotope technique for measuring iron absorption in infants. Br J Nutr 71, 411 – 424.
Layrisse M, Garcia-Casal MN, Solano L, et al. (1997) The role of vitamin A on the inhibitors of nonheme iron absorption: preliminary results. J Nutr Biochem 8, 61 – 67.
Linderkamp O, Versmold HT, Riegel KP & Betke K (1977) Estimation and prediction of blood volume in infants and children. Eur J Pediatr 125, 227 – 234.
Mejia LA, Hodges RE & Rucker RB (1979) Role of vitamin A in the absorption, retention and distribution of iron in the rat. J Nutr 109, 129 – 137.
Roodenburg AJC, West CE, Yu S & Beynen AC (1994) Comparison between time-dependent changes in iron metabolism of rats as induced by marginal deficiency of either vitamin A or iron. Br J Nutr 71, 687 – 699.
Sandberg A-S & Ahderinne R (1986) HPLC method for determination of inositol tri-, tetra-, penta-, and hexapho-sphates in foods and intestinal contents. J Food Sci 51, 547 – 550.
Semba RD & Bloem MW (2002) The anemia of vitamin A deficiency: epidemiology and pathogenesis. Eur J Clin Nutr 56, 271 – 281.
Sommer A & Davidson FR (2002) Assessment and control of vitamin A deficiency; the Annecy accords. J Nutr 132, 2845S – 2850S.
Staubli Asobayire F (2000) Development of a food fortification strategy to combat iron deficiency in the Ivory Coast. PhD thesis no. 13730. Zu¨rich, Switzerland: Swiss Federal Institute of Technology (ETH).
Staubli Asobayire F, Adou P, Davidsson L, Cook JD & Hurrell RF (2001) Prevalence of iron deficiency, with and without concurrent anemia, in population groups with high prevalence of malaria and other infections in Coˆte d’Ivoire. Am J Clin Nutr 74, 776 – 782.
Tanumihardjo SA (2001) Can lack of improvement in vitamin A status indicators be explained by little or no overall change in vitamin A status of humans? J Nutr 131, 3316 – 3318.
Tanumihardjo SA, Cheng JC, Permaesih D, et al. (1996a) Refine-ment of the modified-relative-dose-response test as a method for assessing vitamin A status in a field setting: experience with Indonesian children. Am J Clin Nutr 64, 966 – 971.
Tanumihardjo SA, Muherdiyantiningsih, Permaesih D, et al. (1994a) Assessment of the vitamin A status in lactating and in nonlactating, nonpregnant Indonesian women by use of the modified relative dose response (MRDR) assay. Am J Clin Nutr 60, 142 – 147.
Tanumihardjo SA, Muhilal, Yuniar Y, et al. (1990) Vitamin A status in pre-school-age Indonesian children as assessed by the modified relative dose response (MRDR) assay. Am J Clin Nutr 52, 1068 – 1072.
Tanumihardjo SA, Permaesih D, Dahro AM, et al. (1994b)
Comparison of vitamin A status assessment techniques in chil-dren from two Indonesian villages. Am J Clin Nutr 60, 136 – 141.
Tanumihardjo SA, Permaesih D, Muherdiyantiningsih, et al. (1996b) Vitamin A status of Indonesian children infected with Ascaris lumbricoides after dosing with vitamin A supplements and albendazole. J Nutr 126, 451 – 457.
Taylor PDP, Maeck R & De Bie`vre P (1992) Determination of the absolute isotopic composition and atomic weight of a reference sample of natural iron. Int J Mass Spectrom Ion Process 121, 111 – 125.
Walczyk T (1997) Iron isotope ratio measurements by negative thermal ionization mass spectrometry. Int J Mass Spectrom Ion Process 161, 217 – 227.
Walczyk T, Davidsson L, Hulthen L, Hallberg L & Hurrell RF (2003) No enhancing effect of vitamin A on iron absorption in healthy adults. Am J Clin Nutr 77, 144 – 149.
Walczyk T, Davidsson L, Zavaleta N & Hurrell RF (1997) Stable isotope labels as a tool to determine iron absorption by Peruvian school children from a breakfast meal. Fresenius J Anal Chem 359, 445 – 449.
Wieringa FT, Dijkhuizen M, West CE, Northrop-Clewes CA & Muhilal (2002) Estimation of the effect of the acute phase response on indicators of micronutrient status in Indonesian infants. J Nutr 132, 3061 – 3066.
Willumsen JF, Simmank K, Filteau SM, Wagstaff LA & Tomkins AM (1997) Toxic damage to the respiratory epithelium induces acute phase changes in vitamin A metabolism without depleting retinol stores of South African children. J Nutr 127, 1339 – 1343.