WORKING
PAPERS
SES
N. 490
XI.2017
Faculté des sciences économiques et sociales Wirtschafts- und sozialwissenschaftliche Fakultät
Founding family ownership,
stock market returns, and
agency problems
Nicolas Eugster
and
Founding family ownership,
stock market returns, and agency problems
♣Nicolas Eugster University of Fribourg Boulevard de Pérolles 90 CH-1700 Fribourg [email protected] Dušan Isakov♦ University of Fribourg Boulevard de Pérolles 90 CH-1700 Fribourg [email protected]
First version: July, 2016 This version: November, 2017
♣ We thank Xavier Giroud, Christophe Pérignon, Jean-Philippe Weisskopf and the seminar participants at the
Ecole Hôtelière de Lausanne, CIG meetings in Lausanne and Dijon, French Finance Association Annual Meeting in Valence, World Finance and Banking Symposium in Singapore, and Australasian Finance and Banking Conference in Sydney for their helpful comments and suggestions. We are responsible for all remaining errors.
1
Founding family ownership,
stock market returns, and agency problems
Abstract
This paper explores the relationship between founding family ownership and stock market returns. Using the entire population of non-financial firms listed on the Swiss stock market for 2003–2013, we find that the stock returns of family firms are significantly higher than those of non-family firms after adjusting the returns for different risk factors and firm characteristics. Family firms generate an annual abnormal return of 2.8% to 7.1%. Moreover, family firms potentially having more agency problems earn higher abnormal returns than other firms and markets participants are regularly positively surprised by the economic outcomes produced by these firms around earnings announcements. The evidence suggests that outside investors earn a premium for bearing the high expropriation risk of family firms.
JEL Classification: G31; G14
2
Founding family ownership,
stock market returns, and agency problems
1. Introduction
For over a decade, the impact of family ownership and control on the performance of publicly listed companies received extensive attention in the academic literature. This is important, since family firms represent a large fraction of listed firms worldwide (Carney and Child (2013); Faccio and Lang (2002); La Porta et al. (1998)). Most of this literature focuses on performance metrics related to profitability (return-on-assets, ROA) or valuation ratios (Tobin’s Q) (e.g., Anderson and Reeb (2003); Villalonga and Amit (2006)). However, the evidence on the stock market performance of these firms is more limited, although it is of prime importance for the minority shareholders of these firms and investors in general. Our paper fills this gap by proposing a detailed analysis of the stock returns of family-owned firms compared to the rest of the market. Using the entire population of non-financial firms listed on the Swiss market, we find that family ownership has a beneficial impact, and that these firms deliver higher stock market returns than non-family ones. The outperformance of the former ranges between 2.8% and 7.1% per annum, depending on the way risk is adjusted.
The stock returns of family-owned firms might have received little attention so far possibly due to the strong belief in market efficiency. Characteristics such as ownership structure, and particularly the identity of the controlling shareholder, if any, is public information that should be integrated into stock market prices, and there is no reason to believe that choosing stocks based on this information might lead to superior returns. However, recent literature shows that strategies using public information can offer superior returns on the stock market. For instance, Edmans (2011) shows that a strategy based on a publicly disclosed index of employee satisfaction (Forbes 100 best companies to work for) leads to positive abnormal returns. Moreover, Lilienfeld-Toal and Ruenzi (2014) document that choosing stock of companies with high CEO ownership also leads to significant outperformance. The common explanation here is that the market does not fully value these features, as they are difficult to appraise quantitatively.
The positive impact of family ownership on stock returns could also be related to an improperly assessed effort of family members by market participants, since the concentration of ownership in family hands may both have positive and negative effects on economic
3
efficiency. Family ownership can thus have various implications on the agency problems in a corporation and, hence, on its profitability and perception by market participants. On one hand, family control reduces the conflicts of interest between managers and shareholders (agency problem I), as families tend to seek the long-term sustainability for their companies and, from their dominant position, can challenge any decision not in their interest. This behavior can be value creating for the company and its shareholders. On the other hand, the presence of a large shareholder generates conflicts of interest between minority and majority shareholders (agency problem II). The controlling shareholder can use its power to extract private benefits, which reduces company value. For family firms, these problems are not likely to materialize as pure wealth expropriation, since the own wealth of family members would be negatively impacted. However, agency problems may take the form of non-value maximizing decisions, because the family is pursuing objectives that increase its own utility (e.g., firm growth, reputation, or survival) and do not enhance shareholder value. Moreover, these firms can suffer from specific problems, such as family feuds or nepotism, which would also lead to firm value reduction. These two opposing effects of family control vary by company and depend on the different firm characteristics, such as the level of family control. Morck et al. (1988), McConnell and Servaes (1990) and Anderson and Reeb (2003) have documented a nonlinear relationship between firm performance and the stake of the largest shareholder. They show there is an incentive effect at lower levels of control, and that performance increases with family holdings. However, this relation changes to an entrenchment effect with negative consequences on performance at higher levels of control. For family firms, other factors, such as the generation the firm is at or the active involvement of the family in the management, play an important role on performance.
This paper investigates the stock market performance of Swiss family firms from January 2003 to December 2013 for a sample of 195 companies listed on the SIX Swiss Exchange. The Swiss market represents an ideal laboratory for studying the relationship between family ownership and stock returns for two reasons. First, La Porta et al. (1999) document that, in most markets worldwide, ownership is concentrated, frequently in the hands of families, with investors being relatively poorly protected by law. In this respect, Switzerland is a representative market, as it is characterized by the presence of numerous family firms and low investor protection. Compared to the US, the levels of ownership by the largest blockholders are higher, which potentially makes agency problems between majority and minority shareholders more severe. Anderson and Reeb (2003) document an average holding of 17.88% of the voting rights for families in the US, while Isakov and Weisskopf (2014) report an average stake of 55% for families in Switzerland. In addition to the high control levels,
4
Switzerland ranks poorly in international comparisons of minority shareholder protection according to the studies of La Porta et al. (1998) and Djankov et al. (2008). These Swiss market features facilitate the potential extraction of private benefits by the controlling shareholder. Second, this market has a relatively small number of listed firms. As emphasized in the literature,1 most commercial databases on ownership contain inaccuracies or are unable to
identify correctly the ultimate owner of a firm. Therefore, hand collecting data on ownership structures from different sources overcomes this problem and allows documenting accurately the different aspects of ownership. This process is only possible with a reasonable number of firms, as is the case of the Swiss market. Another advantage of the limited number of firms is that it allows us to work with the entire population of listed firms. This contrasts with other markets, where the large number of listed firms forces researchers to work on subsamples, exposing the reported results to potential sample selection bias.
The main results of this paper show that (1) family firms have higher stock returns than widely held firms and those with another blockholder; (2) considering a number of different risk factors, family firms outperform non-family firms in terms of risk-adjusted stock market returns; (3) the superior performance of family firms is associated with specific features of family firms, such such as the level of control, the generation, or the active involvement in management; (4) family firms have larger earnings surprises than other firms; (5) these earnings surprises translate into stronger market reactions to earnings announcements; and (6) the behavior around earnings announcement is related to family firm characteristics. Overall, our results show that family firms with potentially more agency problems have higher abnormal returns than other firms. We also find that investors appear to be regularly (positively) surprised by the economic outcomes of these firms around earnings announcements. This suggests that outside investors earn a premium for bearing the high expropriation risk of family firms.
This paper contributes to the existing literature as follows. First, it adds to the literature on the link between ownership structure and stock market returns by proposing a detailed investigation of the impact of founding family ownership on stock market returns, an aspect that hitherto received limited attention.2 Besides documenting the difference in returns between
1 See, for instance, Anderson and Lee (1997), Dlugosz et al. (2006), or Holderness (2009).
2 Only few studies examined the stock market performance of family firms. For example, Corstjens et al. (2006)
analyze large firms from the French, UK, German, and US markets, and find positive abnormal returns for family firms on the French market. Cella (2009) considers a sample of large firms from eight European countries, and documents that family firms from these countries earn significant positive abnormal returns. Fahlenbrach (2009) examines the performance of a subsample of family firms—those run by a founder-CEO in the US—finding that these firms generate significantly positive abnormal returns. Miralles-Marcelo et al. (2013) find that, for a sample
5
firms with different types of controlling shareholders, this paper details the reasons explaining the outperformance of family firms. We find that abnormal performance is associated with features usually indicating the presence of potential agency problems. Our interpretation of the results is that market participants are unable to correctly assess the performance of family firms because of the ambiguous effects of family presence on performance, and that the abnormal returns of these firms are a reward for bearing the risk of potential expropriation. Second, this paper contributes to the growing finance literature on family firms. To the best of our knowledge, it is one of the first to investigate the stock market returns of such firms and relate them to features known to have an impact on profitability and valuation. The paper is also one of the first to provide a detailed explanation for the abnormal returns of these firms, also showing that the presence of potential agency problems in family firms plays a very important role in stock pricing. Finally, our study contributes to the growing literature at the intersection of corporate finance and asset pricing, showing the existence of firm features not properly assessed by the market, which generate abnormal returns for investors. It shows that, under certain circumstances, the market might not integrate efficiently some publicly available information such as the ownership structure of a company into stock prices.
The remainder of this paper is organized as follows: Section 2 describes the Swiss institutional setting. Section 3 presents the data and variables used in the analysis and provides descriptive statistics for the sample. Section 4 analyzes the stock market performance of family firms, while section 5 provides an additional analysis of returns related to specific characteristics of family firms. Section 6 investigates how the market perceives family firms’ earnings announcement. Section 7 summarizes the major findings and concludes the paper.
2. Swiss institutional setting
The Swiss stock market is one of the largest stock markets worldwide. At the end of 2015, it ranked 10th in terms of market capitalization (World Federation of Exchanges (2016)). Despite its size, the number of publicly listed firms is relatively small, as only 250 companies are traded on this market. The ownership structure of Swiss firms is typical for continental Europe as the majority have a concentrated ownership. For instance, Faccio and Lang (2002) report that, in 1995, 28% of companies were widely held, while 48% of firms are family-owned and 24% have a non-family blockholder. Moreover, they report that controlling shareholders
of Portuguese companies, family firms outperform others. However, this body of literature does not find explanations for the stock market performance of family firms.
6
essentially employ dual-class shares to increase their control over the company, as these are unrestricted by Swiss law. The authors report that 51% of firms use multiple share classes, while 10% resort to pyramidal structures and none to cross-holdings.
In terms of corporate governance characteristics, Switzerland belongs to the German-origin civil law countries according to La Porta et al. (1998), which tend to have poor investor protection. This is illustrated by Switzerland ranking poorly both in terms of anti-director rights index (La Porta et al. (1998)) and the anti-self-dealing index proposed by Djankov et al. (2008). It also has a nearly non-existent but slowly evolving market for corporate control (Lowinski et al. (2004)). These observations indicate that, on this market, controlling shareholders such as families have significant freedom. As such, agency problems between majority and minority shareholders can potentially be severe, since controlling shareholders can extract private benefits more easily than in other countries. However, improvements in investor protection have been recently observed. In 2002, Switzerland adopted a code of best practices for corporate governance. This led to significant changes in corporate governance practices. An example is the fact that numerous firms abandoned their dual-class share structure since. Finally, in 2013, the Swiss citizens voted a very constraining law to limit abuses on executive compensation.
A recent example3 illustrates how the risk of expropriation associated with investment
in family firms can materialize for minority shareholders in this setting. Sika AG is a medium-sized company in the chemical specialties sector. The company was founded in 1910 by K. Winkler. He was then joined by his son-in-law, F. Schenker, and both developed the company over the years. The descendants of the two founders, the Schenker-Winkler family, then controlled the firm through the SWH holding company. With the use of dual-class shares, they held 16% of capital and 52% of voting rights. In December 2014, the SWH holding announced its intention to sell its complete stake to the French company Saint-Gobain, as the group of descendants had diverging interests and were not willing to keep the company anymore. The price Saint-Gobain agreed to pay to SWH holding for their shares included a premium of 80% over the current market price. Other minority shareholders could not benefit from this offer and were at risk with this change of control, as there were no guarantees for the future of Sika since Saint-Gobain is its direct competitor in many sectors. Following this announcement, the stock price dropped by more than 20%, directly affecting the wealth of minority shareholders. Sika’s example highlights the potential dangers for the shareholders of family firms in Switzerland, a country where investor protection is relatively weak.
7
3. Data and variables
The empirical analysis is performed on a dataset of 195 companies listed on the SIX Swiss Exchange from January 2003 to December 2013. The final sample contains 19,928 firm-month observations on the entire population of Swiss non-financial listed firms over the analyzed period. Different sources are used to build this database as follows.
Ownership data are collected by hand, and include information on all non-financial companies belonging to the Swiss Performance Index (SPI), that is, detailed information on the ownership structure of the firms.4 Particularly, we have information on the identity of the three
largest shareholders holding more than 3% of voting rights in every company (if any). When the shareholder is a company, we further search for the ultimate owner as to determine the exact type of shareholder (e.g., the Schenker-Winkler family behind the SWH holding company). We also identify the proportions of voting and cash-flow rights held by each large shareholder. Ownership data are observed on a yearly basis and recorded at the end of each year.
Data are collected from the annual reports of companies, as well as from Swiss stock guides, newspaper articles, firm homepages, or the commercial register when needed. We follow the standard practice in the literature, and when the largest shareholder has a stake of the voting rights larger than the 20% threshold, we consider the firm is controlled by a majority shareholder (Faccio and Lang (2002)). We classify the companies by type of owner as follows: family, widely held, state, private investor,5 owned by another widely held corporation, owned
by another widely held financial firms, and miscellaneous. For each largest shareholder of a firm, we compute the wedge between voting and cash-flow rights as the ratio between the proportions of voting and cash-flow rights held by this shareholder. In Switzerland, this difference is mainly due to the use of dual-class shares. When a company does not have a shareholder holding more than 20% of the voting rights, we classify it as a widely held firm. For these firms, we also compute the wedge for the largest shareholder even if he holds less than 20% of voting rights.
4 The database of ownership structure for 2003–2010 originates from the work of Isakov and Weisskopf (2014).
We have extended their database and collected additional information for 2011–2013.
5 We follow Andres (2008) and Isakov and Weisskopf (2014), establishing a specific category of controlling
shareholder named private investor. A private investor is defined as one or more individuals that have neither founded the company nor shaped it in a substantial way over time. The motivations and values of a private investor strongly differ from those of a founding family. Typically, there are private investors who target making a quick profit and then leaving. Private investors also differ from other non-family blockholders in being more likely to reduce agency problems I (more incentives to control managers), but are more prone to agency problem II (more incentives to extract private benefits). Typically, firms with this type of controlling shareholder are considered family firms in a large proportion of the literature, which might lead to biased results.
8
We also collect additional information specific to family firms. We first distinguish between firms at the founder or at the descendant stage. When the founder is not active in the company or is not a shareholder and the firm is owned by his heirs, we consider the firm to be at a descendant stage. We then determine if family members have an active role in its management (as CEO and/or Chairman of the Board), and then distinguish between firms where the family is active or a passive owner of shares without direct management implication.
Market data on the monthly stock returns of each company are obtained from Thomson Reuters’ Datastream. Returns are computed as total returns and include the dividend distribution. Besides returns, we also need a series of variables to quantify the different firm characteristics, as well as the earnings announcements, for the empirical analyses. These are obtained from Thomson Reuters’ Datastream, Worldscope, and FactSet. A detailed description of the different variables and their sources is found in the Appendix.
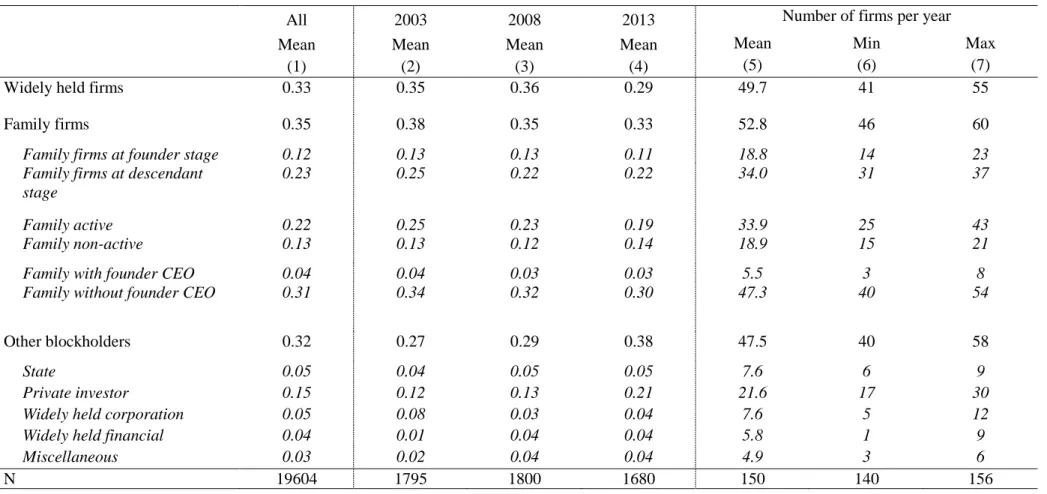
Table 1 presents the sample composition according to different types of controlling shareholders. These statistics are provided for the entire sample period (column 1). We also compute them for the first (column 2), middle (column 3), and last year (column 4) of our sample to document the evolution of ownership over time. We also present the mean, maximum, and minimum number of firms in each category and year.
[Insert Table 1 here]
Our sample appears well balanced regarding firm types. We have three main groups of roughly equal sizes. Each year, we have approximately 50 firms in each category (widely held, family, and firms with another blockholder). Widely held firms represent 33% of the sample. Family firms are the most common type, representing approximately 35% of the sample. Of these, around one-third are at the founder stage and two-thirds at the descendant stage. Two-thirds of family firms have family members active as CEOs or Chairman of the Board and that 10% of family firms have a founder-CEO. Finally, 32% of our sample consists of firms with a controlling shareholder other than the founding family. In this group, 5% of firms are owned by the state, 15% by a private investor, 5% by another widely held corporation, 4% by another widely held financial firm, and 3% are miscellaneous. Proportions remain almost constant between the three decomposed periods. The ownership pattern is stable over time, as there are few changes in the controlling shareholders’ identity or the fraction of voting rights they hold.
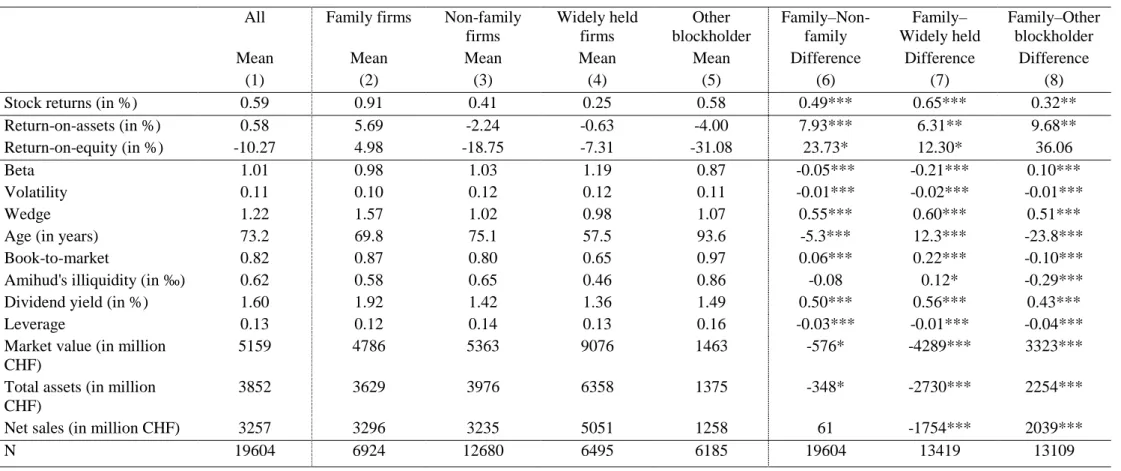
Table 2 presents the descriptive statistics for the entire sample (column 1), as well as for the different categories of firms, grouped by the type of controlling shareholder, namely family
9
firms (column 2), non-family firms (column 3), the latter being further subdivided in widely held firms (column 4) and firms held by another blockholder (column 5). Table 2 also presents (i) the means of the different variables used in the analysis and (ii) the results of the tests of difference in means between family firms and other controlling shareholder types.
[Insert Table 2 here]
The average monthly raw stock return for the entire sample is 0.59% per month. Family firms have significantly higher average raw returns (0.91%) than other firm categories. Widely held firms have the lowest average raw return over the analyzed period (0.25%). Moreover, family firms appear to be significantly more profitable than other firms according to their mean ROA (5.69%) and return on equity (ROE) (4.98%). The profitability of family firms is positive over the period, while that of other firms is negative. In terms of risk, family firms are slightly less risky than other firms in the sample. They also have lower betas (except for the firms with another blockholder that have a slightly lower mean beta of 0.87) and lower volatility. In terms of control-enhancing mechanisms, family firms have an average wedge of 1.57, while this value is close to one for all other categories This means that the largest shareholder in family firms has, on average, 1.5 more voting than cash-flow rights, while the other groups respect the one-vote-one-share principle. Despite the progressive reduction of dual-class shares structures in Switzerland, family firms still use this technique to reinforce the control they have over the firm. Interestingly, the mean wedge for widely held firms is slightly below one. This is due to some firms having limitations on voting rights and some large shareholders having less voting than cash-flow rights. Concerning the other firm characteristics, family firms and firms held by another blockholder have higher book-to-market ratios and less liquid stocks (higher Amihud’s illiquidity ratio) and are generally smaller than widely held firms (in terms of market value, total assets, or net sales). While firms held by another blockholder are the oldest, widely held firms are, on average, the youngest. We also observe that family firms are more generous with their shareholders, as they pay significantly more dividends than other firms (they have an average payout ratio of 1.92%, while other firms have 1.42%). This is consistent with the findings of Isakov and Weisskopf (2015), who document that family firms have higher payouts
10
in Switzerland. Regarding leverage, family firms have slightly lower levels of leverage, on average, than non-family firms. These results are consistent with the previous literature.6
4. Stock market returns of founding family firms
This section analyzes the stock market performance of family firms. We use two complementary approaches: portfolio-based and firm-characteristics. The latter allows for a larger number of risk factors/firm characteristics that impact stock returns than the standard portfolio approach, which is based on size, book-to-market, and momentum factors. Moreover, the portfolio-based approach has some drawbacks in the case of Switzerland.
4.1 Portfolio-based approach
To study the impact of family ownership on stock performance, we follow the methodology of Gompers et al. (2003), which is based on grouping stocks with similar characteristics in portfolios. At the beginning of each year, we build equally weighted portfolios7, containing the stocks of all firms with the same type of controlling shareholder
(family, widely held, other blockholder). Portfolio returns are subsequently calculated at the end of each month over the entire year. At the beginning of the next year, portfolios are reformed and returns calculated again. We then create different self-financing strategies that are long in one portfolio and short in the second one (e.g., long on the portfolio of family firms and short on the portfolio of widely held firms).
We then use a multi-factor model to analyze the performance of portfolios and strategies. Specifically, we use the four-factor model of Carhart (1997), which is an extension of the classical Fama-French three-factor model (Fama and French (1992, 1993)), with an additional factor reflecting the momentum effect of Jegadeesh and Titman (1993). We estimate the model as:
1 2 3 4
α β β β β
= + + + + +
pt p p t p t p t p t pt
R RMRF SMB HML WML e , (1) where Rpt is the return of portfolio p minus the risk-free rate in month t, RMRFt the expected market return minus the risk-free rate in month t, SMBt the difference between the expected return in month t of a portfolio of small-cap stocks and that of a portfolio of large cap stocks,
6 Schmid (2013) shows that leverage is lower for family firms in Germany, which has an institutional and economic
environment similar to the Swiss one.
7 The use of equally weighted portfolios is more appropriate for the Swiss market, since some firms are very large
and represent an important fraction of total market capitalization. The use of value-weighted portfolios is less informative, since these portfolios would essentially reflect the returns of these few large firms.
11
HMLt the difference between the expected return in month t of a portfolio of stocks with high book-to-market and that of a portfolio of stocks with low book-to-market, and WMLt the difference between the expected return in month t of a portfolio with stocks having outperformed the previous month and that of a portfolio with stocks having underperformed the previous month. Alpha measures the abnormal return an investor would have obtained monthly from 2003 to 2013. This model necessitates monthly estimates of the four relevant factors, as well as the risk-free rate for Switzerland. We use local factors, as Griffin (2002) concludes that domestic factors explain better time-series variations in returns than world factor models and generally have smaller pricing errors than their international counterparts. The returns of these factors have been computed by Ammann and Steiner (2008) for 1990–2014.8 However,
evidence on the validity of the four-factor model for the Swiss stock market is weak (e.g., Fama and French (1998) and Ammann and Steiner (2008)). Moreover, the reliability of these factors is not guaranteed, as the number of stocks available for their construction is limited. We therefore also use a simple one-factor model as an alternative to measuring abnormal returns.
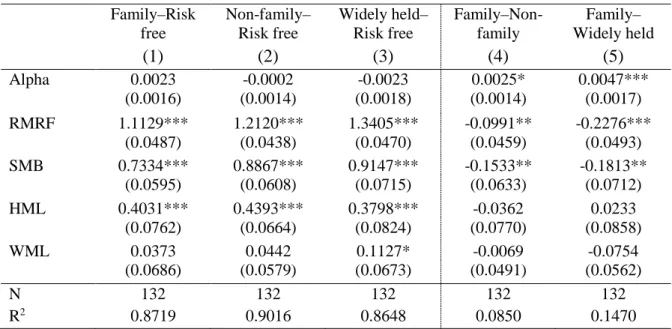
The results of the analysis are presented in Table 3. The first three columns report abnormal returns and the risk coefficients for the three portfolios representing different types of firms, while the last two columns report the alphas of two self-financing strategies. Both strategies are long on the portfolio of family firms. The first strategy shorts a portfolio of non-family firms, while the second shorts a portfolio of widely held firms.
[Insert Table 3 here]
Panel A shows the results for the four-factor model. The abnormal returns of the portfolio of family firms is positive and insignificant, while the returns of non-family or widely held firms are negative and insignificant. The returns on self-financing strategies long on family firms and short on widely held or non-family firms yield significant and positive alphas of 0.25% and 0.47% per month, respectively (3.04% and 5.78% per annum). However, the results must be interpreted with caution, as explained above. We therefore use a single-factor model as well, whose results are shown in Panel B. We find the alphas of different long-only strategies are all higher than in the four-factor model. This time, the portfolio of family firms displays a positive and significant alpha of 0.57% per month (7.05% per annum), while the portfolios of
8 These factors are available on Amman’s website (www.manuel-ammann.com). We thank the authors for making
12
non-family and widely held firms are positive and insignificant. Regarding self-financed strategies, the strategy that sells short the portfolio of widely held firms yields a significant and abnormal return of 0.34% per month (4.08% per annum). This result is similar to those in Panel A. As robustness check, we repeat the analysis with value-weighted portfolios to verify if the results are not driven by smaller firms, and find qualitatively similar results.9 Generally, this
initial analysis shows that an investment in a portfolio of family firms yields the highest risk-adjusted returns among the different portfolios containing firms grouped according to their controlling shareholder. These results confirm those in Table 2 (i.e. family firms have the highest returns).
4.2 Firm-characteristics approach
The main issue with the portfolio approach is that it does not consider other firm characteristics besides size, book-to-market, and momentum. To control for firm characteristics, we follow Lilienfeld-Toal and Ruenzi (2014) and use two methods to estimate the following multivariate regression:
= + + +
it i i it i it it
r a b X cZ e , (2)
where rit is the total returns for firm i in month t, Xit the dummy variable indicating the presence of one type of shareholder in the ownership structure, and Zit a vector of firm characteristics. The first method is a pooled panel regression (POLS2C), where standard errors are two-dimensionally clustered along the firm and time dimensions. The second method is a Fama-MacBeth (Fama and Fama-MacBeth (1973)) approach (FMB), where cross-sectional regressions are run separately for each month of the sample period, and then the values of the final parameters are determined using the mean and statistical significance of the time-series statistics of these monthly estimates.10 In both cases, we also control for industry effects by including industry
dummies in all regressions, based on the Industry Classification Benchmark (ICB) 10 industry classification. Following Brennan et al. (1998), Gompers et al. (2003), and Lilienfeld-Toal and Ruenzi (2014), our set of control variables includes the logs of book-to-market and of market value as proxies for the size and value effect, respectively. We also use the price of stocks and volatility of returns, as well as three variables for returns 3–2, 6–4, and 12–7 months before the month of analysis as proxies for the momentum factor. As suggested by Edmans (2011), we
9 The results are not shown due to space considerations, but are available upon request.
10 Two-dimensional clustering provides asymptotically unbiased standard errors, while the FMB estimates of
standard errors can be biased in the presence of firm fixed effects. It is therefore recommended to use the two methods, since we cannot rule out the presence of firm fixed effects in our regressions.
13
further control for stock liquidity by using the Amihud’s illiquidity ratio (Amihud (2002)). We also consider the dividend yield and leverage and, as proxies for firm’s efficiency, the operating margin and sales over total assets. Finally, we use asset and sales growth over the past year and over the past five years. All variables are detailed in the Appendix.
The results of the multivariate regressions with firm characteristics are shown in Table 4. Among the different control variables, we observe that some characteristics not included in the Carhart four-factor model appear to be significantly related to individual stock returns. These variables are Amihud’s illiquidity ratio, dividend yield, leverage, operating margin, sales, and asset growth. This indicates that the firm-characteristics approach is complementary to the portfolio-based one and relevant to analyzing stocks in Switzerland. The main results are the significant coefficients obtained in both approaches for the family dummy. These results reflect that family firms earn significantly higher returns compared to other firms in our sample, and that these differences cannot be explained by differences in firm characteristics.
[Insert Table 4 here]
Firms with a family holding at least 20% of the voting rights earn a significant additional monthly return of 0.52% (6.42% annually) compared to firms with no family holding in the POLS2C regression. The coefficients differ slightly between the regression approaches, but both are statistically significant. These results confirm and reinforce those from the portfolio-based approach: a family as a controlling shareholder is associated with higher stock returns.
4.3 Longevity of outperformance
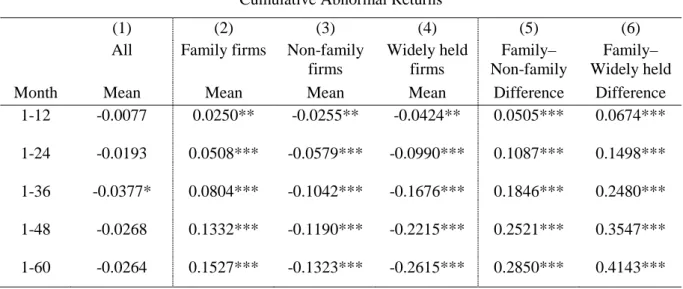
The results in Tables 3 and 4 might be due to market mispricing for the effect of family ownership. However, since ownership is stable over time, an efficient market should correct its error and abnormal return should decline over time, as the market learns the true value of these firms. We therefore study the longevity of outperformance. We follow Edmans (2011) and assess it with a long-term event study approach, computing cumulative abnormal returns (CARs). The “event” is the end-of-year disclosure of firm ownership structure. Each year, we calculate for each firm and each month an abnormal monthly return by subtracting the market return from the raw stock return. Starting in January, we cumulate these benchmark-adjusted returns over horizons of x months (12, 24, 36, 48, or 60). We then create equally-weighted portfolios, containing stocks of firms with similar ownership. Table 5 presents the average CARs over different horizons for different portfolios, obtained by computing the portfolio
14
average returns over different years in the sample. Table 5 shows the results for the portfolio constructed from the entire sample of firms, as well as subsamples of firms with similar types of controlling shareholders, and also the differences in mean returns between portfolios.
[Insert Table 5 here]
These results first show that the CARs for the entire population of non-financial Swiss firms are mostly not statistically different from zero for the five horizons in column (1). However, when distinguishing between family and non-family firms, we observe an important difference as, for each period, the CARs for the groups of family firms are positive and statistically different from zero, whereas those for both the other groups (non-family and widely held firms) are negative and statistically different from zero. Second, the differences in means tests confirm the outperformance of family firms over time compared to non-family or widely held firms. Finally, CARs are continuously growing for all groups (positively for the family firms and negatively for the two others), suggesting the market is not eliminating mispricing over the long term. We thus conclude there is persistence in the outperformance of family firms and that mispricing is never fully corrected, which is a sign of market inefficiency with respect to family ownership.
5. Family firm characteristics and stock returns
The previous section showed that the stocks of firms with a family member as a controlling shareholder outperform the stocks of other firms and yield significantly positive risk-adjusted returns. This outperformance also lasts over time and the associated market inefficiency does not disappear. Here, we investigate if stock market returns are related to different family firm characteristics to identify the potential determinants of outperformance.
5.1 Level of family control and stock returns
We first investigate if there is a relationship between the level of family control, measured as the proportion of voting rights held by the family, and stock returns. The impact of this variable can be interpreted in two opposite ways: a high stake in the firm may reflect a high level of control and a higher risk of expropriation for minority investors, while a high stake by the family may also reflect family members have a large fraction of their wealth invested in the company and will not undertake value-destroying actions that would harm their own
15
interests. This means a high stake could be beneficial for minority shareholders. The previous literature already investigated the relationship between firm performance and the stake of the largest shareholder: Morck et al. (1988), McConnell and Servaes (1990), Anderson and Reeb (2003), and Isakov and Weisskopf (2014) find a nonlinear (concave) relationship between ownership and accounting performance. They also find that performance first increases as family ownership increases (incentive effect) but, after a certain level of ownership, performance decreases (entrenchment effect). The explanation for this concave relationship is that agency problems (risk of expropriation of minority shareholders by the controlling shareholder) become too high when the controlling shareholder has a high stake. This phenomenon has been documented for profitability and valuation ratios, but not for stock returns.
To investigate the relationship between returns and control levels, we first compute the different descriptive statistics of family firms by distinguishing three sub-groups according to the level of voting rights a family has in the firm. The results are presented in Table 6. The first group contains firms where families have 20–50% voting rights, a moderate level of control that does not allow full control over the firm. If a family holds more than 50% of voting rights, it has the absolute majority, thus making most standard corporate governance mechanisms (e.g., annual meeting votes or takeover threat) ineffective. We split the firms with family stakes above 50% into two groups to determine whether firms with very high levels of control have a different impact on returns: 50–80% and 80–100% of voting rights. In a firm with more than 80% of voting rights controlled by the family, there is virtually no possible counter-power to the family, and outside shareholders are totally dependent on family decisions. However, in a firm with a family stake of 50–80%, there is potentially more room for its power to be challenged by some other large investor, such as an institutional investor or another large blockholder. Note that these high levels of control do not automatically imply low stock liquidity, since these firms frequently use control enhancing mechanisms and families have much lower cash-flow than voting rights.
[Insert Table 6 here]
In Table 6, the mean returns increase monotonically with the stake of the family. For families having a stake between 80 and 100%, the mean monthly return is 1.01%, while for those holding a stake of 20–50%, it is 0.88%. Table 6 also shows important differences between the different groups of family firms. The group of firms with high family control tends to
16
include older and smaller firms, and firms with higher liquidity, lower leverage, and higher book-to-market ratios. To ascertain whether the documented differences in raw returns are real, it is important to adjust for these different factors when analyzing returns. We therefore investigate the relationship between family stakes and returns by estimating firm-characteristics regressions (equation (2)). The results are presented in Table 7.11
[Insert Table 7 here]
We first regress returns on the percentage of control rights of the family, and obtain a positive and significant coefficient that indicates a monotonic positive relationship between stock returns and the family stake. Since the literature shows a concave relationship between performance and control levels, we add the squared stake to the previous equation. The coefficients are not significant, which means the relation is linear and not concave and there is no negative impact of high level of control on returns. This is confirmed by the third group of results, where we split the family dummy variable in three, according to the level of family ownership. We find the dummy is not significant for the 20–50% stake, but it is for the two other stake ranges. Moreover, the coefficients are largest for the group of firms with high family stakes. The outperformance of this type of firms is 0.91% per month (or 11.48% per annum) for the pooled regression results. This means that, among the group of family firms, those with high family control earn the highest returns. This contrasts the results in the literature on valuation and profitability ratios, where performance decreases at high levels of control. This can be interpreted as a reward for holding stocks with a high level of family control. As these high control levels imply the inefficiency of most standard shareholder protection mechanisms, higher returns can also be interpreted as a premium compensating the high risk of expropriation borne by outside investors.
5.2. Other specific family features and stock returns
Besides the level of family control, the literature on the relationship between family ownership and performance reached a number of converging conclusions regarding the link between family characteristics and performance. A first important distinction between family firms is the family generation and whether it is the descendants or the founder that runs the
11 To save space, we do not present the control variables coefficients for the further results of firm-characteristics
17
firm. A standard result is that descendant firms tend to underperform founder-led firms. This has been documented in different contexts by Perez-Gonzalez (2006), Bennedsen et al. (2007), or Villalonga and Amit (2006). The last study argues that descendant control leads to poor corporate financial performance because of weaker abilities. The literature on family firm control thus suggests that the risk of family expropriation may be particularly high when descendants control the firm. A second important distinction made in the literature is whether the firm is run by professional managers or family members. The main argument is that having family members in key management positions is suboptimal, since they do not necessarily have the best talent or skills to run the company compared to outside managers. The best scenario for a family firm would thus be to have the firm run by hired professional managers with the family being a passive investor. Having a family member active in the firm would then represent a risk because of his potential lack of skills and/or additional control this would imply for the family. From this viewpoint, having an active family member could be perceived as an additional risk of expropriation for outside investors. However, there is one exception: when the founder of the firm is also the CEO. Adams et al. (2009) and Fahlenbrach (2009) find that founder-CEO firms tend to have a better performance than the other firms. This can be explained by founders having strong incentives and motivation to develop their own firm. We analyze whether these three distinctions (founder/descendant, active/passive, founder-CEO/other family firms) yield different returns to investors. We first compute descriptive statistics for the different categories of family firms, and the results are presented in Table 8.
[Insert Table 8 here]
The results indicate that firms at the descendant stage have slightly higher mean returns than those at the founder stage. For control variables, descendant firms are larger and older. For the second distinction above, we find that firms with an active family member have higher returns than firms with passive owners. The latter also tend to be larger and older than firms with active family members. Finally, contrary to extant literature, family firms with founder-CEOs have comparatively lower returns. To verify if these differences are significant and not due to difference in other firm-related variables, we estimate firm-characteristics regressions (equation (2)), with dummy variables representing the different categories of family firms. The results are presented in Table 9.
18
The regression results confirm the results in Table 8 for the first two distinctions of family firms. We find the family dummy is only significant for firms at the descendant stage and those where the family is active and has operational control. Regarding the distinction between founder-CEO and other firms, the latter have significantly higher returns only in the POLS2C approach.
These results complement those obtained in section 5.1. Here, we investigate if the several distinctions of family firms that appeared to be related to firm performance in the previous literature also affect returns. Among the different distinctions, returns are always higher for the categories of firms potentially associated with more agency problems. Family firms at the descendant stage, with active family members or not run by a founder-CEO, are less efficient than other family firms. Higher abnormal returns for these firms could therefore be interpreted as a compensation for the higher risk of expropriation present in those firms.
We have identified several categories of family firms that earn higher abnormal returns. These firms are those perceived as presenting a potentially higher risk of expropriation (represented by a high family stake, involvement of the family in the firm, or the firm being at the descendant stage) for outside investors.
6. Earnings announcements, analysts’ surprises, and abnormal returns
One possible explanation for the outperformance of family firms over the analyzed 11 years is that investors are unable to properly assess the value of these firms and tend to be skeptical about their performance because of the high expropriation risk. The true economic performance of these firms can be assessed based on the information they disclose. An event with an important informational content is the disclosure of annual earnings. When these are announced, investors have accurate and detailed information about the firm and readjust their opinion accordingly. As suggested by Core et al. (2006) and Giroud and Mueller (2011), one way to verify if market participants are surprised is to use analysts’ forecasts of earnings per share (EPS) as a proxy for market expectations and compare them with the actual published EPS. Another more direct way to determine how investors integrate information into prices is to look at market reactions around earnings announcements. Here, we consider both measures and differentiate the surprises and market reactions observed around earnings announcements for family and non-family firms, as well as for the different categories of family firms.19
To measure analysts’ forecasts of earnings, we use the mean EPS estimated nine months before the release date of annual results. This ensures analysts know the earnings from the previous year when making their forecasts. The published EPS is used as the true EPS. The estimates are obtained from FactSet. This one-year surprise is standard in the literature and has been used by Giroud and Mueller (2011), Edmans (2011), Lilienfeld-Toal and Ruenzi (2014), among others. We define earnings surprises in relative terms and normalize the difference between realized and expected EPS by the share price at the time of the forecast. For a particular firm and year, the surprise is:
Published EPS Consensus EPS Surprise
Share Price −
= . (3)
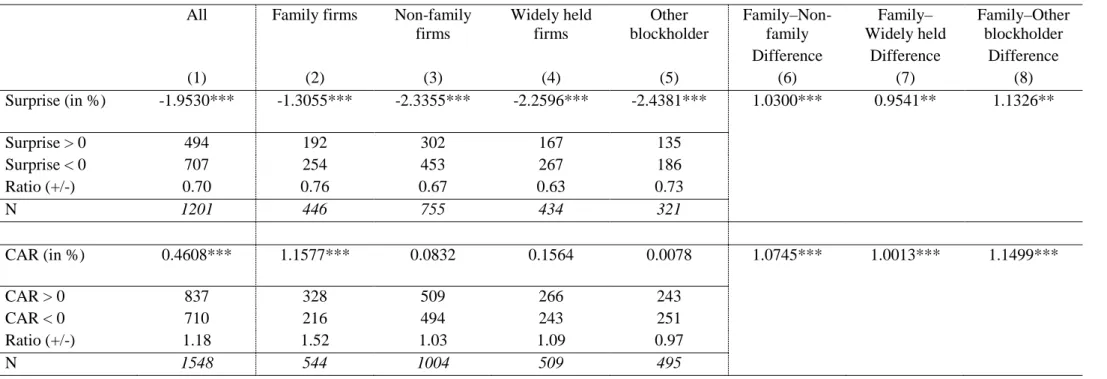
The market reaction around annual earnings announcements is measured by the CAR for a specific firm and year, computed from an event study over the window [-1; +1]. We estimate normal returns with the market model and use the SPI as the market portfolio. The parameters of the market model are estimated for a window of 200 days, 20 days before the announcement date. Table 10 provides the mean values for the earnings surprises and market reactions for the entire market and firms with different types of controlling shareholders. We also compute the ratio of positive to negative earnings surprises.
[Insert Table 10 here]
Table 10 shows that, for the entire market, the earnings surprise is negative, which means that, one-year ahead, the consensus is above the true EPS and the market is overly optimistic regarding future earnings. This is consistent with the literature (see e.g., Brown (1997) for the US or Galanti and Vaubourg (2017) for France). A comparison between the mean surprise of family firms and of non-family firms shows that the market is more positively surprised by family firms, with an average surprise of -1.31% for family firms and -2.34% for other firms. This is also confirmed by the results of the tests of differences in means between family firms earnings surprises and those of other firms, all being positive and significant. For the number of positive and negative surprises for different firms, family firms have a larger proportion of positive surprises (0.76) than other firms (0.67). This also means that, despite analysts’ tendencies to produce forecasts on average above the realized EPS, realized EPS are above the forecasts more frequently for family firms than for other firms. These two results
20
indicate the disclosures of annual earnings by family firms surprise the market more positively than for other firms. Regarding the way investors react to earnings announcements, we find a significant average CAR of 1.16% for family firms, while an insignificant 0.08% is obtained for non-family firms. These average CARs are significantly different from each other and indicate a strong positive price reaction after family firms announce their earnings. As for earnings surprises, the relative frequency of positive CARs is higher for family firms. However, the differences in surprises and market reactions might be due to different confounding factors. We thus use the approaches of Core et al. (2006) and Giroud and Mueller (2011) and estimate the following regression:
= + + +
it i i it i it it
y a b X cZ e , (4)
where yit is either the earnings surprise or the CAR of firm i in year t, Xit a dummy variable for family firms, and Zit a vector of control variables. The set of control variables Zit includes the lagged logarithm of the book-to-market ratio and market capitalization at year-end as proposed by Core et al. (2006). We also add analyst coverage, since it might impact forecast accuracy and market reactions in Switzerland as some firms are followed by a few analysts only. We estimate equation (4) using a pooled regression with industry fixed effects. The results are presented in columns (1) and (4) of Table 11.
[Insert Table 11 here]
The regression results confirm those in Table 10, as the dummy for family firms is positive and significant for both analysts’ surprises and the CARs arounds earnings announcement date. Therefore, it can be concluded that analysts are systematically positively surprised by the good performance of family firms and that these firms have a stronger market reaction to earnings announcements. These results show that the abnormal returns of family firms can be partly explained by annual earnings announcements surprises as the average CAR is 1.16% while the annualized abnormal returns for family firms is between 2.8–7.1% depending on the risk-adjustment method used.
As shown in section 5, abnormal returns are associated with specific family firm features. We therefore investigate if there is a relation between these characteristics and the measures of earnings surprise and market reaction. We first determine whether there is a relationship with the level of family control. The results are presented in Table 12, and the different descriptive statistics are provided for family firms grouped by their level of voting
21
rights. The surprises are larger for family firms with a stake above 50% than for family firms with a moderate stake. In terms of the ratio of positive surprises, family firms with high levels of family control have more positive than negative surprises and this ratio is larger than for the two other categories of family firms.
[Insert Table 12 here]
Finally, regarding the market reaction to earnings announcements, family firms with an 80–100% stake have average CARs of 2.60%, while those of firms with moderate family levels of control have average positive CARs of 0.85%. We also observe that the relative frequency of positive CARs is higher for family firms with a high control level. The descriptive statistics are confirmed by the regression analysis in Table 11. We find significant positive coefficients for the variable of family control rights for surprises and CARs in columns (2) and (5). When we decompose the family dummy into three dummy variables representing different levels of control by the family in columns (3) and (6), we find positive and significant coefficients for the levels of control beyond 50%. The largest estimates are in both cases obtained for family firms with more than 80% of voting rights. These results indicate that the market is positively surprised by family firms’ performance and this surprise is more significant for family firms where the family has the highest levels of control, making the extraction of private benefits more likely. We next investigate if earnings surprises and market reactions are related to other family firm characteristics. Table 13 provides descriptive statistics, while Table 14 presents the regression results.
[Insert Tables 13 and 14 here]
We first analyze the founder/descendant stage distinction. Columns (2) and (3) of Table 13 show descendant firms have slightly larger earnings surprises, a larger proportion of positive surprises, and larger average CARs at earnings announcements. The regression results in columns (1) and (4) of Table 14 show descendant firms have significantly higher surprises and CARs than firms at the founder stage. These results are consistent with those for returns. Regarding the distinction between firms with active members in the management and those with passive owners, the evidence is mixed. As shown in columns (4) and (5) of Table 13, firms with active family members have larger forecasting errors and proportion of positive surprises. However, these firms have lower CARs than firms with passive owners. These results are
22
confirmed by the regression results in columns (2) and (5) of Table 14. Regarding the distinction between firms with a founder-CEO and other family firms, we obtain consistent results. Founder-CEO firms have smaller earnings surprises and CARs, as shown in columns (6) and (7) of Table 13 and in columns (3) and (6) of Table 14. The additional results in Tables 13 and 14 confirm those obtained in Tables 11 and 12 for family control levels. We find that family firms with characteristics perceived as presenting more expropriation risk have higher monthly abnormal returns, and also larger earnings surprises and CARs around earnings announcements.
These results show that the market is regularly and positively surprised by the good operational performance of family firms and the absence of private benefit extraction in firms where these are presumably more likely to happen. These positive EPS surprises translate into positive abnormal returns. However, the magnitude of market reactions found around earnings announcements cannot completely explain the abnormal returns in section 4, because they are not the sole information events when the market learns about the true performance of family firms. Information is also disclosed on other occasions, such as interim results reports or firm-specific events, that have not been investigated in this paper. Nevertheless, the evidence provided in this article should be sufficient to conclude that the positive abnormal returns earned by family firms are caused by market inefficiencies, by the presence of potential agency problems in family firms, and by the fear of outside investors’ expropriation.
7. Conclusions
Many listed firms are owned and controlled by the founding families worldwide. However, the impact of such ownership structures on firm performance is not yet fully understood. This paper investigates an aspect that has hitherto received limited attention in the academic literature by taking the point of view of an investor and analyzing the relationship between ownership structure and stock market returns. The lack of academic evidence and interest on this issue can be explained by that, in efficient markets, there should be no abnormal returns associated with a firm’s ownership structure, since this information is public and should be fully integrated in stock prices. However, the results of our empirical investigations on the Swiss stock market show different results. We analyze panel data from January 2003 to December 2013 for the entire population of non-financial firms listed on the Swiss Exchange, and find that family firms outperform other firms by 2.8–7.1% per annum. To explain these abnormal returns, we investigate if stock returns are associated with different family firm characteristics. We find that returns are positively associated with the level of family control, a
23
variable that measures the level of power the family holds over the firm. For instance, an investment in firms with families controlling between 80 and 100% of the voting rights generates an abnormal return of 12.5% per annum. Significantly higher returns are also observed for firms run by descendants, those with family members active in the management, or with no founder-CEO.
It is well established that the main agency problem faced by a listed firm with a controlling shareholder is the potential conflict of interest between majority and minority shareholders. For family firms, agency problems are not likely to materialize as pure wealth expropriation, since family wealth might also be negatively affected by such practices, but they can turn into the extraction of private benefits of control. For family firms, these private benefits are frequently associated with decisions that maximize the utility of the family but not the value of the firm. The goals of these decisions can be firm growth, reputation, or survival. Family firms can also suffer from more specific problems, such as family feuds or nepotism, which have a negative impact on firm value. Outside shareholders of family firms are exposed to all these potential problems. We therefore interpret the abnormal returns of family firms as a compensation for exposure to these risks. Our analysis of the returns for subgroups of family firms confirms this interpretation, as higher returns are earned by firms with features that make agency problems more severe. For example, a firm where the family controls 80–100% of the votes presents almost no protection for outside shareholders, as most corporate governance mechanisms are made ineffective by such a high level of control.
We complement the above analysis by examining how family firms react to earnings announcements, and find that family firms have significantly larger earnings surprises than other firms. These translate into significantly stronger market reactions, measured by CARs around the announcement date, thus leading to the positive abnormal returns observed for family firms. Market participants appear to be systematically positively surprised by the content of earnings announcements of family firms. We also analyze the reactions of the different subgroups of family firms and confirm that the strongest reactions are observed for firms with the highest risks of expropriation. Although the reaction to annual earnings announcements cannot completely explain the observed abnormal returns, our evidence is consistent with the outperformance of family firms being due to the presence of potential agency problems in family firms and the fear of outside investors’ expropriation. The positive abnormal returns can be interpreted as a premium for bearing the higher expropriation risk.
Overall, the market inefficiency documented here can be related to the previous literature on the difficulty to properly value the true impact of certain firm characteristics, such
24
as employee satisfaction or CEO ownership. In our case, since family control can have a positive or a negative impact on the economic efficiency of the firm, the market is unable to properly integrate information about ownership into stock prices. Our results thus show that market participants correct their poor assessment of these firms when these announce their annual earnings, which leads to positive abnormal returns and make these firms attractive for investors.
25
References
Adams, R., Almeida, H., and Ferreira, D., 2009, Understanding the relationship between founder-CEOs and firm performance, Journal of Empirical Finance, 16, 136-150.
Amihud, Y., 2002, Illiquidity and stock returns: Cross-section and time-series effects, Journal of Financial Markets, 5, 31-56.
Ammann, M., and Steiner, M., 2008, Risk factors for the Swiss stock market, Swiss Journal of Economics and Statistics, 144, 1-35.
Anderson, R. C., and Lee, D. S, 1997, Ownership studies: The data source does matter, Journal of Financial and Quantitative Analysis, 32, 311-329.
Anderson, R. C., and Reeb, D. M., 2003, Founding-family ownership and firm performance: Evidence from the S&P500, The Journal of Finance, 58, 1301-1328.
Andres, C., 2008, Large shareholders and firm performance: An empirical examination of founding-family ownership, Journal of Corporate Finance, 14, 431-445.
Bennedsen, M., Nielson, K. M., Perez-Gonzalez, F., and Wolfenzon, D., 2007, Inside the family firm: The role of families in succession decisions and performance, The Quarterly Journal of Economics, 122, 647-691.
Brennan, M., Chordia, T., and Subrahmanyam, A., 1998, Alternative factor specifications, security characteristics, and the cross-section of expected stock returns, Journal of Financial Economics, 49, 345-375.
Brown, L. D., 1997, Analyst forecasting errors: Additional evidence, Financial Analysts Journal, 53, 81-88.
Carhart, M. M., 1997, On persistence in mutual fund performance, The Journal of Finance, 52, 57-82.
Carney, R., and Child, T., 2013, Changes to the ownership and control of East Asian corporations between 1996 and 2008: The primacy of politics, Journal of Financial Economics, 107, 494-513.
Cella, C., 2009, Ownership Structure and Stock Market Returns, Working Paper, Kelley School of Buisness, Indiana University.
Core, J. E., Guay, W. R., and Rusticus, T. O., 2006, Does weak governance cause weak stock returns? An examination of firm operating performance and investors’ expectations, The Journal of Finance, 61, 655-687.
26
Corstjens, M., Peyer, U., and Van der Heyden, L., 2006, Performance of Family Firms: Evidence from US and European Firms and Investors, Working Paper, INSEAD. Djankov, S., La Porta, R., Lopez de Silanes, F., and Shleifer, A., 2008, The law and economics
of self-dealing, Journal of Financial Economics 88, 430-465.
Dlugosz, J., Fahlenbrach, R., Gompers, P., and Metrick, A., 2006, Large blocks of stock: Prevalence, size, and measurement, Journal of Corporate Finance, 12, 594-618.
Edmans, A., 2011, Does the stock market fully value intangibles? Employee satisfaction and equity prices, Journal of Financial Economics, 101, 621-640.
Faccio, M., and Lang, L., 2002, The ultimate ownership of Western European corporations, Journal of Financial Economics, 65, 365-395.
Fahlenbrach, R., 2009, Founder-CEOs, investment decisions, and stock market performance, Journal of Financial and Quantitative Analysis, 44, 439-466.
Fama, E. F., and French, K. R., 1992, Cross section of stock returns, The Journal of Finance, 67, 427-465.
Fama, E. F., and French, K. R., 1993, Common risk factors in the returns on stocks and bonds, Journal of Financial Economics, 33, 5-56.
Fama, E. F., and French, K. R., 1998, Value versus growth: The international evidence, The Journal of Finance, 53, 1975-1999.
Fama, E. F., and MacBeth, J., 1973, Risk, return, and equilibrium: Empirical tests, Journal of Political Economy, 81, 607-636.
Galanti, S., and Vaubourg, A. G., 2017, Optimism bias in financial analysts' earnings forecasts: Do commissions sharing agreements reduce conflicts of interest?, Economic Modelling, in press.
Giroud, X., and Mueller, H. M., 2011, Corporate governance, product market competition, and equity prices, The Journal of Finance, 66, 563-600.
Gompers, P., Ishii, J., and Metrick, A., 2003, Corporate Governance and Equity Prices, The Quarterly Journal of Economics, 118, 107-156.
Griffin, J. M., 2002, Are the Fama and French factors global or country specific?, Review of Financial Studies, 15, 783-803.
Holderness, C. G., 2009, The myth of diffuse ownership in the United States, Review of Financial Studies, 22, 1377-1408.
27
Isakov, D., and Weisskopf, J.-P., 2014, Are founding families special blockholders? An investigation of controlling shareholder influence on firm performance, Journal of Banking & Finance, 41, 1-16.
Isakov, D., and Weisskopf, J.-P., 2015, Pay-out policies in founding family firms Journal of Corporate Finance, 33, 330-344.
Jegadeesh, N., and Titman, S., 1993, Returns to buying winners and selling losers: Implications for stock market efficiency, Journal of Finance, 48, 65-91.
La Porta, R., Lopez de Silanes, F., and Shleifer, A., 1999, Corporate ownership around the world, The Journal of Finance, 54, 471-517.
La Porta, R., Lopez de Silanes, F., Shleifer, A., and Vishny, R. W., 1998, Law and finance, Journal of Political Economy, 106, 1113-1155.
Lilienfeld-Toal, U., and Ruenzi, S., 2014, CEO ownership, stock market performance, and managerial discretion, The Journal of Finance, 69, 1013-1050.
Lowinski, F., Schiereck, D., and Thomas, T., 2004, The effect of cross-border acquisitions on shareholder wealth—Evidence from Switzerland, Review of Quantitative Finance and Accounting, 22, 315-330.
McConnell, J. J., and Servaes, H., 1990, Additional evidence on equity ownership and corporate value, Journal of Financial Economics, 27, 595-612.
Miralles-Marcelo, J. L., Miralles-Quriós, M. M., and Lisboa, I., 2013, The stock performance of family firms in the Portuguese market, Applied Financial Economics, 23, 1721-173.
Morck, R. K., Shleifer, A., and Vishny, R. W., 1988, Management ownership and market valuation: An empirical analysis, Journal of Financial Economics, 20, 293-315.
Perez-Gonzalez, F., 2006, Inherited control and firm performance, American Economic Review, 96, 1559-1588.
Schmid, T., 2013, Control considerations, creditor monitoring, and the capital structure of family firms, Journal of Banking & Finance, 37, 257-272.
Villalonga, B., and Amit, R., 2006, How do family ownership, control and management affect firm value?, Journal of Financial Economics, 80, 385-418.
World Federation of Exchanges, 2016, Monthly Report (January 2016). Retrieved from: https://www.world-exchanges.org (04.10.2017).
28
Table 1: Sample composition and evolution over the time
This table presents the composition of the entire sample, which includes 195 companies for 2003–2013 (19,604 firm-month observations). The table also presents the mean of the main different dummy variables related to the ownership structure. The variables are described in the Appendix. A company is considered controlled by a shareholder if he is the largest shareholder and holds more than 20% of the voting rights. Column 1 shows the results for the entire period, while columns 2–4 show the composition of the first, middle, and last year, respectively. Columns 5–7 present the average number of firms per year for the entire period, as well as the minimum and maximum number of firms.
All 2003 2008 2013 Number of firms per year
Mean Mean Mean Mean Mean Min Max
(1) (2) (3) (4) (5) (6) (7)
Widely held firms 0.33 0.35 0.36 0.29 49.7 41 55
Family firms 0.35 0.38 0.35 0.33 52.8 46 60
Family firms at founder stage 0.12 0.13 0.13 0.11 18.8 14 23
Family firms at descendant stage
0.23 0.25 0.22 0.22 34.0 31 37
Family active 0.22 0.25 0.23 0.19 33.9 25 43
Family non-active 0.13 0.13 0.12 0.14 18.9 15 21
Family with founder CEO 0.04 0.04 0.03 0.03 5.5 3 8
Family without founder CEO 0.31 0.34 0.32 0.30 47.3 40 54
Other blockholders 0.32 0.27 0.29 0.38 47.5 40 58
State 0.05 0.04 0.05 0.05 7.6 6 9
Private investor 0.15 0.12 0.13 0.21 21.6 17 30
Widely held corporation 0.05 0.08 0.03 0.04 7.6 5 12
Widely held financial 0.04 0.01 0.04 0.04 5.8 1 9
Miscellaneous 0.03 0.02 0.04 0.04 4.9 3 6