ORIGINAL PAPER
In vivo studies of brain metabolism in animal models
of Hepatic Encephalopathy using
1
H Magnetic
Resonance Spectroscopy
Cristina Cudalbu
Received: 1 October 2012 / Accepted: 26 November 2012 / Published online: 21 December 2012 # Springer Science+Business Media New York 2012
Abstract Hepatic encephalopathy (HE) is a common and severe neuropsychiatric complication present in acute and chronic liver disease. The unique advantages of high field
1
H MRS provide a method for assessing pathogenic mech-anism, diagnosis and monitoring of HE, as well as for treatment assessment or recovery after liver transplantation, in a reproducible and reliable non-invasive way. The pur-pose of the present review is to present some new features of in vivo proton Magnetic Resonance Spectroscopy (1H MRS) at high magnetic fields combined with some basic requirements for reliable metabolic profiling. Finally, in vivo applications of1H MRS in different HE animal models are presented.
Keywords In vivo short echo time1H MRS . Quantification of neurochemical profile . Hepatic encephalopathy . Chronic liver disease . Acute liver failure . Hyperammonemia
Introduction
Hepatic encephalopathy (HE) is a common and severe neu-ropsychiatric complication present in acute and chronic liver disease (i.e. 30 to 50 % of patients with cirrhosis exhibit HE (Munoz2008)), which is characterized by an array of cog-nitive and fine motor deficits progressively leading to al-tered mental status, coma and death (Norenberg et al.2009;
Caudle et al.2010; Butterworth2003). Minimal HE (mHE) occurs in approximately 70 % of the patients with chronic liver disease (CLD) and is defined by the presence of cognitive impairment on psychometric testing in absence of any overt clinical signs (McPhail and Taylor-Robinson
2010). The diagnosis of HE is traditionally done using neuropsychological tests together with the assessment of liver function, but it lacks consensus and has never been standardized especially in mHE (Rovira et al. 2008; McPhail and Taylor-Robinson 2010). Consequently, there is an urgent need for new unified tools for reliable diagnostic in HE.
Although, the molecular basis for the neurological disor-der in HE remains elusive, increasing evidence points to ammonia as a key factor (Braissant et al.2012; Cagnon and Braissant2007; Felipo and Butterworth2002; Norenberg et al. 2009; Butterworth 2003; Cooper and Plum 1987). Ammonia is mainly produced in the gut by intestinal urease-positive bacteria and amino acid metabolism, and under normal circumstances undergoes a high degree of extraction by the urea cycle in the liver. In addition to the gut sources, it was reported the ammonia can be liberated by kidney or muscle during and after vigorous exercise (Cooper and Plum 1987). In the diseased liver ammonia passes into the blood circulation and thereby enters the brain through the blood–brain barrier, where its main toxic effects occur. Cerebral ammonia removal relies on formation of glutamine by glutamine synthetase (GS) in astrocytes. It is hypothesized that the unique astrocytic expression of GS (Norenberg1979) underlies the relative sensitivity of astro-cytes to ammonia, leading to astroastro-cytes swelling and finally to brain edema.
The precise mechanisms and their relative contributions leading to astrocytes swelling and consequently to brain edema are very complex and not fully elucidated, but recent studies showed that the main pathogenic mechanisms
Sources of support Supported by Centre d’Imagerie BioMédicale (CIBM) of the UNIL, UNIGE, HUG, CHUV, EPFL; the Leenaards and Jeantet Foundations.
C. Cudalbu (*)
Ecole Polytechnique Fédérale de Lausanne (EPFL),
Laboratory for Functional and Metabolic Imaging (LIFMET), Station 6, CH F1 602 (Bâtiment CH),
1015 Lausanne, Switzerland e-mail: [email protected]
involved in HE are the following: amino acids disturbances; alterations in neurotransmission; cerebral energy distur-bance; alteration of nitric oxide synthesis and oxidative stress which leads to induction of the mitochondrial perme-ability transition; impairment of axonal and dendritic growth during brain development; signaling transduction pathways; alterations in channels and transporters activity (Braissant et al. 2012; Cagnon and Braissant 2007; Butterworth 2003; Felipo and Butterworth2002; Norenberg et al.2009; Leke et al.2011; Cooper and Plum1987; Brusilow and Traystman
1986; Brusilow et al.2010). In this context, several hypoth-eses have been proposed, suggesting that a byproduct of ammonia metabolism rather than ammonia per se could be the main cause of ammonia toxicity to the brain. Approxi-mately 25 years ago the osmotic gliopathy theory (gluta-mine hypothesis) was elaborated, postulating that gluta(gluta-mine can act as an osmolyte and that its increase leads to a shift of water into astrocytes (Brusilow and Traystman1986). Recent-ly, another hypothesis was proposed, the“Trojan horse”, where glutamine acts as a carrier of ammonia across the mitochon-drial membrane. Once in the mitochondria, glutamine is hy-drolyzed by phosphate-activated glutaminase to glutamate and ammonia, which further gives rise to excessive production of free radicals inducing opening of the mitochondrial permeabil-ity transition (Albrecht and Norenberg 2006). More details about the hypotheses, related evidences and controversies can be found in (Brusilow et al.2010; Desjardins et al.2012; Rama Rao et al.2012).
Although there is extensive research examining the bio-chemistry of ammonia-induced glutamine accumulation and energy failure in cultured astrocytes and neurons, in vivo data are often missing. The importance of in vivo data cannot be understated when it comes to astrocyte and neu-ronal metabolism, as both cell types are exquisitely sensitive to certain drugs, and certainly to ischemia. Understanding the pathogenic mechanisms involved in HE, finding the reliable markers which would assess in a reproducible way the different degrees of HE or unraveling new therapeutic targets to protect the brain form ammonia toxicity, requires experimental models focusing on the brain in its cellular complexity, with neurons and glial cells interacting together (in vivo rodent models, ex-vivo CNS organotypic cultures, in vitro primary 3D brain cell cultures in aggregates).
In the last decades, Magnetic Resonance Imaging (MRI) and Magnetic Resonance Spectroscopy (MRS) became powerful and reliable diagnostic tools with unique advan-tages: they are applicable in vivo, non-invasively and con-sequently longitudinally, thus allowing to monitor disease progression and/or effect of treatment, and made a bridge between the clinical diagnostics and basic research. There-fore, MRI combined with MRS might provide a method for assessing pathogenic mechanisms, diagnosis and monitor-ing of HE, as well as for treatment assessment or recovery
after liver transplantation in a reproducible and reliable non-invasive way.
The present review will focus on presenting some new features of in vivo proton Magnetic Resonance Spectrosco-py (1H MRS) at high magnetic fields combined with some basic requirements for reliable metabolic profiling. Finally, in vivo applications of1H MRS in different HE animal models will be presented.
In vivo Proton Magnetic Resonance Spectroscopy at high fields
Proton Magnetic Resonance Spectroscopy (1H MRS) has proven to be a powerful tool to non-invasively investigate in vivo brain metabolism of animals and humans in different neurological disorders (Williams 1999). Some studies reported the in vivo investigation and monitoring of HE using 1H MRS in humans and animal models (Cauli et al.
2011; Cauli et al.2007; Cudalbu et al.2012b; Cudalbu et al.
2010; Fitzpatrick et al.1989; Nyberg et al.1998; Shen et al.
1998; Braissant et al.2012; Haussinger et al.2000; Rovira et al. 2008; Spahr et al.2002; Williams1999; Bates et al.
1989; McPhail and Taylor-Robinson 2010; Butterworth
2003; Kreis et al. 1991; Kreis et al. 1992; Ross et al.
1994). The main finding of these studies was the increase in brain glutamine concentration.
In humans, previously published studies were performed at magnetic fields of 1.5 T and only few at 3 T, using echo times (TE)≥20 ms and leading to the quantification of only few metabolites (i.e. sum of glutamine and glutamate, total creatine, total choline and myo-inositol) (Rovira et al.2008; Haussinger et al. 2000; Spahr et al. 2002; Cordoba et al.
2002; Cordoba et al. 2001; Williams 1999; Butterworth
2003; Kreis et al. 1991; Kreis et al. 1992; Ross et al.
1994). As shown by these studies, several pathogenic mech-anisms involved in HE can be explored in vivo using 1H MRS, e.g. amino acid disturbances (e.g. modifications in the concentrations of glutamine, glutamate), osmoregulation (e.g. decrease of myo-inositol, total choline concentrations), cerebral energy disturbance (e.g. increase in lactate concen-tration). However, at magnetic fields of 1.5 T the separation of glutamine and glutamate is not possible, while at 3 T is difficult, therefore only the sum of these two metabolites (named as Glx) was reported. Additionally, at longer echo times (TE above 20 ms), the number of spectral lines, which can be used for quantification, is reduced. This is due to phase distortion of multiplets produced by coupled spin systems and to fast transversal relaxation (T2 relaxation)
leading to signal reduction, which prevents observation of small peaks in the spectrum. Moreover, correction factors for the T2relaxation times when performing absolute
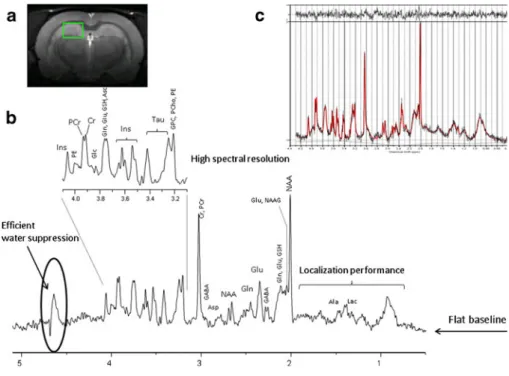
In this context, the detection of additional brain metabolites is required to accurately assess the pathogenic mechanisms and for monitoring/diagnostic in HE. The high magnetic field strengths (≥7 T) combined with the possibility of acquiring spectra at very short echo time (<10 ms) have increased the number of in vivo detectable brain metabolites to about 20 metabolites in animal models and humans. This so-called neurochemical profile at high magnetic fields comprises: glu-cose (Glc), lactate (Lac), creatine (Cr), phosphocreatine (PCr), alanine (Ala) (markers of energy metabolism); phosphocholine (PCho), glycerophosphocholine (GPC), phosphoethanolamine (PE), N-acetylaspartate (NAA), N-acetylaspartylglutamate (NAAG) (markers of myelination/cell proliferation); glutamate (Glu), glutamine (Gln), aspartate (Asp), γ-aminobutyrate (GABA), glycine (Gly) (markers of neurotransmitter metabo-lism); taurine (Tau), myo-inositol (Ins) (markers of osmoregu-lation) and ascorbate (Asc), glutathione (GSH) (antioxidants) (Fig.1b and c).
Overall, increased intrinsic signal-to-noise ratio (in-creased sensitivity), chemical shift dispersion (in(in-creased spectral resolution) and decreased strong coupling effects are the main benefits of high magnetic fields, which are expected to be useful for low concentration metabolites, strongly overlapped metabolites and for metabolites having complex multiplet patterns, leading to an improved quanti-fication precision and accuracy (Mekle et al.2009; Mlynarik et al. 2008a; Tkac et al. 2009). Moreover, acquisitions performed at a short echo time enable to obtain high quality spectra with resolved lines of many metabolites due to minimal phase distortions of multiplets of coupled spin systems such as Glu, Gln, Ins, Glc, Asp, Ala, GABA, Asc, PE, Gly and Tau (Mekle et al.2009; Mlynarik et al.2008a;
Tkac et al.2009), thus increasing the amount of biochemical information. Signal loss due to T2relaxation is reduced and
consequently a more precise quantification is expected. Acquisitions at short TE and long repetition times (TR) (fully relaxed spectra) are considered to be a good choice for absolute quantification, since the effects of relaxation are minimized. Macromolecule contributions at short echo times need also to be considered. Several techniques have been used to overcome this issue and were presented more in details elsewhere (Cudalbu et al.2012c).
These advantages of high magnetic field spectroscopy are also accompanied by some factors that can decrease the spectral quality and consequently the quantification preci-sion. A main factor is related to the increased peak line-widths (in Hz) since magnetic field inhomogeneities increase with the magnetic field due to the fact that magnetic susceptibility differences between tissues, blood, bone and air (in Hz) are proportional to the static magnetic field (B0).
Resonance frequency of nuclear spins is proportional to a magnitude of the B0. When B0is spatially inhomogeneous,
resonance frequency of 1H nuclei is not the same over the measured volume of a tissue, resulting in broadening spec-tral lines and in decreasing specspec-tral resolution and signal-to-noise ratio. An adjustment of the B0inhomogeneity for1H
MRS is technically rather challenging in rodent brain due to the small size of the brain, and powerful first- and second-order B0corrections (shims) are necessary (Tkac and Gruetter
2005). A second factor is the chemical shift displacement error which is related to frequency selective localization. The use of stronger magnetic fields gradients can limit this artefact; how-ever, attention has to be paid to eddy current effects on the B0
stability. T1relaxation times have been shown to increase with
Fig. 1 a In vivo T2weighted image acquired in the rat brain at 9.4 T showing the localization of the volume of interest in the hippocampus; b In vivo1H MRS spectrum acquired using the SPECIAL sequence in the hippocampus of the rat brain at 9.4 T (TE02.8 ms, TR04 s, 160 averages, 10 min of acquisition). Note the high spectral resolution obtained with efficient B0 shimming, the efficient water suppression, the localization performances and the flat baseline, c LCModel quantification result, from bottom to top: the raw in vivo spectrum (in black), the LCModel fit (in red) and the quantification residual
magnetic field (de Graaf et al. 2006) leading to increased signal saturation for shorter repetition times (TR). This can be overcome by increasing TR, which in turn would increase the total acquisition time or decrease signal-to-noise in the same total acquisition time. However, no further increase in T1
relaxation times has been observed beyond 9.4 T (Cudalbu et al.2009).
The main goal of localized in vivo1H MRS is the reliable quantification of the concentration of as many metabolites as possible in a well-defined region of the brain. Metabolite concentration ratios are often used as markers of changes in brain metabolite concentrations. However, for an accurate interpretation of these changes in different neurological dis-eases, absolute metabolite concentrations can be more valu-able. Accurate and precise quantification of brain metabolites, independently of the magnetic field, is challenging and depends on: 1) spectral quality (signal–to-noise ratio, spectral resolution, water suppression, localization performances, baseline, chemical shift displacement error and eddy current correction), 2) reliable data processing (estimate of the signal amplitude or peak area); 3) quantification strategies (conver-sion into concentration units). Overall, the main features of a good quality spectrum acquired in the hippocampus of the rat brain are shown in Fig.1b. The signal-to–noise ratio depends
on: the efficiency of B0shimming, the performances of
radio-frequency coils and localization sequences, the B0 field
strength, the precise adjustment of rephasing gradients in localization sequences and subject motion. Poor water sup-pression can lead to the presence of residual water signal in the acquired spectrum and consequently affects the spectral base-line (a flat basebase-line is critical for reliable quantification). Localization performance of the acquisition sequence repre-sents the ability to provide a maximum signal from a selected volume with minimum contamination from outside. The sub-cutaneous lipids represent the main source of contamination in the region 0.5–2 ppm and their presence, typically as phase distorted signals, could lead to an overestimation of the metab-olites present in this spectral region (e.g. lactate, alanine, GABA). The use of outer volume suppression bands (OVS) can limit this contamination (Mlynarik et al.2008a; Tkac and Gruetter2005). Any misadjustment of the parameters in the pulse sequence can affect the spectral quality leading to unre-liable metabolite concentrations.
The choice of the data processing method is also impor-tant, since many algorithms depend on user input which leads to additional inaccuracies. Metabolite concentrations are usually determined by fitting the measured in vivo1H MRS spectrum to a linear combination of spectra of indi-vidual metabolites (the metabolite basis set), making feasi-ble the quantification especially for low concentration metabolites (Cudalbu et al. 2012c; Mlynarik et al. 2008a; Tkac et al.2009) (Fig.1c). The metabolite basis set can be obtained by measuring aqueous solutions of pure metabolites
(under the identical conditions as the in vivo spectra) or by quantum mechanics simulations, based on the density-matrix formalism, using published values of spin-spin coupling constants and chemical shifts, and the relevant acquisition parameters (Cudalbu et al. 2008; Cudalbu et al. 2012c). Well-known time and frequency–domain algorithms, based on metabolite basis sets, are currently used for accurate quantification (i.e. QUEST from jMRUI software working in the time domain, LCModel working in the frequency domain, AQSES working in time domain and TDFD work-ing in both time and frequency domains) (Fig.1c).
While 1H MRS (also called single voxel spectroscopy) allows signal detection from a well-defined single volume, usually positioned in a specific brain region, proton spec-troscopic imaging (1H MRSI), also called chemical shift imaging (CSI), allows the simultaneous detection of multi-ple spectra from different brain regions and thus the spatial distribution of metabolites in various regions of the brain can be efficiently studied. Spectroscopic imaging can be per-formed in rodents withμL spatial resolution, which is com-parable in resolution to animal positron emission tomography (PET) (Mlynarik et al.2008b).
1H MRS in models of hyperammonemia
Since ammonia is believed to be the main culprit in HE, several animal models of hyperammonemia (HA) were used to study the effect of ammonia per se without liver failure (e.g. single i.p. injection of ammonia or continuous infusion for several hours). Very few studies have used in vivo1H MRS and 1H MRSI to investigate brain metabolism in animal models of HA without liver failure (Cudalbu et al. 2012b; Cauli et al.2007; Fitzpatrick et al.1989; Cudalbu et al.2010). There are two ways in which the brain can metabolize ammo-nia: the reductive amination ofα-ketoglutarate to glutamate via the glutamate dehydrogenase reaction (GDH) and the synthesis of glutamine from glutamate and ammonia by glu-tamine synthetase reaction (GS), the last being the major metabolic pathway for ammonia detoxification (Brusilow et al.2010; Cooper2011,2012).
Our group recently studied the brain metabolism in ani-mal models of HA without liver failure using in vivo 1H MRS and 1H MRSI (Cudalbu et al.2012b; Cudalbu et al.
2010). Using 1H MRS at high magnetic field (9.4 T) we showed that the Gln concentration increased immediately after the starting of ammonium infusion and continued to increase linearly over time (2.3 ± 0.4 μmol/g before the infusion which increased to 17.7±4.0μmol/g at the end of the infusion) without significant changes in the concentra-tion of other brain metabolites (Fig. 2a). The linear and continuous increase of total Gln during the period of am-monium chloride infusion observed in our in vivo1H MRS
data implies increased anaplerosis (Berl et al.1962; Shen et al.1998; Zwingmann2007), which appears to be coupled to the ammonia detoxification pathway. From the linear fit of the time courses of total Gln we obtained a net Gln accu-mulation of 0.033±0.001μmol/g/min, suggesting no delay in Gln accumulation and consequently in anaplerosis. We further continued our studies on HA by mapping brain metabolism in different brain regions in the same rat model using1H MRSI (Cudalbu et al.2010). Figure2billustrates the metabolic maps of Gln, superimposed on the anatomical T2w images and acquired at different time points during
ammonium chloride infusion. As for the data obtained using
1
H MRS, the increase in the Gln pool at different time points during infusion was apparent from the maps with no sub-stantial differences for the other brain metabolites. Even though before infusion, the Gln map did not show any substantial differences among brain regions, during infusion the Gln increase showed a specific brain region pattern, i.e. higher in cortex than in hippocampus (at 5.5 h of NH4+infusion: 16.2 ± 2.7 μmol/g in the cortex and 11.5±
1.2 μmol/g in the hippocampus, p00.03) (Fig. 2b). Consequently, these results showed a higher net gluta-mine synthesis flux in cortex than in hippocampus. In a similar way, Cauli et al (2007) performed single voxel1H MRS in cerebellum and substrantia nigra after i.p. injection of ammonium acetate. Surprisingly, they did not report the Gln concentrations, however they showed a decrease of NAA in cerebellum and an increase of Ins in both investigated brain
regions, which were prevented by blocking the NMDA recep-tors. The decrease of NAA was reported to reflect neuronal damage, whereas Ins increase was suggestive of the presence of vasogenic edema. Moreover, the authors in (Fitzpatrick et al. 1989) showed a decrease in Glu concentrations and an increase in Lac concentrations additionally to Gln increase during ammonium acetate infusion using single voxel 1H MRS. The authors suggested that the increase of Lac was more likely a result of a mismatch between the rate of glycol-ysis and the activity of tricarboxylic acid cycle (TCA), rather than an attempt by the brain to buffer incoming ammonia.
1H MRS in models of acute liver failure
In vivo1H MRS has also been used to study brain metabolism in few experimental models of acute liver failure (ALF) (e.g. galactosamine or carbon tetrachloride administration, porto-caval anastomosis followed by hepatic artery ligation, etc.) (Nyberg et al.1998; Chavarria et al.2010; Cauli et al.2011; Bates et al.1989; Bosman et al.1990). As for HA models, these studies reported an increase of brain Gln concentration in ALF. In addition, these studies reported alterations in brain lactate concentration at later stages of the disease and the presence of brain edema. The authors reported that these changes in brain metabolism were probably caused by the exposure of the brain to ammonia (Chavarria et al.2010). The mechanisms leading to an increase of Lac are not clear,
Fig. 2 a In vivo brain1H MRS spectra acquired in a rat model of HA at 9.4 T. From top to bottom spectrum acquired before ammonium infusion and spectrum acquired after 9 h of infusion; b In vivo metabolic maps of glutamine acquired in a rat brain during ammonium infusion, superim-posed on the anatomical T2weighted images and acquired at different time
points before and during infusion; c In vivo metabolic maps of glutamine acquired in a rat brain before and 5 weeks after BDL, and superimposed on the anatomical T2weighted images; d In vivo brain1H MRS spectra acquired in a rat model of CLD at 9.4 T. From top to bottom spectrum acquired before BDL and spectrum acquired 8 weeks after BDL
however this increase might be an indicator of brain energy impairment secondary to ammonia-induced brain edema (Chavarria et al.2010). In the same context, it was shown ex-vivo (brain extracts) that lactate and alanine synthesis was increased in ALF using high resolution1H/13C nuclear mag-netic resonance spectroscopy (Chatauret et al.2003). This study suggested that a disturbance in brain glucose metabo-lism rather than Gln accumulation might be the major cause of cerebral complications in ALF.
1H MRS in models of chronic liver disease
While few studies using biochemical methods have been performed ex-vivo (brain extracts) or on cultured cells (astrocytes or neurons), no in vivo longitudinal 1H MRS studies were performed, to our knowledge, in experimental animal models of chronic liver disease (CLD) to assess the kinetics of glutamine, brain osmolyte changes and/or brain edema in combination with brain energy metabolism using
1
H MRS. These previous ex-vivo studies reported increased cerebral glutamine and ammonia levels with sometimes reductions in brain osmolytes reflecting disturbances in cell-volume homeostasis. It has been suggested that the differences in brain osmolytes could partially explain the differences in frequency of brain edema between acute and chronic liver failure (Cordoba et al. 1998; 1996; Cordoba
1996). In a recent study, our group characterized for the first time the in vivo and longitudinal progression of HE in a rat model of CLD using1H MRS,1H MRSI (Fig.2c and d) and Diffusion Tensor Imaging (DTI) (Cudalbu et al.2012a). We imaged the in vivo spatial distribution of 12 metabolites (i.e. Gln, Glu, Cr, PCr, tCho, Ins, Tau, Lac, NAA + NAAG, PE, Glc, GABA) in various brain structures (cortex, hippocam-pus and thalamus) before and weekly (for 8 weeks) after CLD induced by bile duct ligation (BDL). Our preliminary data showed that Gln was increased at all time points after BDL reaching ~300 % at 8 weeks. Among the other brain osmolytes only Ins and tCho decreased significantly over time (~10 % in the first week, reached ~30 % and even~80 % for tCho 8 weeks after BDL), whereas Tau showed a smaller (~10–20 %) but significant decrease. The sum of the main brain osmolytes (Gln, Ins, tCho, Tau, Cr) was constant over time, presumably to compensate for the Gln increase. It is interesting to note the cellular localization of these brain osmolytes: Ins was reported to be highly concentrated in glial cells (Brand et al.1993) and Tau to be present in both neurons and astrocytes (Urenjak et al.1993). The osmotic imbalance created by the continuous increase of Gln is likely to be compensated by a concomitant decrease of other idiogenic osmolytes resulting in minimal brain edema (as suggested by the DTI measurements), prior to the appearance of severe neurological signs in CLD.
Finally, it has to be emphasized that the differences in the neurochemical profile between HA and CLD are clearly visible when comparing Fig.2a and d. Even though Gln was increased in both cases, the decrease in the brain osmolytes was present only in CLD. Additionally, in CLD glutamine increased sim-ilarly in all brain regions, contrary to HA where we measured a higher increase of Gln in the cortex (Fig.2b and c).
Conclusion and future perspectives
As can be seen from the present review,1H MRS has proven to be a very useful tool for assessing several pathological mechanisms involved in HE and also for performing an overall diagnostic in HE using the increase of brain gluta-mine as a bio-marker and the concomitant decrease of other brain osmolytes (e. Ins, tCho) in CLD. The non-invasive applicability of this technique combined with the unique advantages of high magnetic fields allows, as shown here, a longitudinal assessment of brain glutamine concentrations during disease progression (in humans and animal models), as well as of energy metabolism (Glc, Ala, Lac, Cr, PCr), osmoregulation, neurotransmitter metabolism (Asp, GABA, Gly, Glu) and oxidative stress (Asc, GSH). The extraordi-nary developments in1H MRS combined with other in vivo MR imaging/spectroscopy techniques (DTI,13C MRS, 31P MRS, etc.) promises new perspectives for a better under-standing of pathogenic mechanisms involved in HE but also for a more reliable diagnostic in HE by establishing precise correlations between different profiles of metabolites and the degrees of HE.
Acknowledgments Supported by Centre d’Imagerie BioMédicale (CIBM) of the UNIL, UNIGE, HUG, CHUV, EPFL, the Leenaards and Jeantet Foundations. The author thanks Dr O. Braissant (Service of Biomedicine, Lausanne University Hospital (CHUV), Lausanne, Switzerland) and Dr V. McLin (Pediatric Gastroenterology Unit, Department of Child and Adolescent, University Hospitals of Geneva (HUG), Geneva, Switzerland) the main collaborators on the project briefly presented in the present review and Drs V. Mlynarik and B. Lanz (Laboratory for Functional and Metabolic Imaging (LIFMET), Ecole Polytechnique Fédérale de Lausanne (EPFL), Lausanne, Switzerland) for reviewing the manuscript.
References
Albrecht J, Norenberg MD (2006) Glutamine: a Trojan horse in am-monia neurotoxicity. Hepatology 44(4):788–794
Bates TE, Williams SR, Kauppinen RA, Gadian DG (1989) Observa-tion of cerebral metabolites in an animal-model of acute liver-failure invivo - a H-1 and P-31 nuclear magnetic-resonance study. J Neurochem 53(1):102–110
Berl S, Takagaki G, Clarke DD, Waelsch H (1962) Metabolic compart-ments in vivo. Ammonia and glutamic acid metabolism in brain and liver. J Biol Chem 237:2562–2569
Bosman DK, Deutz NE, De Graaf AA, van den Hulst RW, Van Eijk HM, Bovee WM, Maas MA, Jorning GG, Chamuleau RA (1990) Changes in brain metabolism during hyperammo-nemia and acute liver failure: results of a comparative 1H-NMR spectroscopy and biochemical investigation. Hepatology 12 (2):281–290
Braissant O, McLin VA, Cudalbu C (2012) Ammonia toxicity to the brain. J Inherit Metab Dis Oct 30. [Epub ahead of print] Brand A, Richter-Landsberg C, Leibfritz D (1993) Multinuclear NMR
studies on the energy metabolism of glial and neuronal cells. Dev Neurosci 15(3–5):289–298
Brusilow SW, Traystman R (1986) Hepatic encephalopathy. N Engl J Med 314(12):786–787, author reply 787
Brusilow SW, Koehler RC, Traystman RJ, Cooper AJ (2010) Astrocyte glutamine synthetase: importance in hyperammonemic syndromes and potential target for therapy. Neurotherapeutics 7(4):452–470 Butterworth RF (2003) Pathogenesis of hepatic encephalopathy: new
insights from neuroimaging and molecular studies. J Hepatol 39 (2):278–285
Cagnon L, Braissant O (2007) Hyperammonemia-induced toxicity for the developing central nervous system. Brain Res Rev 56(1):183–197 Caudle SE, Katzenstein JM, Karpen SJ, McLin VA (2010) Language
and motor skills are impaired in infants with biliary atresia before transplantation. J Pediatr 156(6):936–940, 940 e931
Cauli O, Lopez-Larrubia P, Rodrigues TB, Cerdan S, Felipo V (2007) Magnetic resonance analysis of the effects of acute ammonia intoxication on rat brain. Role of NMDA receptors. J Neurochem 103(4):1334–1343
Cauli O, Lopez-Larrubia P, Rodrigo R, Agusti A, Boix J, Nieto-Charques L, Cerdan S, Felipo V (2011) Brain region-selective mechanisms contribute to the progression of cerebral alterations in acute liver failure in rats. Gastroenterology 140(2):638–645
Chatauret N, Zwingmann C, Rose C, Leibfritz D, Butterworth RF (2003) Effects of hypothermia on brain glucose metabolism in acute liver failure: a H/C-nuclear magnetic resonance study. Gas-troenterology 125(3):815–824
Chavarria L, Oria M, Romero-Gimenez J, Alonso J, Lope-Piedrafita S, Cordoba J (2010) Diffusion tensor imaging supports the cytotoxic origin of brain edema in a rat model of acute liver failure. Gastroenterology 138(4):1566–1573
Cooper AJ (2011) 13 N as a tracer for studying glutamate metabolism. Neurochem Int 59(4):456–464
Cooper AJ (2012) The role of glutamine synthetase and glutamate dehydrogenase in cerebral ammonia homeostasis. Neurochem Res 37(11):2439–2455
Cooper AJ, Plum F (1987) Biochemistry and physiology of brain ammonia. Physiol Rev 67(2):440–519
Cordoba J (1996) Glutamine, myo-inositol, and brain edema in acute liver failure. Hepatology 23(5):1291–1292
Cordoba J, Gottstein J, Blei AT (1996) Glutamine, myo-inositol, and organic brain osmolytes after portocaval anastomosis in the rat: implications for ammonia-induced brain edema. Hepatology 24 (4):919–923. doi:10.1002/hep.510240427
Cordoba J, Gottstein J, Blei AT (1998) Chronic hyponatremia exacer-bates ammonia-induced brain edema in rats after portacaval anas-tomosis. J Hepatol 29(4):589–594
Cordoba J, Alonso J, Rovira A, Jacas C, Sanpedro F, Castells L, Vargas V, Margarit C, Kulisewsky J, Esteban R, Guardia J (2001) The development of low-grade cerebral edema in cirrhosis is sup-ported by the evolution of (1)H-magnetic resonance abnormalities after liver transplantation. J Hepatol 35(5):598–604
Cordoba J, Sanpedro F, Alonso J, Rovira A (2002) 1H magnetic resonance in the study of hepatic encephalopathy in humans. Metab Brain Dis 17(4):415–429
Cudalbu C, Cavassila S, Rabeson H, van Ormondt D, Graveron-Demilly D (2008) Influence of measured and simulated basis sets
on metabolite concentration estimates. NMR Biomed 21(6):627– 636
Cudalbu C, Mlynarik V, Xin L, Gruetter R (2009) Comparison of T1 relaxation times of the neurochemical profile in rat brain at 9.4 tesla and 14.1 tesla. Magn Reson Med 62(4):862–867
Cudalbu C, Mlynárik V, Lanz B, Frenkel H, Costers N, Gruetter R (2010) Imaging glutamine synthesis rates in the hyperammonemic rat brain. In: Proc Intl Soc Mag Reson Med 18:3324
Cudalbu C, Braissant O, Lepore M, Gruetter R, McLin VA (2012a) Brain osmolytes and brain edema in a rat model of chronic liver failure: in vivo longitudinal 1H spectroscopic imaging and diffusion tensor imaging studies at 9.4T. 15th ISHEN Symposium O7
Cudalbu C, Lanz B, Duarte JM, Morgenthaler FD, Pilloud Y, Mlynarik V, Gruetter R (2012b) Cerebral glutamine metabolism under hyperammonemia determined in vivo by localized (1)H and (15)N NMR spectroscopy. J Cereb Blood Flow Metab 32 (4):696–708
Cudalbu C, Mlynarik V, Gruetter R (2012c) Handling macromolecule signals in the quantification of the neurochemical profile. J Alzheimers Dis 31:S101–S115
de Graaf RA, Brown PB, McIntyre S, Nixon TW, Behar KL, Rothman DL (2006) High magnetic field water and metabolite proton T1 and T2 relaxation in rat brain in vivo. Magn Reson Med 56 (2):386–394
Desjardins P, Du T, Jiang W, Peng L, Butterworth RF (2012) Pathogen-esis of hepatic encephalopathy and brain edema in acute liver failure: role of glutamine redefined. Neurochem Int 60(7):690–696 Felipo V, Butterworth RF (2002) Neurobiology of ammonia. Prog
Neurobiol 67(4):259–279
Fitzpatrick SM, Hetherington HP, Behar KL, Shulman RG (1989) Effects of acute hyperammonemia on cerebral amino acid metab-olism and pHi in vivo, measured by 1H and 31P nuclear magnetic resonance. J Neurochem 52(3):741–749
Haussinger D, Kircheis G, Fischer R, Schliess F, vom Dahl S (2000) Hepatic encephalopathy in chronic liver disease: a clinical mani-festation of astrocyte swelling and low-grade cerebral edema? J Hepatol 32(6):1035–1038
Kreis R, Farrow N, Ross BD (1991) Localized 1H NMR spectroscopy in patients with chronic hepatic encephalopathy. Analysis of changes in cerebral glutamine, choline and inositols. NMR Biomed 4(2):109–116
Kreis R, Ross BD, Farrow NA, Ackerman Z (1992) Metabolic disor-ders of the brain in chronic hepatic encephalopathy detected with H-1 MR spectroscopy. Radiology 182(1):19–27
Leke R, Bak LK, Anker M, Melo TM, Sorensen M, Keiding S, Vilstrup H, Ott P, Portela LV, Sonnewald U, Schousboe A, Waagepetersen HS (2011) Detoxification of ammonia in mouse cortical GABAergic cell cultures increases neuronal oxidative metabolism and reveals an emerging role for release of glucose-derived alanine. Neurotox Res 19(3):496–510
McPhail MJ, Taylor-Robinson SD (2010) The role of magnetic reso-nance imaging and spectroscopy in hepatic encephalopathy. Metab Brain Dis 25(1):65–72
Mekle R, Mlynarik V, Gambarota G, Hergt M, Krueger G, Gruetter R (2009) MR spectroscopy of the human brain with enhanced signal intensity at ultrashort echo times on a clinical platform at 3 T and 7 T. Magn Reson Med 61(6):1279–1285
Mlynarik V, Cudalbu C, Xin L, Gruetter R (2008a) 1H NMR spectroscopy of rat brain in vivo at 14.1Tesla: improvements in quantification of the neurochemical profile. J Magn Reson 194 (2):163–168
Mlynarik V, Kohler I, Gambarota G, Vaslin A, Clarke PG, Gruetter R (2008b) Quantitative proton spectroscopic imaging of the neuro-chemical profile in rat brain with microliter resolution at ultra-short echo times. Magn Reson Med 59(1):52–58
Munoz SJ (2008) Hepatic encephalopathy. Med Clin North Am 92 (4):795–812, viii
Norenberg MD (1979) Distribution of glutamine synthetase in the rat central nervous system. J Histochem Cytochem 27(3):756–762 Norenberg MD, Rama Rao KV, Jayakumar AR (2009) Signaling
factors in the mechanism of ammonia neurotoxicity. Metab Brain Dis 24(1):103–117
Nyberg SL, Cerra FB, Gruetter R (1998) Brain lactate by magnetic resonance spectroscopy during fulminant hepatic failure in the dog. Liver Transpl Surg 4(2):158–165
Rama Rao KV, Jayakumar AR, Norenberg MD (2012) Glutamine in the pathogenesis of acute hepatic encephalopathy. Neurochem Int 61(4):575–580
Ross BD, Jacobson S, Villamil F, Korula J, Kreis R, Ernst T, Shonk T, Moats RA (1994) Subclinical hepatic encephalopathy: pro-ton MR spectroscopic abnormalities. Radiology 193(2):457– 463
Rovira A, Alonso J, Cordoba J (2008) MR imaging findings in hepatic encephalopathy. AJNR Am J Neuroradiol 29(9):1612– 1621
Shen J, Sibson NR, Cline G, Behar KL, Rothman DL, Shulman RG (1998) 15 N-NMR spectroscopy studies of ammonia transport and
glutamine synthesis in the hyperammonemic rat brain. Dev Neu-rosci 20(4–5):434–443
Spahr L, Burkhard PR, Grotzsch H, Hadengue A (2002) Clinical significance of basal ganglia alterations at brain MRI and 1H MRS in cirrhosis and role in the pathogenesis of hepatic enceph-alopathy. Metab Brain Dis 17(4):399–413
Tkac I, Gruetter R (2005) Methodology of H NMR spectroscopy of the human brain at very high magnetic fields. Appl Magn Reson 29 (1):139–157
Tkac I, Oz G, Adriany G, Ugurbil K, Gruetter R (2009) In vivo 1H NMR spectroscopy of the human brain at high magnetic fields: metabolite quantification at 4 T vs. 7 T. Magn Reson Med 62 (4):868–879
Urenjak J, Williams SR, Gadian DG, Noble M (1993) Proton nuclear magnetic resonance spectroscopy unambiguously identifies dif-ferent neural cell types. J Neurosci 13(3):981–989
Williams S (1999) Cerebral amino acids studied by nuclear magnetic resonance spectroscopy in vivo. Prog Nucl Magn Reson Spec-trosc 34(3–4):301–326
Zwingmann C (2007) The anaplerotic flux and ammonia detoxifica-tion in hepatic encephalopathy. Metab Brain Dis 22(3–4):235– 249