eggNOG v4.0: nested orthology inference across
3686 organisms
Sean Powell
1, Kristoffer Forslund
1, Damian Szklarczyk
2, Kalliopi Trachana
3,
Alexander Roth
2, Jaime Huerta-Cepas
4,5, Toni Gabaldo´n
4,5, Thomas Rattei
6,
Chris Creevey
7, Michael Kuhn
8, Lars J. Jensen
9,*, Christian von Mering
2,* and
Peer Bork
1,10,*
1
European Molecular Biology Laboratory, Computational Biology Unit, Meyerhofstrasse 1, 69117 Heidelberg, Germany, 2University of Zurich and Swiss Institute of Bioinformatics, Institute of Molecular Life Sciences, Winterthurerstrasse 190, 8057 Zurich, Switzerland, 3Institute for Systems Biology, 401 Terry Avenue North, Seattle, WA 98109-5234, USA,4Bioinformatics and Genomics Programme, Centre for Genomic Regulation (CRG), C/Dr. Aiguader 88, 08003 Barcelona, Spain,5Universitat Pompeu Fabra (UPF), 08003 Barcelona, Spain,
6
CUBE—Division of Computational Systems Biology, Department of Microbiology and Ecosystem Science, University of Vienna, Althanstraße 14, 1090 Vienna, Austria, 7Institute of Biological, Environmental & Rural Sciences, Aberystwyth University, Penglais, Aberystwyth, Ceredigion, SY23 3FG, UK, 8Biotechnology Center, TU Dresden, 01062 Dresden, Germany,9Novo Nordisk Foundation Center for Protein Research, Faculty of Health Sciences, University of Copenhagen, 2200, Copenhagen N, Denmark and 10Max-Delbru¨ck-Centre for Molecular Medicine, Robert-Ro¨ssle-Strasse 10, 13092 Berlin, Germany
Received October 14, 2013; Revised November 8, 2013; Accepted November 11, 2013
ABSTRACT
With the increasing availability of various ‘omics data, high-quality orthology assignment is crucial for evolutionary and functional genomics studies. We here present the fourth version of the eggNOG database (available at http://eggnog.embl.de) that derives nonsupervised orthologous groups (NOGs) from complete genomes, and then applies a com-prehensive characterization and analysis pipeline to the resulting gene families. Compared with the previous version, we have more than tripled the underlying species set to cover 3686 organisms, keeping track with genome project completions while prioritizing the inclusion of high-quality genomes to minimize error propagation from in-complete proteome sets. Major technological advances include (i) a robust and scalable proced-ure for the identification and inclusion of high-quality genomes, (ii) provision of orthologous groups for 107 different taxonomic levels compared with 41 in eggNOGv3, (iii) identification and annotation of particularly closely related orthologous groups, facilitating analysis of related gene families, (iv) improvements of the clustering
and functional annotation approach, (v) adoption of a revised tree building procedure based on the multiple alignments generated during the process and (vi) implementation of quality control proced-ures throughout the entire pipeline. As in previous versions, eggNOGv4 provides multiple sequence alignments and maximum-likelihood trees, as well as broad functional annotation. Users can access the complete database of orthologous groups via a web interface, as well as through bulk download. INTRODUCTION
Orthology refers to a homologous relationship resulting from a speciation event, as opposed to paralogy, which is the result of a gene duplication event (1). However, to delineate orthologs and paralogs is a challenging task, especially for multispecies comparisons, where multiple evolutionary processes (e.g. gene loss, lineage-specific duplication, horizontal gene transfer) have shaped the modern genomes. Therefore, new terms have been introduced, such as the concept of orthologous groups (2). Owing to both the central role of orthologous genes in reconstructing species histories and in transferring func-tional information across species—the latter is based on the observation that orthologous genes seem more likely
*To whom correspondence should be addressed. Tel: +49 6221 387 85 26; Email: [email protected]
Correspondence may also be addressed to Lars J. Jensen. Tel: +45 353 25 025; Email: [email protected] Correspondence may also be addressed to Christian von Mering. Tel: +41 44 635 31 47; Email: [email protected] ß The Author(s) 2013. Published by Oxford University Press.
This is an Open Access article distributed under the terms of the Creative Commons Attribution Non-Commercial License (http://creativecommons.org/licenses/ by-nc/3.0/), which permits non-commercial use, distribution, and reproduction in any medium, provided the original work is properly cited. For commercial re-use, please contact [email protected]
to retain ancestral gene function (3)—substantial effort has gone into orthology inference and multiple tools have been developed for this purpose.
Orthology, while central to evolutionary biology and genetics, remains difficult to define where mosaic biolo-gical evolution is involved (4). Domain-level rearrange-ments between genes break up the concept of single gene histories and create gene fission or fusion products where orthology may hold only for single domains (5). Furthermore, horizontal gene transfer often hampers proper orthology assignments (6). Yet, all these issues, while technologically challenging, are in principle address-able, with measures previously implemented in eggNOG (7,8).
Recent publications using manually curated bench-marking tests or phylogentic analyses (9) suggest that a central source of errors lies in poor genome annotation and accuracy. Therefore, addressing this issue by estab-lishing quality control measurements is essential for every inference method. Hence, efforts have been made to benchmark different methods (10–15) and to evaluate paradigms for testing the accuracy of such methods under a fair comparison. These benchmarks have provided insight into the problems of genome selection and its effects on the quality and precision of orthologous group inference. Thus, it has become clear that correct and accurate genome annotation is vital to unravel the biolo-gical complexity of orthologs (9). However, other error sources can have an even greater impact on orthology in-ference, for example, incomplete genomes or those with apparent duplicate genes as a result of assembly or gene prediction artifacts. Second, an uneven sampling of species diversity risks introducing other types of artifacts either stemming from large clusters of closely related genomes, such as when multiple strains or subspecies have been sequenced to study intraspecies or generic di-versity, or from single species at the end of long evolution-ary branches, making accurate inference more difficult in many cases. Here we describe eggNOGv4, which tries to address some of these issues and highlight some of the advances over previous versions. Like previous editions of the resource, eggNOGv4 attempts to achieve compre-hensive multispecies coverage relative to different taxo-nomic levels, while at the same time providing relevant functional annotations for the resulting groups. This effort essentially extends that of the manually curated COGs/KOGs/arCOGs (2,16,17) databases, and is matched in scope by only a few other resources, most notably KEGG-OC (18).
EUKARYOTIC AND PROKARYOTIC GENOME SELECTION
With the rise of next-generation sequencing and the prompt expansion of available genomes, maintaining quality requires an escalated effort (19). Many methods for orthology analysis scale quadratically with an increasing number of genomes such that a naı¨ve expansion to include all available genomes is no longer feasible. eggNOG, and affiliated databases such as STRING (20),
tentatively have addressed this issue by dividing species space into ‘core’ species, which are central for defining orthologous groups using the strict triangular criterion, and ‘periphery’ species, which are subsequently linked into the core by bidirectional best hits. Although this dis-tinction has been applied since the conception of eggNOG to minimize computational demands, it has proven a crucial quality control step for the latest releases. Currently, the core/periphery division allows taking into account known differences between genome data sets with regard to quality (e.g. completeness, coverage, annotation quality) so that more accredited genomes form the core set, whereas more recently sequenced, less validated genomes still become available for detailed orthology analysis through their inclusion in the periphery (21).
In the update, eggNOGv4 takes this approach one step further by introducing an easily expandable level outside the periphery, the set of ‘adherent’ species. After defining the orthologous groups with the core/periphery organisms as has been described by Jensen et al. (8), we complete the mapping of the adherent species proteomes using looser criteria (see below). Through this tripartite approach, the present version of eggNOG is able to retain previously high levels of reliability in the construction of groups, while at the same time keeping track of new genomes becoming available, particularly for bacteria, where more and more clades are sampled deeply (22).
Owing to the availability of a more limited number of high-quality eukaryotic genomes, the inclusion of most publicly provided genomes is imperative. For these genomes the decision between core and peripheral species remains critical to ensure that only high-quality genomes are included as core genomes. For eggNOGv4, selection of these genomes was carried out by first down-loading the latest genomes from major sources, which included Ensembl (23), UniProt (24), GiardiaDB (25), JGI (http://genome.jgi-psf.org) and TAIR (26), as in the previous version of eggNOG. Then, genome selection, as well as core versus periphery assignment, was based on 40 phylogenetic marker genes (27–30) to ensure quality genomes were selected with a high level of sequencing coverage and genomic completeness. The use of such metrics as a guide for excluding genomes likely to cause errors in orthology construction, then, is the first step of quality assurance introduced into the pipeline in this update. As species selection with sufficient evolutionary coverage improves orthology prediction (11), a broad taxonomic sampling of the eukaryotic clade was ensured. However, representative model system species as well as genomes featured in previous versions of eggNOG were additionally included so as to maintain backwards compatibility, support ‘legacy’ applications and maintain utility relied on by the model organism com-munity (31–33). In total, as many as, 238 eukaryotic species were selected, almost a 2-fold increase over eggNOGv3.
The prokaryotic genomes were selected (29) from the RefSeq (34) repository. The repository of >3496 prokary-otic genomes has been used for several large-scale pro-karyotic genome and metagenome analyses (35), and is intended to accommodate new prokaryotic genomes as
their annotations mature. Similarly to the eukaryotic genome selection, the prokaryotic genome selection evalu-ates coverage of genomes by using the set of 40 phylogen-etic marker genes as a proxy, ensuring potentially incomplete genomes are excluded (28,29,36). Genomes were clustered based on 96.5% average sequence identity of these marker genes (this cutoff was chosen to maximize consistency with previously defined species from the litera-ture), forming clusters of closely related genomes (29). For each such species cluster, at least one representative genome was chosen, based on assembly quality (N50), utility as model organism or other considerations. All other genomes were included in the mapped data set, referred to here as the adherent genomes. In total, eggNOGv4 has 2031 base genomes (i.e. core and periph-ery) as well as an additional 1655 adherent genomes, for a total of 3686 eukaryotic and prokaryotic organisms.
ORTHOLOGOUS GROUPS CONSTRUCTION AND MAPPING OF ADHERENT GENOMES
The initial step in the eggNOG pipeline is the clustering of the 9.6 million proteins from the 2031 core and periphery genomes. As in eggNOGv3, all homology comparisons were executed by the SIMAP initiative (37). It uses the FASTA algorithm (38), which is more sensitive than BLAST (39,40), used in earlier versions. For version 4 of eggNOG an additional quality step of low complexity fil-tering (41) has been added. Low complexity regions within protein sequences could distort homology searches between such proteins, causing false positive homology assignments (42). While a vast majority of the homology assignments will not be affected by such low complexity region filtering, this step is nevertheless useful for ensuring high-quality orthologous groups, in particular because false-positive hits can link distant protein families and thereby have effects beyond the protein pair involved. The alignments and scores between all homologous protein pairs are, therefore, recalculated using low-com-plexity masking and with compositional adjustment of the amino acid substitution matrix (43) to account for com-positional biases and low-complexity regions. This is yet another way in which the revised pipeline seeks to counter risks with increased species coverage through improved quality controls.
In addition to the 2031 genomes that were clustered by the orthology pipeline, 1655 lower quality adherent genomes were mapped to the orthologous groups of the base genomes. Of the >5 million proteins within the 1655 genomes, 4.1 million proteins (78%) were mapped to at least one orthologous group. These genomes were not part of the initial clustering step owing to concerns of the affects of low-quality genomes on orthology inference (11). However, the annotational information now provided for those low-quality genomes can be a valuable asset for microbiological and metagenomic studies.
The clustering and adherent mapping after the homology searches of almost 15 million proteins in 3686 organisms resulted in >11 million proteins (75%) being
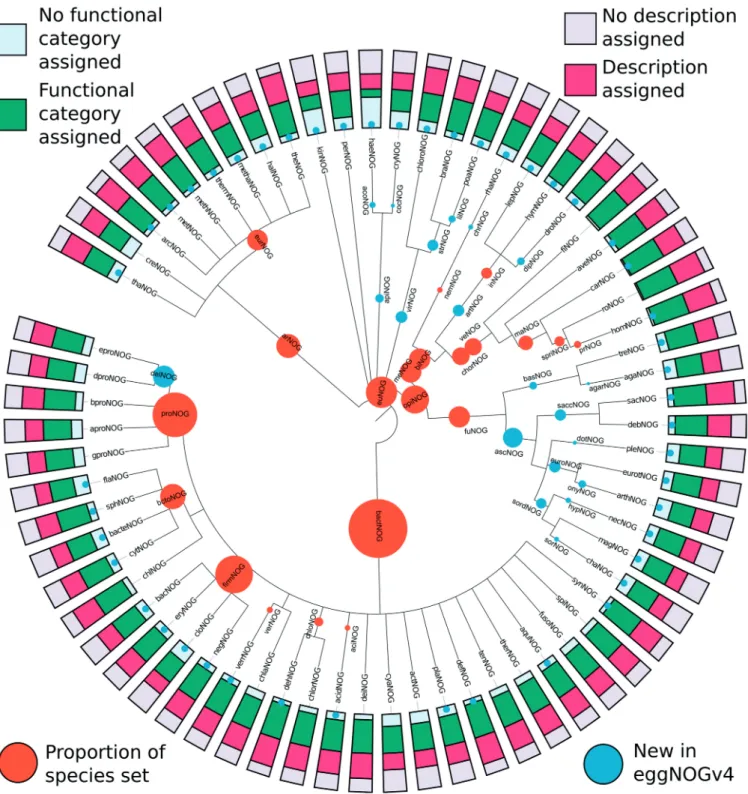
associated with at least one orthologous groups at one or more taxonomic levels. At the eukaryotic level, the original 4850 KOGs (16) were extended by an additional 55 314 euNOGs, bringing the total of orthologous groups in the eukaryotic clade to 60 164 clusters. This was likewise done for the 7538 arCOGs (44), extending them by 3085 arNOGs. In total, 107 levels of various taxonomic ranks of orthologous groups (Figure 1) were calculated to provide a variety of distinctive orthology assignments with alternative last common ancestors (LCA) providing successively higher resolution of orthologous groups. This includes 38 bacterial-specific levels, which have been expanded to include orthologous assignments at the taxo-nomic rank of class, for example, 174 organisms within the Clostridia clade (cloNOG) and 9 Cytophagia (cytNOG), a class within the Bacteroidetes phylum. The 57 eukaryotic specific levels include all taxonomic ranks between the superkingdom and family ranks, which, in the current version, include 23 green plants, i.e Viridiplantae (virNOG) and three birds, i.e. Aves (aveNOG).
AUTOMATIC ANNOTATION
To provide functional characterization for the inferred orthologous groups, eggNOG uses two parallel approaches, though both fundamentally similar, summarizing known attributes of the group members and then determining which annotations can be robustly propagated to the group as a whole. Functional descrip-tions are provided based on a heuristic procedure, seeking the most informative description that characterizes the annotated members of the group. This assignment builds primarily on associated free text descriptions from publicly available databases, but in the absence of infer-ences from this source will use Gene Ontology assign-ments or build descriptions based on protein domains characteristic of each group. These unstructured text descriptions provide an initial overview on inspection of what the known annotations for members of an orthologous group generally have in common. It should, however, be borne in mind that such summaries cannot fix errors in the underlying annotations, if such errors have been sufficiently propagated through annotation transfer of homologous proteins. Furthermore, the functional categories introduced in COG (2), KOG (16) and arCOG (44) are employed. This is a controlled vocabulary of 20 functional categories to which the orthologous groups of those databases are assigned, and similarly, nonsupervised orthologous groups (NOGs) are assigned to these categories using support vector machine classifi-cation applying available annotation [i.e. free text data, KEGG (45) pathway or module membership, SMART (46) or Pfam (47) domain content and Gene Ontology (48) annotations] as a feature space, with parameter settings optimized under cross-validation of the training set. Based on inspection of the annotations provided in eggNOG v3, filter settings, cutoffs and other parameters for these pipelines were further improved, providing additional quality filtering for eggNOG v4. As a result, 74% of the OGs are provided with nontrivial free text
descriptions, whereas 54% of the OGs are assigned to in-formative functional categories. For levels present in the previous version, text description coverage is on average 78%, as opposed to 72% in eggNOGv3, whereas func-tional category coverage is 56%, as opposed to 61% in eggNOGv3. Supplementary Table S1 shows more detailed statistics of these assignments.
INPARALOG RECOGNITION
As in former versions, eggNOG places closely related species into clades to identify recently duplicated genes, i.e. inparalogs (49), within the context of each clade. To form inparalogous groups, highly related genomes are grouped into clades, usually encompassing all sequenced
Figure 1. Taxonomic levels for which orthologous groups are provided, with functional annotation coverage displayed. This tree shows the levels of the Tree of Life for which eggNOG v4 provides orthologous groups. For internal nodes, the size of the orange circle increases with the number of species in the core/periphery set, which falls under this taxonomic level, respectively. Blue dot markers or circles denote the 67 of 107 taxonomic levels that are new to eggNOG v4 over eggNOG v3. The bar charts displayed at the edge show what fraction of orthologous groups have meaningful free-text descriptions or COG/KOG/arCOG functional categories assigned, respectively.
strains of a particular species into a single clade, but also other close pairs such as human and chimpanzee. Within these clades we join into inparalogous groups all proteins that are more similar to each other (within the clade), than to any other protein outside the clade. Determining which organisms should be grouped into clades in this regard is nontrivial and in previous versions was carried out manually. In eggNOGv4, these clades are automatically defined based on a curated set of marker genes previously reported to occur nearly universally in single copy (28,36); such marker genes have been shown to be highly applic-able for the purpose of high-resolution phylogenetic analysis (27). Members of these gene families were identified using Hidden Markov Models (50–52) built for each family. For each pair of genomes, a similarity metric between them was defined, based on the average sequence identity of the marker genes. For each of the 107 taxonomic levels at which eggNOGv4 provides orthologous groups, clades of species were delineated on the criterion that they should be the deepest sub-dendro-grams of the NCBI species taxonomy (53,54). In addition, all pairs of included species must exceed a level-specific threshold based on this marker gene-based species similar-ity metric. This threshold was chosen for each taxonomic level represented in eggNOGv4 from the range of 70–99% on the criterion of maximal consistency with the manually curated clade assignments for the equivalent level in eggNOGv3, when considering only overlapping species. In order to set a suitable level-specific sequence identity threshold for the new taxonomic levels in eggNOGv4, the closest clade definition from previous eggNOG releases, based on the topology of the NCBI taxonomy tree, was used as a reference. Following the initial benchmark analysis (described below), the results of the analysis were used to guide some small-scale final adjustment of the clade assignments for a small number of species. Full details on these thresholds as well as agreement of the resulting clades (and thereby of inparalog recognition settings) with eggNOGv3 are found in Supplementary Table S3.
BENCHMARK RESULTS
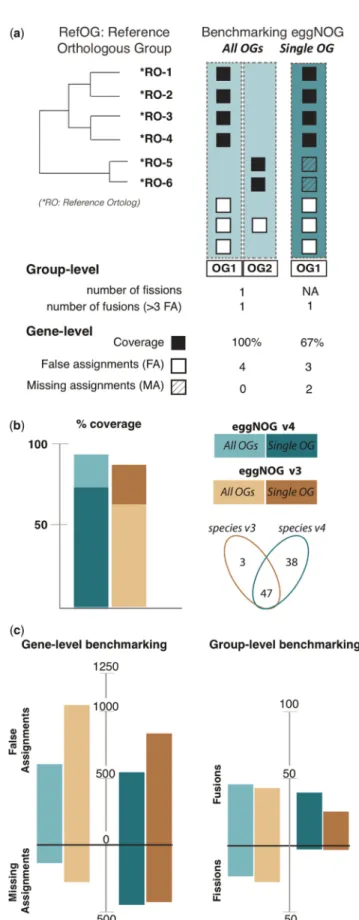
Validating the accuracy of the automatic orthology infer-ence of eggNOGv4 is challenging owing to the enormous amount of species. However, to verify that introducing such a large number of new species and several changes in the pipeline does not affect the accuracy of our database, we compared the predicted orthologous groups of bilaterian animals (biNOGs) to a manually curated set of reference orthologous groups (RefOGs) (11). This benchmarking set exemplifies several caveats of orthology prediction, such as alignment quality, domain shuffling or the presence of low complexity sequence regions. We used the 70 manually curated RefOGs spanning 12 animal species (1519 proteins in total) to quantify the errors in eggNOGv4 and eggNOG v3 (Figure 2A). Despite the 2-fold increase in the animal species set, eggNOGv4 detects larger number of reference orthologs compared with the previous version (Figure 2B).
Tracing the missing and false orthology assignments, we observed that eggNOG v4 has been improved signifi-cantly, scoring 30% fewer errors compared with corres-ponding groups in eggNOG v3 (Figure 2C). Finally, we counted the number of fusion (i.e. orthologous groups with more than three false assignments, with three as the cutoff because it is the smallest possible COG size) and fission (i.e. a single RefOG splits into several orthologous groups) events. We concluded that the new version defines orthologous groups more accurately than eggNOGv3 based on two observations: (i) there are 27 and 16 pre-dicted orthologous groups that show no fissions or fusions, respectively (Supplementary Table S1) and (ii) there are only half the fusion events in eggNOGv4 compared with eggNOGv3 (Figure 2D). Although the benchmarking test evaluates a small number of species and families, we presume that similar phylogeny-based data sets for other taxonomic levels will support our findings. By using the animal clade as an example, we supposed that this important improvement of perform-ance has probably multiple contributors: (i) our new policy for an extensive quality control of the core/periph-ery genomes, (ii) the tripartite species classification scheme (core, periphery, adherent) and new clade definition and (iii) the new species repertoire (important phylogenetic nodes as insects and nonmammalian vertebrates now have better species coverage enhancing the phylogenetic signal). Given that all these components have been applied carefully to every taxonomical level, we consider that eggNOGv4 exemplifies how orthology inference can be scaled up to cover a large species repertoire without great sacrifices in quality, to enable applications such as functional annotation of (meta-) genomic data sets and other research questions.
SINGLE-COPY ORTHOLOGS IN EUKARYOTES For many applications, it is important to be able to describe the relationships in gene families from multiple organisms and to classify them into groups according to their homologous relationships (55). In particular, the correct identification of orthologs from paralogs within a orthologous group is critical for many applications (56), such as quantification of species from short-read metagenomic sequencing of microbial communities, for genome-scale phylogenetic reconstructions (28,57) and as-sessments of completeness of sequenced genomes (58). Certain orthology resources are, as a result, specialized in identifying and reconstructing such families of copy orthologs (59,60). Methods for identifying single-copy orthologous gene families are generally based on a combination of reciprocal best sequence alignments between pairs of sequenced genomes and counting the number of representatives of each species in the family in question (8,12). However, this does not take the phylo-genetic signal of the gene family into account, which may present evidence for hidden paralogy such as gene dupli-cations and subsequent losses. Also, orthologs defined at a given taxonomic level may miss gene families that consist of single-copy orthologs at more fine-grained taxonomic
levels (60), resulting in the exclusion of a potentially large proportion of phylogenetically useful genes. In an attempt to address these inadequacies, we previously developed a phylogenetic approach to identifying single-copy orthologs from large multigene families, and demonstrated its application in identifying phylogenetic-ally useful single-gene orthologs across the Metazoa (60). This approach simultaneously identifies at every taxo-nomic level (as defined by a provided guide tree) all single-gene orthologs, through the application of a gene-tree reconciliation method. This approach has the advan-tage of identifying single-copy orthologs with consider-ation for their phylogenetic history, and providing single-copy ortholog definitions specifically for whatever taxonomic level is required. Moreover, the single-copy orthologs defined using this approach are nested (orthologs at lower taxonomic levels are naturally con-tained within higher-level orthologous groups), something which is difficult to achieve reliably when orthologs are defined separately without consideration for their interre-lationships. Sets of single-copy orthologs for all taxo-nomic levels in eukaryotic sub-clades are now provided as part of eggNOGv4, thereby enabling a novel set of applications over previous versions, such as identification of clade-specific marker genes.
ROBUST PHYLOGENIES OF ORTHOLOG GROUPS Phylogenetic trees were reconstructed using the phylomeDB pipeline described in (61). In brief, for clusters containing up to 500 orthologs, sequences were aligned using Mafft (62) and Muscle (63) in forward and reverse direction, producing four equivalent alignments. M-Coffee (64) was used to generate a consensus version of the four alignments. Trimal v1.3 (65) was used to remove inconsistent columns from the consensus align-ment by keeping only columns compatible with at least one of the original alignments and containing <95% gaps. Evolutionary model selection was performed based on the estimated likelihood of Neighbor-Joining trees produced by Phyml-BioNJ (61) under five different models (JTT, WAG, MtREV, LG and VT). The best
Figure 2. Benchmarking and comparing eggNOGv4 and eggNOGv3. (A) The performance of eggNOG database was evaluated at two levels: gene (identifying false and missing assignments) and group (iden-tifying fusions and fissions) level using the Reference Orthologous Groups (RefOGs). Initially, we mapped the reference orthologs to the bilaterian-specific orthologous groups (biNOGs). We score eggNOG performance using (i) all orthologous groups (‘All OGs’) to identify
Figure 2. Continued
the number of fissions and fusions for every RefOG and (ii) the orthologous group with the larger overlap with RefOG (‘Single OG’, i.e. OG1). Then, we calculated how many genes were predicted accur-ately (true assignments, TA, black box), how many genes were not predicted as orthologs (missing assignments, MA, striped white box) and how many genes were erroneous orthology predictions (false as-signments, FA, white box). Depending on whether the user wants to evaluate the database on a ‘Single OG’ or ‘All OGs’ manner, it will change the numbers of true, missing and false assignments. (B) Comparison of the two most recent eggNOG versions (v3 and v4) in terms of %RefOG coverage (number of true assignments per total number of reference orthologs). Venn diagram shows the species number between the two database releases; there are 47 overlapping species that included the 12 animals that are used in the benchmarking data set. (C) Comparison of eggNOGv3 and eggNOGv4 at the gene level (false and missing assignments). The larger bars indicate a larger number of errors. (D) Comparison of eggNOGv3 and eggNOGv4 at the group level (fusion and fission events). The larger bars indicate a larger number of errors.
fitting model was chosen for maximum likelihood recon-struction using Phyml 3, four rate categories and estimated gamma distribution shape parameter. Note that, for computational reasons, the evolutionary model selection step was not applied to clusters >500 orthologs. In addition, we switched to Clustal Omega (66) for align-ments in clusters >1000 sequences. The multiple sequence alignments can be either viewed using the Jalview (67) applet or downloaded aligned or as raw unaligned fasta files. Visualization of the precomputed phylogenetic trees is also provided via iTOL (68) and can be viewed with the assigned PFAM (47) and SMART (46) domains.
ACCESS OPTIONS
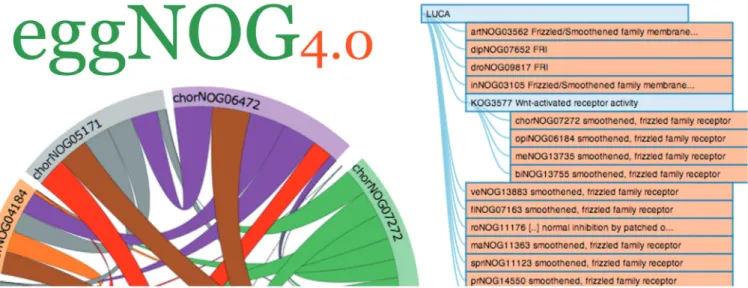
The features of the previous version of eggNOG, both with regard to interactive Web site and bulk download capacities, were retained in version 4 (Figure 3). These include a web interface for querying the eggNOG orthologous groups via group name, protein and gene name, as well as via protein sequence. In addition to this, all data are available via the Download page in a flat file format as well as in the standard OrthoXML format (69). This includes all protein sequences and orthologous groups of all taxonomic ranks, most multiple sequence alignments and phylogenetic trees as well as the functional annotation of 74% of the orthologous groups. All data are available under the Creative Commons Attribution 3.0 License at http://eggnog.embl.de.
CONCLUSION AND PERSPECTIVES
Providing quality orthologous groups is an arduous but necessary task essential for gene annotation and evolu-tionary analysis. With eggNOGv4 we provide an update to one of the most extensive resources of orthologous groups, now available with 2031 genomes, as well as an
additional 1655 adherent genomes. Building on previous versions we have continued to expand the taxonomic spectrum, especially in the prokaryotic branch where we can expect coverage of novel or underpopulated phyla of unculturable bacteria to surge within the coming years (70). We also had an increase in the manually identified taxonomic ranges of interest. One hundred seven different taxonomic levels with orthologous groups are available, representing families derived from single genes in the LCA of each of the taxonomic groups. Providing additional insight into the relationship between orthologous groups and the addition of marker genes for phylogenetic analyses, we have extended the functionality of eggNOG to assist novel types of biological assessment (for example, in screens for horizontal evolution or for characterization of microbiome composition from short reads). In the future we endeavor to continue to refine and improve the quality of the eggNOG orthologous groups and func-tional annotation introducing complementary features to appeal to a broader community, while retaining the current capacities, namely comprehensive coverage of species, functional characterization of orthologous groups and robust reliable orthology inference.
SUPPLEMENTARY DATA
Supplementary Data are available at NAR Online.
ACKNOWLEDGEMENTS
The authors wish to thank all members of the Bork group for the fruitful discussions, especially S. Sunagawa and D. Mende for their support. S.P., P.B., C.vM., L.J.J. and M.K. designed the study. C.vM., S.P., D.S. and A.R. generated the orthologous groups. K.F. and D.S. determined clades and performed the functional annota-tion. J.H. and T.G. created the alignments and
Figure 3. Web site screenshots. The navigation tool has been improved to help users find relevant orthologous groups in a simple and intuitive way. The added insight of related groups is displayed inline with the use of chord diagrams. The thickness of the link (chord) between the groups represents the amount of proteins mapped between two orthologous group. The tooltips on the outer edge and chords display the amount of proteins mapped from a group and between groups, respectively.
phylogenetic trees. K.T. ran the benchmark analysis. T.R. provided the homology data. C.C. generated the single-copy orthologs. S.P. designed the web page. S.P., K.F., K.T. and C.C. wrote the draft manuscript, which was reviewed and edited by all authors.
FUNDING
ERC [UMICIS/242870]; Spanish Juan de la Cierva post-doctoral program [JCI2010-07614]; Jose Castillejo mobility program [CAS12/00357]; Alexander von Humboldt Foundation; Novo Nordisk Foundation Center for Protein Research. Funding for access open access charge: EMBL internal budget.
Conflict of interest statement. None declared. REFERENCES
1. Fitch,W.M. (1970) Distinguishing homologous from analogous proteins. Syst. Zool., 19, 99–113.
2. Tatusov,R.L., Koonin,E.V. and Lipman,D.J. (1997) A genomic perspective on protein families. Science, 278, 631–637. 3. Gabaldo´n,T. and Koonin,E.V. (2013) Functional and
evolutionary implications of gene orthology. Nat. Rev. Genet., 14, 360–366.
4. Koonin,E.V., Aravind,L. and Kondrashov,A.S. (2000) The impact of comparative genomics on our understanding of evolution. Cell, 101, 573–576.
5. Tordai,H., Nagy,A., Farkas,K., Ba´nyai,L. and Patthy,L. (2005) Modules, multidomain proteins and organismic complexity. FEBS J., 272, 5064–5078.
6. Dalquen,D.A., Altenhoff,A.M., Gonnet,G.H. and Dessimoz,C. (2013) The impact of gene duplication, insertion, deletion, lateral gene transfer and sequencing error on orthology inference: a simulation study. PloS One, 8, e56925.
7. Muller,J., Szklarczyk,D., Julien,P., Letunic,I., Roth,A., Kuhn,M., Powell,S., von Mering,C., Doerks,T., Jensen,L.J. et al. (2010) eggNOG v2.0: extending the evolutionary genealogy of genes with enhanced non-supervised orthologous groups, species and functional annotations. Nucleic Acids Res., 38, D190–D195. 8. Jensen,L.J., Julien,P., Kuhn,M., von Mering,C., Muller,J.,
Doerks,T. and Bork,P. (2008) eggNOG: automated construction and annotation of orthologous groups of genes. Nucleic Acids Res., 36, D250–D254.
9. Milinkovitch,M.C., Helaers,R., Depiereux,E., Tzika,A.C. and Gabaldo´n,T. (2010) 2x genomes—depth does matter. Genome Biol., 11, R16.
10. Boeckmann,B., Robinson-Rechavi,M., Xenarios,I. and Dessimoz,C. (2011) Conceptual framework and pilot study to benchmark phylogenomic databases based on reference gene trees. Brief. Bioinform., 12, 423–435.
11. Trachana,K., Larsson,T.A., Powell,S., Chen,W.-H., Doerks,T., Muller,J. and Bork,P. (2011) Orthology prediction methods: a quality assessment using curated protein families. BioEssays, 33, 769–780.
12. Hulsen,T., Huynen,M.A., de Vlieg,J. and Groenen,P.M.A. (2006) Benchmarking ortholog identification methods using functional genomics data. Genome Biol., 7, R31.
13. Chen,F., Mackey,A.J., Vermunt,J.K. and Roos,D.S. (2007) Assessing performance of orthology detection strategies applied to eukaryotic genomes. PloS One, 2, e383.
14. Altenhoff,A.M. and Dessimoz,C. (2009) Phylogenetic and functional assessment of orthologs inference projects and methods. PLoS Comput. Biol., 5, e1000262.
15. Salichos,L. and Rokas,A. (2011) Evaluating ortholog prediction algorithms in a yeast model clade. PLoS One, 6, e18755. 16. Tatusov,R.L., Fedorova,N.D., Jackson,J.D., Jacobs,A.R., Kiryutin,B., Koonin,E.V., Krylov,D.M., Mazumder,R., Mekhedov,S.L., Nikolskaya,A.N. et al. (2003) The COG
database: an updated version includes eukaryotes. BMC Bioinform., 4, 41.
17. Makarova,K.S., Sorokin,A.V., Novichkov,P.S., Wolf,Y.I. and Koonin,E.V. (2007) Clusters of orthologous genes for 41 archaeal genomes and implications for evolutionary genomics of archaea. Biol. Direct, 2, 33.
18. Nakaya,A., Katayama,T., Itoh,M., Hiranuka,K., Kawashima,S., Moriya,Y., Okuda,S., Tanaka,M., Tokimatsu,T., Yamanishi,Y. et al. (2013) KEGG OC: a large-scale automatic construction of taxonomy-based ortholog clusters. Nucleic Acids Res., 41, D353–D357.
19. Alkan,C., Sajjadian,S. and Eichler,E.E. (2011) Limitations of next-generation genome sequence assembly. Nat. Methods, 8, 61–65. 20. Szklarczyk,D., Franceschini,A., Kuhn,M., Simonovic,M., Roth,A.,
Minguez,P., Doerks,T., Stark,M., Muller,J., Bork,P. et al. (2011) The STRING database in 2011: functional interaction networks of proteins, globally integrated and scored. Nucleic Acids Res., 39, D561–D568.
21. Powell,S., Szklarczyk,D., Trachana,K., Roth,A., Kuhn,M., Muller,J., Arnold,R., Rattei,T., Letunic,I., Doerks,T. et al. (2012) eggNOG v3.0: orthologous groups covering 1133 organisms at 41 different taxonomic ranges. Nucleic Acids Res., 40, D284–D289. 22. Pruitt,K.D., Tatusova,T. and Maglott,D.R. (2007) NCBI
reference sequences (RefSeq): a curated non-redundant sequence database of genomes, transcripts and proteins. Nucleic Acids Res., 35, D61–D65.
23. Flicek,P., Amode,M.R., Barrell,D., Beal,K., Brent,S., Carvalho-Silva,D., Clapham,P., Coates,G., Fairley,S.,
Fitzgerald,S. et al. (2012) Ensembl 2012. Nucleic Acids Res., 40, D84–D90.
24. UniProt Consortium. (2013) Update on activities at the Universal Protein Resource (UniProt) in 2013. Nucleic Acids Res., 41, D43–D47.
25. Aurrecoechea,C., Brestelli,J., Brunk,B.P., Carlton,J.M., Dommer,J., Fischer,S., Gajria,B., Gao,X., Gingle,A., Grant,G. et al. (2009) GiardiaDB and TrichDB: integrated genomic resources for the eukaryotic protist pathogens Giardia lamblia and Trichomonas vaginalis. Nucleic Acids Res., 37, D526–D530.
26. Lamesch,P., Berardini,T.Z., Li,D., Swarbreck,D., Wilks,C., Sasidharan,R., Muller,R., Dreher,K., Alexander,D.L.,
Garcia-Hernandez,M. et al. (2012) The Arabidopsis Information Resource (TAIR): improved gene annotation and new tools. Nucleic Acids Res., 40, D1202–D1210.
27. Stark,M., Berger,S.A., Stamatakis,A. and von Mering,C. (2010) MLTreeMap—accurate Maximum Likelihood placement of environmental DNA sequences into taxonomic and functional reference phylogenies. BMC Genomics, 11, 461.
28. Ciccarelli,F.D., Doerks,T., von Mering,C., Creevey,C.J., Snel,B. and Bork,P. (2006) Toward automatic reconstruction of a highly resolved tree of life. Science, 311, 1283–1287.
29. Mende,D.R., Sunagawa,S., Zeller,G. and Bork,P. (2013) Accurate and universal delineation of prokaryotic species. Nat. Methods, 10, 881–884.
30. Sunagawa,S., Mende,D.R., Zeller,G., Izquierdo-Carrasco,F., Berger,S.A., Kultima,J.R., Coelho,L.P., Arumugam,M., Tap,J., Nielsen,H.B. et al. (2013) Metagenomic species profiling using universal phylogenetic marker genes. Nat. methods, 10, 1196–1199.
31. Duarte,J.M., Wall,P.K., Edger,P.P., Landherr,L.L., Ma,H., Pires,J.C., Leebens-Mack,J. and dePamphilis,C.W. (2010) Identification of shared single copy nuclear genes in Arabidopsis, Populus, Vitis and Oryza and their phylogenetic utility across various taxonomic levels. BMC Evol. Biol., 10, 61.
32. Lee,Y.S., Oh,J., Kim,Y.U., Kim,N., Yang,S. and Hwang,U.W. (2008) Mitome: dynamic and interactive database for comparative mitochondrial genomics in metazoan animals. Nucleic Acids Res., 36, D938–D942.
33. Van Bel,M., Proost,S., Wischnitzki,E., Movahedi,S., Scheerlinck,C., Van de Peer,Y. and Vandepoele,K. (2012) Dissecting plant genomes with the PLAZA comparative genomics platform. Plant Physiol., 158, 590–600.
34. Pruitt,K.D., Tatusova,T., Brown,G.R. and Maglott,D.R. (2012) NCBI Reference Sequences (RefSeq): current status, new features
and genome annotation policy. Nucleic Acids Res., 40, D130–D135.
35. Schloissnig,S., Arumugam,M., Sunagawa,S., Mitreva,M., Tap,J., Zhu,A., Waller,A., Mende,D.R., Kultima,J.R., Martin,J. et al. (2013) Genomic variation landscape of the human gut microbiome. Nature, 493, 45–50.
36. Sorek,R., Zhu,Y., Creevey,C.J., Francino,M.P., Bork,P. and Rubin,E.M. (2007) Genome-wide experimental determination of barriers to horizontal gene transfer. Science, 318, 1449–1452. 37. Rattei,T., Tischler,P., Go¨tz,S., Jehl,M.A., Hoser,J., Arnold,R.,
Conesa,A. and Mewes,H.W. (2010) SIMAP–a comprehensive database of pre-calculated protein sequence similarities, domains, annotations and clusters. Nucleic Acids Res., 38, D223–D226.
38. Pearson,W.R. (1990) Rapid and sensitive sequence comparison with FASTP and FASTA. Methods Enzymol., 183, 63–98.
39. Altschul,S.F., Gish,W., Miller,W., Myers,E.W. and Lipman,D.J. (1990) Basic local alignment search tool. J. Mol. Biol., 215, 403–410.
40. Shpaer,E.G., Robinson,M., Yee,D., Candlin,J.D., Mines,R. and Hunkapiller,T. (1996) Sensitivity and selectivity in protein similarity searches: a comparison of Smith-Waterman in hardware to BLAST and FASTA. Genomics, 38, 179–191.
41. Wootton,J.C. and Federhen,S. (1996) Analysis of compositionally biased regions in sequence databases. Methods Enzymol., 266, 554–571.
42. Forslund,K. and Sonnhammer,E.L.L. (2009) Benchmarking homology detection procedures with low complexity filters. Bioinformatics, 25, 2500–2505.
43. Altschul,S.F., Wootton,J.C., Gertz,E.M., Agarwala,R.,
Morgulis,A., Scha¨ffer,A.A. and Yu,Y.K. (2005) Protein database searches using compositionally adjusted substitution matrices. FEBS J., 272, 5101–5109.
44. Wolf,Y.I., Makarova,K.S., Yutin,N. and Koonin,E.V. (2012) Updated clusters of orthologous genes for Archaea: a complex ancestor of the Archaea and the byways of horizontal gene transfer. Biol. Direct, 7, 46.
45. Tanabe,M. and Kanehisa,M. (2012) Using the KEGG database resource. Curr. Protoc. Bioinformatics, Chapter 1, Unit1.12. 46. Letunic,I., Doerks,T. and Bork,P. (2012) SMART 7: recent
updates to the protein domain annotation resource. Nucleic Acids Res., 40, D302–D305.
47. Punta,M., Coggill,P.C., Eberhardt,R.Y., Mistry,J., Tate,J., Boursnell,C., Pang,N., Forslund,K., Ceric,G., Clements,J. et al. (2012) The Pfam protein families database. Nucleic Acids Res., 40, D290–D301.
48. Ashburner,M., Ball,C.A., Blake,J.A., Botstein,D., Butler,H., Cherry,J.M., Davis,A.P., Dolinski,K., Dwight,S.S., Eppig,J.T. et al. (2000) Gene ontology: tool for the unification of biology. The Gene Ontology Consortium. Nat. Genet., 25, 25–9. 49. Koonin,E.V. (2005) Orthologs, paralogs, and evolutionary
genomics. Annu. Rev. Genet., 39, 309–338.
50. Eddy,S.R., Mitchison,G. and Durbin,R. (1995) Maximum discrimination hidden Markov models of sequence consensus. J. Comput. Biol., 2, 9–23.
51. Eddy,S.R. (2009) A new generation of homology search tools based on probabilistic inference. Genome Inform., 23, 205–211. 52. Eddy,S.R. (2011) Accelerated Profile HMM Searches. PLoS
Comput. Biol., 7, e1002195.
53. Benson,D.A., Karsch-Mizrachi,I., Lipman,D.J., Ostell,J. and Sayers,E.W. (2009) GenBank. Nucleic Acids Res., 37, D26–D31.
54. Sayers,E.W., Barrett,T., Benson,D.A., Bryant,S.H., Canese,K., Chetvernin,V., Church,D.M., DiCuccio,M., Edgar,R., Federhen,S. et al. (2009) Database resources of the National Center for Biotechnology Information. Nucleic Acids Res., 37, D5–D15. 55. Gogarten,J.P. and Olendzenski,L. (1999) Orthologs, paralogs and
genome comparisons. Curr. Opin. Dev., 9, 630–636.
56. Delsuc,F., Brinkmann,H. and Philippe,H. (2005) Phylogenomics and the reconstruction of the tree of life. Nat. Rev. Genet., 6, 361–375.
57. Creevey,C.J., Fitzpatrick,D.A., Philip,G.K., Kinsella,R.J., O’Connell,M.J., Pentony,M.M., Travers,S.A., Wilkinson,M. and McInerney,J.O. (2004) Does a tree-like phylogeny only exist at the tips in the prokaryotes? Proc. Biol. Sci., 271, 2551–2558.
58. Parra,G., Bradnam,K. and Korf,I. (2007) CEGMA: a pipeline to accurately annotate core genes in eukaryotic genomes.
Bioinformatics, 23, 1061–1067.
59. Altenhoff,A.M., Schneider,A., Gonnet,G.H. and Dessimoz,C. (2011) OMA 2011: orthology inference among 1000 complete genomes. Nucleic Acids Res., 39, D289–D294.
60. Creevey,C.J., Muller,J., Doerks,T., Thompson,J.D., Arendt,D. and Bork,P. (2011) Identifying single copy orthologs in Metazoa. PLoS Comput. Biol., 7, e1002269.
61. Huerta-Cepas,J., Capella-Gutierrez,S., Pryszcz,L.P., Denisov,I., Kormes,D., Marcet-Houben,M. and Gabaldo´n,T. (2011) PhylomeDB v3.0: an expanding repository of genome-wide collections of trees, alignments and phylogeny-based orthology and paralogy predictions. Nucleic Acids Res., 39, D556–D560.
62. Katoh,K. and Standley,D.M. (2013) MAFFT multiple sequence alignment software version 7: improvements in performance and usability. Mol. Biol. Evol., 30, 772–780.
63. Edgar,R.C. (2004) MUSCLE: a multiple sequence alignment method with reduced time and space complexity. BMC Bioinformatics, 5, 113.
64. Wallace,I.M., O’Sullivan,O., Higgins,D.G. and Notredame,C. (2006) M-Coffee: combining multiple sequence alignment methods with T-Coffee. Nucleic Acids Res., 34, 1692–1699.
65. Capella-Gutie´rrez,S., Silla-Martı´nez,J.M. and Gabaldo´n,T. (2009) trimAl: a tool for automated alignment trimming in large-scale phylogenetic analyses. Bioinformatics, 25, 1972–1973.
66. Sievers,F., Wilm,A., Dineen,D., Gibson,T.J., Karplus,K., Li,W., Lopez,R., McWilliam,H., Remmert,M., So¨ding,J. et al. (2011) Fast, scalable generation of high-quality protein multiple sequence alignments using Clustal Omega. Mol. Syst. Biol., 7, 539.
67. Waterhouse,A.M., Procter,J.B., Martin,D.M.A., Clamp,M. and Barton,G.J. (2009) Jalview Version 2–a multiple sequence alignment editor and analysis workbench. Bioinformatics, 25, 1189–1191.
68. Letunic,I. and Bork,P. (2011) Interactive Tree Of Life v2: online annotation and display of phylogenetic trees made easy. Nucleic Acids Res., 39, W475–W478.
69. Schmitt,T., Messina,D.N., Schreiber,F. and Sonnhammer,E.L.L. (2011) Letter to the editor: SeqXML and OrthoXML: standards for sequence and orthology information. Brief. Bioinform., 12, 485–488.
70. Sizova,M.V., Hohmann,T., Hazen,A., Paster,B.J., Halem,S.R., Murphy,C.M., Panikov,N.S. and Epstein,S.S. (2012) New approaches for isolation of previously uncultivated oral bacteria. Appl. Environ. Microbiol., 78, 194–203.