HAL Id: hal-00304648
https://hal.archives-ouvertes.fr/hal-00304648
Submitted on 1 Jan 2002HAL is a multi-disciplinary open access archive for the deposit and dissemination of sci-entific research documents, whether they are pub-lished or not. The documents may come from teaching and research institutions in France or abroad, or from public or private research centers.
L’archive ouverte pluridisciplinaire HAL, est destinée au dépôt et à la diffusion de documents scientifiques de niveau recherche, publiés ou non, émanant des établissements d’enseignement et de recherche français ou étrangers, des laboratoires publics ou privés.
site in south-east England
E. Blyth
To cite this version:
E. Blyth. Modelling soil moisture for a grassland and a woodland site in south-east England. Hy-drology and Earth System Sciences Discussions, European Geosciences Union, 2002, 6 (1), pp.39-48. �hal-00304648�
Modelling soil moisture for a grassland and a woodland site in south-east England Hydrology and Earth System Sciences, 6(1), 39–47 (2002) © EGS
Modelling soil moisture for a grassland and a woodland site in
south-east England
Eleanor Blyth
Centre for Ecology and Hydrology Wallingford, Wallingford, UK, OX10 8BB, UK Email: Emb@ceh.ac.uk
Abstract
This paper describes a comparison between two soil moisture prediction models. One is MORECS (Met Office Rainfall and Evaporation Calculation Scheme), the Met Office soil moisture model that is used by agriculture, flood modellers and weather forecasters to initialise their models. The other is MOSES (Met Office Surface Exchange Scheme), modified with a runoff generation module. The models are made compatible by increasing the vegetation information available to MOSES. Both models were run with standard parameters and were driven using meteorological observations at Wallingford (1995-1997). Detailed soil moisture measurements were available at a grassland site and a woodland site in this area. The comparison between the models and the observed soil moisture indicated that, for the grassland site, MORECS dried out too quickly in the spring and, for the woodland site, was too wet. Overall, the performance of MOSES was superior. The soil moisture predicted by the new, modified MOSES will be included as a product of Nimrod - the 5 km x 5km gridded network of observed meteorological data across the UK.
Key Words: Soil moisture, model, observation, field capacity
Introduction
Soil moisture influences many environmental properties of human interest: the growth of vegetation, the strength of the soil, the likelihood of flooding and even the weather. However, only limited data sets of soil moisture exist across the UK because it is a difficult property to measure. Remote Sensing can observe spatial fields of soil moisture but only if there is exposed bare soil and only in the top 10 cm. Soil moisture is naturally heterogeneous because of differences in moisture-holding capacities of the soil at a very small scale and topography. This means that point measurements of soil moisture may not be representative of the area.
The difficulty of observing soil moisture routinely over large areas and its importance to many areas of the environment means that it is a property that needs to be modelled well. Atmospheric modellers effectively defined soil moisture as ‘the value of θ in the land surface scheme that allows the rest of the model to reproduce correctly the surface energy balance’. Indeed, operationally, soil moisture in weather forecasting models is realigned after comparing observed and modelled near surface air temperatures.
Meanwhile, the hydrological modellers effectively defined their soil moisture as ‘the value of θ in the land surface scheme which allows the rest of the model to reproduce the surface water balance’ correctly. In other words, for both meteorological and hydrological models, the soil moisture soaks up the errors in the rest of the model, or errors in the driving data, particularly rainfall. These two definitions result in quite different values of soil moisture given the same driving data and this has led to the unsatisfactory conclusion that soil moisture is model dependent.
But hydrological and meteorological models are now merging and soil moisture needs to be accurate in an absolute sense. A fundamental question needs to be answered: Can soil moisture be modelled? More specifically, is it possible to model soil moisture contents which tally with best-observed data? Or is soil moisture always model-dependent? This paper covers some of these issues. Two models are compared, one of which is used routinely in hydrological applications. It is a pragmatic tool to predict soil moisture over the UK, given daily synoptic weather data and is used mainly by the agricultural community (Met Office Rainfall
and Evaporation Calculation System, MORECS). The other is a physics-based model to predict soil moisture given hourly weather data within a weather prediction model (Met Office Surface Exchange System, MOSES). Although there are many soil moisture datasets in the UK, it is rare to have some with the necessary data to drive the meteorological model. Two such data sets exist and both will be used in this paper.
To make the models as comparable as possible, some alterations were necessary. For this study, parts of MOSES were rewritten to include the seasonal Leaf Areas Indices used by MORECS. In addition, the data required to run the MOSES model were used to run the MORECS model. The MORECS model is driven with daily data but it makes separate calculations for day- and night-time. An empirical formula splits the daily mean temperature and windspeed to day and night values and converts sunshine hours to daily mean net radiation. For this analysis, the actual day and night wind speeds, temperatures and net radiation were used. The models were used uncalibrated, using their default soil and vegetation parameters. The models were run and compared to data at a grassland site on a medium soil at Wallingford as well as to data at a woodland site on a coarse soil in the Pang catchment.
Models
MORECSMORECS provides estimates of weekly and monthly evaporation and soil moisture deficit over 40 km × 40 km squares across the UK: it is driven by daily synoptic weather data. Part of the MORECS system is devoted to obtaining areal average weather variables for the squares.
The model, described in Hough and Jones (1997), has two soil moisture stores. One of the stores (the upper store) has water that is easily available (evaporation is at potential rate while there is water in this store) while water in the lower store is harder to access (evaporation from this store is at a rate that is less than potential).
The evaporation from the lower store is calculated using the Penman-Monteith equation. The surface resistance, rs, is calculated as follows:
(1)
where rsmin, is the minimum surface resistance, θ is the volumetric soil moisture content over the root depth and the subscript FC indicates the value at field capacity as defined later and w is the wilting point.
The water balance is calculated on a daily basis. The difference between the rainfall and the evaporation is added to the previous day’s soil moisture store. If the soil is at field capacity, then the difference between rainfall and evaporation is counted as runoff. There is a leaf interception store of 0.2 mm times the leaf area index. Evaporation from this store is estimated using the Penman-Monteith equation but with a value of rs=0.
The representation of different vegetation types is one of the great strengths of MORECS. It has seven types of land use: grass, rough grazing, deciduous trees, orchards and evergreen trees as well as bare soil, open water and rock/ urban land. For each of these land-use types the model has a different minimum surface resistance (which, for grass, changes with the month), a different leaf area index and, for the crops and the deciduous trees and the orchards, even different timings of changes of leaf area index. These timings depend on location in the UK.
In addition, each land-use type accesses the soil moisture in a different way – depending on the distribution and depth of the roots; some plants have an even distribution down through the soil while others have have a reduced density at lower levels.
MOSES
The land surface scheme in the Unified Model of the Met Office (referred to as MOSES) is described by Cox et al. (1999). Some key points are included here.
Soil moisture
MOSES has four soil layers, with layer depths of 0.1, 0.25, 0.65, 2.0 m. The flow between the layers is calculated according to the Darcy-Richards equations.
(2a) where
(2b)
(2c)
where K is the hydraulic conductivity ( kg m-2 s-1), ψ is the suction (m), θ is the volumetric soil water concentration in the layer, z is depth of soil (m), Q is the flow of water (kg m-2 s-1) and the subscript s indicates the value at saturation. − − − = 1.5 ) , min( ) ( 5 . 2 min w FC w FC s s r r θ θ θθ θ
[
z]
dz d K Q= ψ + 3 2+ = b s s K K θ θ b s s − = θ θ ψ ψModelling soil moisture for a grassland and a woodland site in south-east England
Evaporation
Evaporation is estimated using the Penman-Monteith equation and the surface resistance depends on the root-depth averaged soil moisture, θ, as follows:
(3a) where θc, is the critical point and θw, is the wilting point and
where
(3b) where i is the layer number, and the roots are assumed to be uniformly distributed through n soil layers. n is 3 for grass and crops, and 4 for trees. dzI is the fraction of the root depth of the soil layer i and θi is the soil moisture in that layer.
Runoff
Surface runoff is generated if the rainfall intensity is greater than the infiltration rate of the soil, which is assumed to be Ks, the saturated hydraulic conductivity. This occurs rarely in temperate zones. Saturation excess runoff is not modelled. If any layer is supersaturated, the water is routed to the layer below or to drainage if it is the bottom layer. Subsurface flow is generated by gravity drainage at the bottom of the soil column according to the following equation
(4) where Qd is the subsurface flow (kg m-2 s-1), θ
4 is the soil
moisture in the bottom layer (m3 m-3).
ALTERATIONS TO MOSES
There are two changes to the MOSES code: the inclusion of a seasonal leaf area index, which is similar to the MORECS code, and a new runoff generation scheme. Leaf Area Index
The Leaf Area Index in the MOSES code is fixed in time, and set according to a set of physiologically based equations. To include some seasonality (and to aid comparison with the MORECS calculations) the MORECS leaf area index formulae were used for the deciduous trees and a new land-use class was added, a crop, which land-used the MORECS formulae for winter barley. MORECS not only calculates the leaf area index according to the time of year but also, for the crop, the canopy height and the root depth. These were also included.
Runoff generation
The soil moisture distribution equation from the Probability Distribution Model (PDM), devised by Moore (1985), is coded into the top soil layer of MOSES. Figure 1 is a schematic of the method. The PDM uses the Xinanxiang distribution of Zhao(1977) to describe a distribution, f, of soil moisture capacities, C:
(5a) where Cm is the maximum storage capacity in the area and B defines the degree of spatial variability. C*,the critical storage capacity, is the largest capacity that is saturated at any time. Any of the cells in the distribution with a storage capacity less than C* are full.
(5b)
Integrating Eqn. (5a) from C=0 to C=Cm gives the relationship between Cm and θs as follows:
(5c) If precipitation P (m) is added to the area, the critical point increases as follows:
(5d) By inverting Eqn. (5b), θ can be calculated as a function of the critical point, C*. If this is combined with Eqn. (5d), the area storage before and after rainfall can be quantified. Any excess between the rainfall and the change in storage must be due to runoff as follows:
(6) − − = w w c s s r r θ θ θ θ min
∑
= = n i i i dz 1 θ θ 3 2 4 + = b s s d K Q θ θ B m C C C f − − =1 1 ) ( − − = +1 1 * 1 1 B s m C C θ θ ) 1 ( B Cm =θs + t dz C C C C dz P Q w B m B m s S ∆ − − − − = + + 1 1 * 1 * 1 ' 1 1 ρ θ 1 * *' dz P C C = +Fig. 1. Schematic of the PDM rainfall-runoff model put into the top
where QS is the surface runoff (kg m-2 s-1), ρ
w is the density
of water (kg m-3) and ∆t is the timestep (s).
Fields site and measurements
The models were run using observed meteorological driving data from a site in southern Britain (see Harding et al., 2000 for details). Hourly humidity, temperature, wind speed and net radiation data measured using a Hydra (Shuttleworth et al., 1988) are available from 1995 to 1997. Humidity was recorded using a Vaisala RH sensor, the air temperature with a thermocouple sensor and the net radiation with a REBS Q*6 radiometer. To provide the continuous record of forcing data required for model’s runs, these data were supplemented by data from an automatic weather station (AWS) operated at a site 200 m north-east of the Hydra. Comparisons showed that the agreement between these measurements was excellent. There was a small underestimate of the net radiation by the AWS Schenck radiometer. However the hours of high radiation were sufficiently few that the totals from the two radiometers agreed well.
GRASSLAND SITE
The measurements were taken in a pasture field at Wallingford, Oxfordshire, UK (51 36
´
N 1 7´
E). The field is permanent pasture classified as Lolium perenne-Cynosauritiis cristatus grassland community (Rodwell, 1993). It was grazed intermittently during the period of measurements such that the vegetation height varied from 10 to 30 cm. The field is flat, with a slight slope (1.5 m in 300 m) from the flux mast towards the River Thames. The soil is between 0.5 and 1 m of a clay loam underlain by a 4.5 m thick layer of calcerous gravels and sands (Jarvis et al., 1984). Table 1 shows the measured soil properties. Well level and soil moisture measurements showed that the groundwater was below 3 m for the study period and, therefore, outside the range of the grass roots.Regular soil moisture measurements from 1993 to 1997
are available. Measurements were made using a neutron probe (Bell, 1977) at a single tube. Readings were taken approximately weekly every 0.1 m in the top metre and then at every 0.2 m down to 3 m.
WOODLAND SITE
The study was carried out in the south of the catchment of the River Pang, which is located on the Berkshire Downs. The soils at the site (51 25.9
´
N, 1 15.1´
E) are sandy loams of the Wickham Series which are developed in the Reading Formation. Table 1 shows the measured soil properties.Soil water content was measured by a neutron probe. Weekly readings were taken at intervals of 0.1 m, to a depth of 2 m and at intervals of 0.2 m to a depth of 3 m from February 1997 to August 1998.
The woodland where the measurements were taken consists of mature oak (Quercus robur), larch (Larix decidua) and sweet chestnut (Castanea sativa). The land slopes gently down from the woodland through a grass field towards the River Pang.
Running the models
MODEL PARAMETERSInstead of tuning the models to fit the data, it was decided to use default parameters, which would be used operationally. The model’s performance presented in this paper does not, therefore, represent the best that the models can do in relation to the data, but represents what the models would predict in routine operation.
The default parameters for the grass and woodland used were C3 Grass and Deciduous Trees for MOSES and Grass and Deciduous Trees for MORECS. (See Cox et al., 1998 for MOSES parameter values and Hough and Jones, 1997
Table 1. Soil properties at the two sites
Grass site Tree site
θs (m3 m-3) 0.4 0.196
θw (m3 m-3) 0.128 0.03
θc (m3 m-3) 0.211
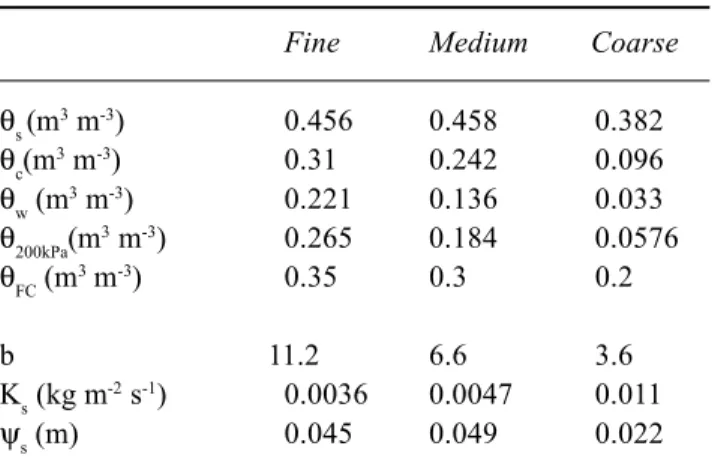
Table 2. Default soil properties in MOSES
Fine Medium Coarse
θs (m3 m-3) 0.456 0.458 0.382 θc(m 3 m-3) 0.31 0.242 0.096 θw (m3 m-3) 0.221 0.136 0.033 θ200kPa(m3 m-3) 0.265 0.184 0.0576 θFC (m3 m-3) 0.35 0.3 0.2 b 11.2 6.6 3.6 Ks (kg m-2 s-1) 0.0036 0.0047 0.011 ψs (m) 0.045 0.049 0.022
Modelling soil moisture for a grassland and a woodland site in south-east England
for MORECS values). Table 2 shows the soil properties for the three default soil types in MOSES. MORECS defines soil as having either high, medium or low available water capacity (AWC). The high values relate to the fine soils and the low to the coarse. Comparing the measured properties shown in Table 1 with these, it was possible to choose the closest default type: the soil type chosen for the Howbery site was ‘medium’ and for the Pang site was ‘coarse’ or low AWC. MOSES was run with and without the surface runoff module. When it is run with (MOSES+PDM) the value of ‘B’ in the runoff module (Eqn. 6) used was 1.
INITIALISATION
The data show that 1995 was close to having an annual water balance in this area. This year was used as a spin up year, for which the models were run several times until the soil moisture stores reached equilibrium. Results for 1995 to 1997 are shown for the grassland (Fig. 3) and for the woodland (Fig. 5).
Discussion of the definition of model
soil moisture
Before comparing the output from the two models, some discussion of the definition of model soil moisture is required.
MOSES represents the soil moisture content, since it affects the thermodynamics. MORECS doesn’t model soil temperatures and instead, the soil moisture deficit, or SMD, (positive down from field capacity) is used.
(7) where ZR is the root depth.
For the purposes of this comparison, the MORECS SMD is converted to actual soil moisture by reversing Eqn. (7). But what is the value of θFC? In MORECS, the Field Capacity
is the soil moisture at which the tension is 5 kPa or 10 kPa. This is of the same order as the value of tension (3.3 kPa) used in MOSES to define the ‘critical’ soil moisture, below which the plants start to feel water stress and evaporation drops below potential. MORECS defines ‘critical’ soil moisture at a tension of 200 kPa. This critical soil moisture is an important anchor in the dynamics of the modelled soil moisture. Because of this, if the soil tension of 5 to 10 kPa is used to define field capacity in MOSES, the soil moisture contents of MORECS won’t be comparable.
It is necessary to go back to the definition of field capacity which is as follows: the value of soil moisture when gravity drainage becomes close to zero after saturation (Ward and Robinson, 1990). In practice, this is interpreted as the
maximum observed soil moisture over a wet winter or the value of soil moisture 48 hours after rain that wetted the soil thoroughly. There is no simple relationship between field capacity and the other soil parameters. It relates to the interaction of the stress functions with the conductivity functions. For instance, permeable soils achieve field capacity at much lower suctions than less permeable soils. In a bucket model (like MORECS), it needs to be defined, but in a layered model (like MOSES) which simulates the interaction between the stress and conductivity functions explicitly, this balance is found by the model.
To compare the models therefore, the field capacity as found by MOSES must be adopted for both models. It is the value of soil moisture simulated by MOSES in a wet winter (1995) using a land-use cover of bare soil. The values are given in Table 2.
Discussion of the water balance
One of the interesting, yet simultaneously frustrating aspects about surface models is that they can neither be assessed simply in terms of the formulae used to represent the processes, nor in terms of the parameters used in the formulae. There are too many interactions between the different processes for such a simple analysis. This paper considers the interaction between evaporation, runoff, drainage and the soil moisture. Koster and Milly (1997) initiated assessment of the water balance of a complex land surface scheme by looking at its monthly evaporation and runoff/drainage response in relation to the mean monthly soil moisture; it was the relative position of these two processes with respect to soil moisture that mattered. This, in part, explains why soil moisture has been so neglected in the past as its actual value is irrelevant to the desired output. Although this paper is concerned with the values of soil moisture, the comparison of the water balance is also interesting. The main difference between the two evaporation formulae of the two soil moisture models is the choice of soil water tension at which the evaporation becomes less than potential. This difference has now been eliminated by using field capacity defined internally by MOSES to calculate the soil moisture of MORECS. The difference in the way runoff and drainage are formulated is more significant. In MORECS, the excess water that is not used for evaporation or for topping up the two soil-water reservoirs is counted as drainage. In other words, runoff occurs only when all the soil reaches field capacity. MOSES on the other hand has both a surface runoff scheme and a deep soil drainage scheme, and both of these occur at soil moistures below field capacity.
Therefore, in the MORECS model, the soil moisture state
R FC Z
is either in the evaporation-limiting state (θ <θFC) OR in the
runoff-producing state (θ >θFC). In MOSES on the other
hand, evaporation stress and runoff occur across the same range of soil moisture, and these two processes occur simultaneously and at all times.
The evaporation of MORECS will therefore be higher than that of MOSES, because the soil moisture will spend more of its time at the higher end of its range
Comparison of models and with data
GRASS SITEEvaporation
Figure 2 shows the monthly water balance for the grass site. The MOSES results do not lend themselves to the formal analysis of Koster and Milly (1997) which relies on slopes being quantified. But Fig. 2 shows that the general analysis outlined in the previous section is correct and that the evaporation will be higher for the MORECS run. The total evaporation for the Grass site for the three years is given in Table 3. The value in brackets is the evaporation summed over the days for which data are available. MORECS overestimates the evaporation and MOSES underestimates
it. This was also noted in Harding et al. (2000). Soil moisture
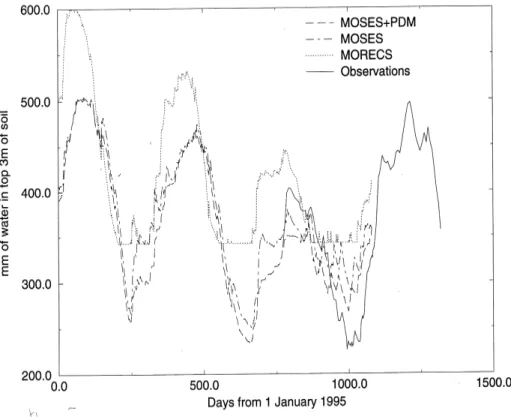
Figure 3 shows the soil moisture content at the grass site. Observations show a winter to summer range of 185 mm in 1995, 155 mm in 1996 and 100 mm in 1997 and a mean of 245mm. The observed range of soil moisture was underestimated by all the models. There are two MOSES simulations in this figure. The original MOSES (without surface runoff) has winter to summer ranges with 155 mm, 140 mm and 76 mm respectively and a mean of 270 mm. However, it is too wet in the summer and autumn of 1997. Table 3. Total evaporation over three years
Grassland (mm) Woodland (mm)
MOSES+PDM 815 (755) 993
MOSES 730 (676) 954
MORECS 1085 (1005) 1325
Observation 964
Fig. 2. Modelled monthly water balance of the grassland site. Open symbols are for MORECS, closed for
MOSES. The circles are the ratio of the evaporation from the soil (via the roots) to the potential evaporation. The triangles are the ratio of the runoff to the precipitation minus the interception loss. For the MOSES results, the upwards pointing triangles are surface runoff and the downwards pointing triangles are drainage. This model analysis follows Koster and Milly (1997).
Modelling soil moisture for a grassland and a woodland site in south-east England
Fig. 3. Soil moisture over three years starting on 1 January 1995 for the grassland site. Solid line is the
observations, dashed is MOSES+PDM, dot-dashed is MOSES and dotted is MORECS.
Fig. 4. Modelled monthly water balance of the woodland site. Open symbols are for MORECS, closed for
MOSES. The circles are the ratio of the evaporation from the soil (via the roots) to the potential evaporation. The triangles are the ratio of the runoff to the precipitation minus the interception loss. For the MOSES results, the upwards pointing triangles are surface runoff and the downwards pointing triangles are drainage. This model analysis follows Koster and Milly (1997).
MOSES+PDM, on the other hand has even smaller winter to summer ranges: 145 mm, 125 mm and 80 mm. The mean is captured (240) and the final autumn simulation matches the observations well. This demonstrates the value of including the surface runoff module.
MORECS has winter to summer ranges of 130 mm, 130 mm and 105 mm in the three years respectively and a mean of 250 mm. It does not wet up enough in the winters and subsequently dries out too quickly in the spring; the maximum soil moisture allowed in MORECS is the field capacity and this may be too small.
WOODLAND SITE Evaporation
Figure 4 shows the monthly water balance for the woodland site. As with the grassland site, this graphical summary of the performance of the two models shows that the evaporation will be higher for the MORECS run. Table 3 shows that the model output confirms this analysis.
Soil moisture
Figure 5 shows the soil moisture content at the woodland site. Unfortunately there are data only for 1997 to compare to the model outputs. The range in the observations was 170 mm and the mean was 300 mm. Both MOSES and
Fig. 5. Soil moisture over three years starting on 1 January 1995 for the woodland site. Solid
line is the observations, dashed is MOSES+PDM, dot-dashed is MOSES and dotted is MORECS.
MORECS underestimate the range and overestimate the mean. As with the grass simulation, the MOSES+PDM run is drier than the MOSES original, although there is no great difference. The PDM makes less difference for coarse soils (Blyth, 2001).
Overall, the soil moisture estimate of MORECS (mean of 1997 is 375 mm) is higher than that of MOSES+PDM (mean of 1997 is 320 mm). However, the ranges are similar: 255 mm, 200 mm and 115 mm for MORECS and 240 mm, 240 mm and 95 mm for MOSES+PDM. The high mean of the MORECS model for woodland may be because the maximum deficit allowed is too small, just as it was for grass. On the other hand the MOSES+PDM evaporation may be too high in winter, which keeps the soil moisture so far below field capacity. Overall, the error of the mean soil moisture compared to the observations seems to be greater in MORECS than in MOSES.
Conclusions
Two contrasting models (MORECS and MOSES) in uncalibrated mode were compared using available data for a grassland site on a medium soil and for a woodland site on a coarse soil. Because MORECS deals in soil moisture deficits, the soil moisture content in MORECS is a function of the definition of field capacity. This is in contrast to
Modelling soil moisture for a grassland and a woodland site in south-east England
MOSES where the soil moisture is an absolute value, like the observed soil moisture. Before any analysis could proceed, this value needed to be defined.
Field capacity is a function of the interaction between the upwards pull of the water, controlled by the soil-water tension curve and the downwards movement of the water controlled by the hydraulic conductivity curve. MOSES, a four-layer model, simulates this interaction explicitly. Thus, field capacity was defined as the value given by MOSES in a wet winter (1995) when run with a bare soil (to minimise evaporation).
Having altered the models to be as compatible and comparable as possible, it was found that both models did remarkably well. The soil moisture was not ‘model dependent’ but was close to the observations. Neither model drifted over the three years and both showed reasonable seasonal variation and mean soil moisture. MORECS displayed a tendency to dry up too quickly in the spring which might be due to not allowing the soil moisture ever to exceed field capacity. The woodland site was much wetter than MOSES, which may overestimate evaporation in the winter. Overall, MOSES performed in a way that was more consistent with the observations at these two sites.
The results showed that MOSES is too wet for a medium soil without representation of surface runoff. The inclusion of a rainfall-runoff model improved the soil moisture prediction considerably.
Clearly, this paper cannot prove that MOSES reproduces soil moisture at all times and in all places. More research is required. Often, the lack of driving data has hampered such work, so that even though soil moisture measurements are available over a wide variety of soil types across the UK, it has not been possible to run the state-of-the-art soil moisture models. However, a new meteorological product has recently become available. Nimrod produces a grid of best-estimate values of all the necessary driving data on a 5km grid across the UK at an hourly time step. This could be used in the future to expand the comparison between models and data.
Acknowledgements
The author thanks Malcolm Hough for providing the MORECS code and for the helpful discussion on this paper. Funding for this research was from the Met Office.
References
Bell, J.P., 1977. Neutron probe practice, Institute of Hydrology Report no 16, Wallingford, UK.
Blyth, E.M., 2001. Relative influence of vertical and horizontal processes in large-scale water and energy balance modelling.
IAHS Publ. no 270, 3–10.
Cox, P.M., Betts, R.A., Bunton, C., Essery, R.L.H., Rowntree, P.R. and Smith, J., 1999. The impact of new land surface physics on the GCM simulation of climate and climate sensitivity.
Climate Dynamics, 15, 183–203.
Harding, R.J., Huntingford, C. and Cox, P.M., 2000. Modelling long-term transpiration measurements from grassland in southern England. Agric. Forest. Meteorol., 100 309–322. Hough, M.N. and Jones, R.J.A., 1997. The UK Met Office rainfall
and evaporation calculation system: MORECS version 2.0 – an overview. Hydrol. Earth Syst. Sci., 1, 227–239.
Jarvis, M.G., Allen, R.H., Fordham, S.J., Hazelden, J., Moffat, A.J. and Sturdy, R.G., 1984. Soils and their uses in south-east England. Soil Survey of England and Wales, Bulletin No. 15. Koster, R.D. and Milly, P.C.D., 1997. The interplay between
transpiration and runoff formulations in land surface schemes used with atmospheric models. J. Climate., 10. 1578–1591. Moore, R.J., 1985. The probability distributed principle and runoff
production at point and basin scales. Hydrol. Sci. J., 30, 263– 297.
Rodwell, J.S., (Ed.), 1993. British Plant Communities. Cambridge University Press, Cambridge.
Shuttleworth, W.J., Gash, J.H.C., Lloyd, C.R., McNeil, D.D., Moore, C.J. and Wallace, J.S., 1988. An integrated micrometeorological system for evaporation measurements.
Agric. Forest. Meteorol., 43, 295–317
Ward, R.C. and Robinson, M., 1990. Principles of Hydrology. . McGraw-Hill, Maidenhead, UK. 365pp.
Zhao, R.J., 1977. Flood forecasting method for humid regions of