Effect of Droplet Morphology on Growth Dynamics
and Heat Transfer during Condensation on
Superhydrophobic Nanostructured Surfaces
The MIT Faculty has made this article openly available. Please share
how this access benefits you. Your story matters.
Citation
Miljkovic, Nenad, Ryan Enright, and Evelyn N. Wang. “Effect of
Droplet Morphology on Growth Dynamics and Heat Transfer during
Condensation on Superhydrophobic Nanostructured Surfaces.” ACS
Nano 6, no. 2 (February 28, 2012): 1776-1785.
As Published
http://dx.doi.org/10.1021/nn205052a
Publisher
American Chemical Society (ACS)
Version
Author's final manuscript
Citable link
http://hdl.handle.net/1721.1/85004
Terms of Use
Article is made available in accordance with the publisher's
policy and may be subject to US copyright law. Please refer to the
publisher's site for terms of use.
Effect of Droplet Morphology on Growth Dynamics and Heat Transfer during
Condensation on Superhydrophobic Nanostructured Surfaces
Nenad Miljkovic,† Ryan Enright,†,‡ and Evelyn N. Wang†,* †Department of Mechanical Engineering, Massachusetts Institute of Technology,
77 Massachusetts Avenue, Cambridge, Massachusetts 02139, USA
‡Stokes Institute, University of Limerick, Limerick, Ireland
*Address correspondence to enwang@mit.edu
ABSTRACT
Condensation on superhydrophobic nanostructured surfaces offers new opportunities for enhanced energy conversion, efficient water harvesting, and high performance thermal management. These surfaces are designed to be Cassie stable and favor the formation of suspended droplets on top of the nanostructures as compared to partially wetting droplets which locally wet the base of the nanostructures. These suspended droplets promise minimal contact line pinning and promote passive droplet shedding at sizes smaller than the characteristic capillary length. However, the gas films underneath such droplets may significantly hinder the overall heat and mass transfer performance, which has not been considered previously. In this work, we investigated droplet growth dynamics on superhydrophobic nanostructured surfaces to elucidate the importance of droplet morphology on heat and mass transfer. By taking advantage of well-controlled functionalized silicon
nanopillars, we observed the growth and shedding behavior of both suspended and partially wetting droplets on the same surface during condensation. Environmental scanning electron microscopy was used to demonstrate that initial droplet growth rates of partially wetting droplets were 6 larger than that of suspended droplets. We subsequently developed a droplet growth model to explain the experimental results and showed that partially wetting droplets had 4-6 higher heat transfer rates than that of suspended droplets. Based on these findings, the overall performance enhancement created by surface nanostructuring was examined in comparison to a flat hydrophobic surface. We showed these nanostructured surfaces had 56% heat flux enhancement for PW droplet morphologies, and 71% heat flux degradation for S morphologies in comparison to flat hydrophobic surfaces. This study provides insights into the previously unidentified role of droplet wetting morphology on growth rate, as well as the need to design Cassie stable nanostructured surfaces with tailored droplet morphologies to achieve enhanced heat and mass transfer during dropwise condensation.
KEYWORDS: dropwise condensation, ESEM, droplet growth dynamics, wetting, superhydrophobic, nanostructured design, heat transfer enhancement
Vapor condensation is a phenomenon widely observed in nature and an essential part of energy conversion,1
water harvesting,2, 3 and thermal management systems.4-7 Improvements in heat and mass transfer during this
phase change process, therefore, can lead to a considerable conservation of natural and economic resources. When water vapor condenses on a surface, the condensate can form either a liquid film or distinct droplets, depending on the surface wettability. The latter, termed dropwise condensation, is desired since the droplets can be efficiently removed from the surface, which significantly increases heat and mass transfer performance.8
Recent research has focused on using a combination of chemical functionalization and roughness to create superhydrophobic surfaces for dropwise condensation, whereby droplets easily roll off the surface due to gravity upon reaching a critical size (~ 2 mm).9-11
A recent study however showed that when small droplets (~ 10 - 100 µm) merge on superhydrophobic nanostructured surfaces, droplets can spontaneously eject via the release of excess surface energy independent of gravity.12, 13 This phenomenon is attributed to the nanoscale surface roughness (~ 100 nm), which enhances
the hydrophobicity, and thereby decreases droplet pinning to the surface.14 Droplet removal by this mechanism
is highly desirable due to the increased number of small droplets15 which efficiently transfer the majority of the
heat from the surface.1, 16, 17 A number of works have since fabricated superhydrophobic nanostructured surfaces
to achieve spontaneous droplet removal.7, 18-22 These surfaces were designed to be Cassie stable such that
droplets are suspended (S) on gas-filled nanostructures23 to have minimal contact line pinning due to the
nanoscale roughness, which is in contrast to Wenzel stable surfaces with droplets that wet the cavities of the nanostructures24 and cannot be removed via droplet ejection due to the highly pinned contact line. Recently, two
distinct wetting morphologies on Cassie stable surfaces during condensation have been reported where in addition to S droplets, partial wetting (PW) droplets that locally wet the substrate in between the pillars (i.e., with liquid-filled nanostructures under a portion of the nominally Cassie droplet)25-27 can exist. While to date it
has been unclear whether PW droplets can undergo droplet ejection, S droplets were considered to be desired due to their decreased contact line pinning to the nanostructured surface.3, 15, 18, 20 However, the gas-layer
beneath these droplets can act as a barrier to heat transfer and can degrade overall heat and mass transfer performance, which was not considered in previous studies.
Here, we investigated in situ water condensation on superhydrophobic nanostructured surfaces using environmental scanning electron microscopy (ESEM).5, 7, 15, 19-21, 25, 26, 28-30 The surfaces were designed to be
Cassie stable and allowed droplets of both S and PW morphologies to coexist due to the presence of nanoscale scallop features (~ 100 nm). These surfaces allowed characterizations and direct comparisons of growth rates and removal mechanisms for both droplet morphologies under identical condensation conditions. The
experimental results showed that while both S and PW droplets ejected at identical length scales, the growth rate of PW droplets was 6 larger compared to that of S droplets. This effect was further highlighted with
experiments demonstrating S to PW droplet transitions, which showed a 2.8 increase in growth rate due to the change in wetting morphology. Accordingly, the heat transfer of the PW droplet was 4-6 higher than that of the S droplet. Based on these results, we compared the overall surface heat and mass transfer performance
enhancement created by surface structuring with that of a flat hydrophobic surface. We showed these nanostructured surfaces had 56% heat flux enhancement for PW droplet morphologies, and 71% heat flux degradation for S morphologies in comparison to flat hydrophobic surfaces. In contrast to previous studies, we show that designing Cassie stable superhydrophobic nanostructured surfaces is not the only requirement for efficient dropwise condensation and that the droplet morphology prior to shedding must be carefully considered to achieve enhanced heat and mass transfer.
RESULTS AND DISCUSSION
To study the effects of droplet wetting morphology on growth rate and overall heat transfer, we fabricated silicon nanopillar surfaces (Figure 1A) with diameters of d = 300 nm, heights of h = 6.1 μm, center-to-center
spacings of l = 2 μm (solid fraction φ = πd2 / 4l2 = 0.018 and roughness factor r = 1 + πdh’ / l2 = 3.26) using
e-beam lithography and deep reactive ion etching (DRIE). The DRIE fabrication process was used to create nanoscale roughness (scallops) on the sides of the pillars. The surfaces were subsequently functionalized using chemical vapor deposition of (tridecafluoro-1,1,2,2-tetrahydrooctyl)-1-trichlorosilane to create Cassie stable superhydrophobic surfaces (see Methods section for details).
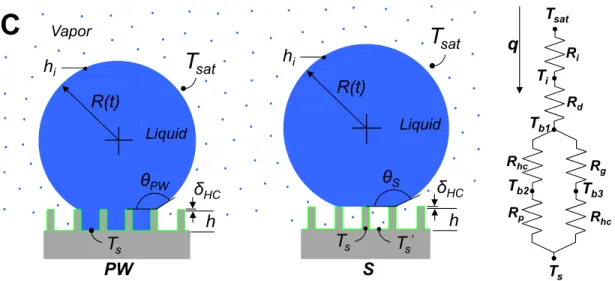
Droplet growth on the surfaces was characterized using ESEM at a water vapor pressure P = 1200 ± 12 Pa and substrate temperature Ts = 9 ± 1.5 °C (see Methods section for details). Figure 1B shows the two distinct
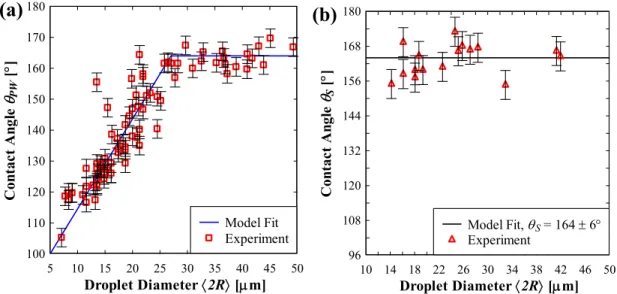
droplet morphologies, PW and S, on the structured surface. PW droplets nucleated within a unit cell (area between 4 pillars) and, while growing beyond the confines of the unit cell, their apparent contact angle increased and they spread across the tops of the pillars in the shape of a balloon with a liquid bridge at the base of the pillars. Before coalescence with neighboring droplets, an increasing proportion of the droplet contact area was in the composite state and demonstrated an apparent contact angle of θPW = 164 ± 4º for 〈R〉 > 15 µm. S droplets
nucleated and grew on the tops of the pillars in a spherical shape with a constant apparent contact angle of θS = 164 ± 6º. At these droplet sizes (〈R〉 ~ l), the S wetting configuration is typically energetically unfavorable
due to a Laplace pressure instability mechanism,31 but is attributed here to the presence of the nanoscale scallop
features on the pillar sides that pin the contact line (see Supporting Information, sections S3 and S4). Figure 1C shows time lapse images of both PW and S droplets, which highlights the drastic difference in droplet
morphology and growth rates on the surface (see Supporting Information, VideoS2). As the droplets grew and began to interact with each other, removal via coalescence-induced droplet ejection12, 13, 15 was observed for
both S and PW droplets. The results suggest that the contact line pinning force for both morphologies is in fact below the critical threshold for ejection (see Supporting Information, section S5 and VideoS1).
The experimentally obtained average droplet diameters as a function of time for the PW and S morphologies are shown in Figures 2A and B, respectively. The growth rate of the S droplet was initially 6 lower than that of the PW droplet for 〈R〉 < 6 μm. As the droplets reached radii 〈R〉 > 6 μm, the growth rates for both morphologies became comparable which suggests a similar mechanism limiting droplet growth at the later stages.
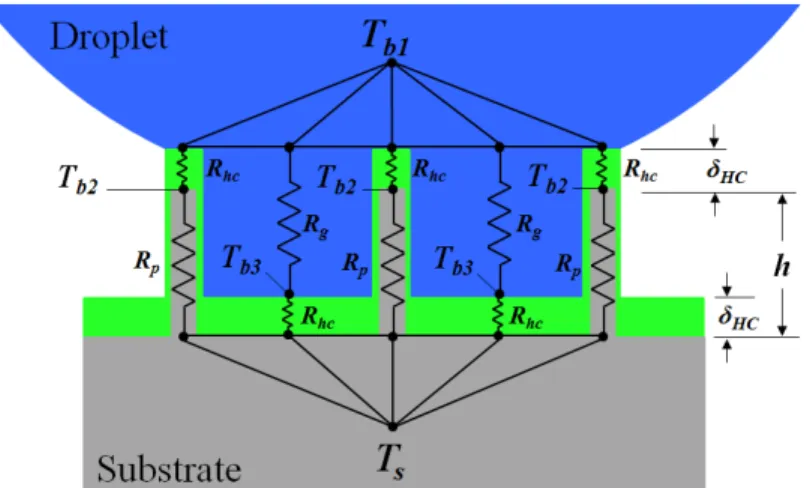
To provide insight into the experimental results and capture the growth dynamics related to the different droplet morphologies, we developed a thermal resistance based droplet growth model. The model, which accounts for the presence of hydrophobic pillar structures, is an important extension of a previous model suitable for dropwise condensation on flat hydrophobic surfaces.10 Figure 2C shows schematics of the PW and S
droplets with the associated parameters used in the growth model. Heat is first transferred from the saturated vapor to the liquid-vapor interface through resistances associated with the droplet curvature (Rc) and
liquid-vapor interface (Ri). Heat is then conducted through the droplet and the pillars to the substrate through
resistances associated with the droplet (Rd), hydrophobic coating (Rhc), pillars (Rp) and gap (Rg). Marangoni and
buoyancy effects are neglected since the droplets are sufficiently small so that conduction is the dominant mode of heat transfer.32, 33 Accounting for all of the thermal resistances, the heat transfer rate, q, through a single
∆ 2 ∆ 2 1
2 1 cos 4 sin sin1 2 1
1 ,
(1)
where Rtot is the total thermal resistance through the droplet, R is the droplet radius, ρw is the liquid water
density, hfg is the latent heat of vaporization, Tsat is the vapor saturation temperature, σ is the water surface
tension, ΔT is the temperature difference between the saturated vapor and substrate (Tsat – Ts), δHC and h are the
hydrophobic coating thickness (~ 1 nm) and pillar height, respectively, kHC, kw, and kP are the hydrophobic
coating, water, and pillar thermal conductivities, respectively, and hi is the interfacial condensation heat transfer
coefficient.34 The first, second and third terms in the denominator represent the liquid-vapor interface (R
i),
droplet conduction (Rd), and pillar-coating-gap (P-C-G) thermal resistances (Rp, Rhc, Rg), respectively
(Figure 2C). The heat transfer rate is related to the droplet growth rate dR/dt by
(2)
During early stages of growth (R < 6 μm), the conduction resistance (Rd) is negligible compared to the other
thermal resistances. Therefore, for the PW droplet, the pillar (Rp + Rhc) and liquid bridge (Rg + Rhc) resistances
dominate the heat and mass transfer process. However, for the S droplet, the only conduction path is through the pillars (Rp + Rhc), which results in a higher total thermal resistance and the observed 6 lower initial growth rate.
Note that the pillar (Rp), coating (Rhc) and gap (Rg) thermal resistances are not the only reasons for the divergent
growth behavior of the two droplet morphologies. The higher initial contact angle of S morphology (see Supporting Information, section S3) contributes to its slower growth rate due to a lower droplet basal contact area. As both droplet morphologies reach a critical radius, Rcd ≈ 6 μm, the conduction resistance (Rd) begins to
dominate and limit the growth rate in both cases.32 A theoretical estimate of R
cd was obtained by balancing the
conduction resistance through the droplet, Rd = Rθ/(4πR2kwsinθ), with the interfacial, Ri = 1/(2πR2hi(1-cosθ) and
P-C-G, RP-C-G ~ kPφ/(kHCπR2sin2θ(δHCkP + hkHC)) thermal resistances.35 The interfacial and conduction
resistances become equivalent at a radius Rcd = 4kwsinθ(Ri + RP-C-G)/θ ≈ 6 μm, which is in good agreement with
our experiments.
The results from the model (red lines) are also shown in Figures 2A and B and are in excellent agreement with the experiments (black circles). Model solutions were obtained for ΔT = 0.12 K where ΔT was chosen based on the best fit between the model and experimental growth rate data. The approximate value of ΔT from the experiments was ΔT = Tsat(P = 1200 Pa) – 282.15 ± 1.5 K = 0.65 ± 1.5 K. Therefore, the value used in the
model is within the error of the experimental apparatus. In addition, the small value of ΔT is consistent with the assumption that only molecules near the substrate contribute to the phase change process, i.e., the local vapor pressure is lower than the measured bulk vapor pressure.28
In order to gain further insight, we compared the experimental results with the power law exponent model.13, 36-42 When droplet dimensions are larger than the surface pattern length scales (〈R〉 > 2 μm), droplets grow as
breath figures on a surface with an expected average droplet radius of 〈R〉 = ρtα where α, the power law
exponent, ranges from 0 to 1 depending on the droplet, substrate dimensions and growth limiting conditions. During initial growth without coalescence, the power law exponent was αPW = 0.78 ± 0.02 and αS = 0.46 ± 0.03
for the PW and S drops, respectively. Both values were within the range of 0 to 1, but differ from the expected 1/3 power law.40 This result indicates that vapor diffusion to the droplet interface was not the limiting growth
mechanism, instead a kinetic barrier was formed due to the low ESEM pressures (P = 1200 Pa).28 When the
average droplet diameter 〈2R〉 reached the coalescence length, both morphologies grew at a power law exponent of αPW = αS = 0.05 ± 0.15 as expected, i.e., the average diameter was constant due to coalescence induced
droplet ejection.13
Transitioning Droplets
In certain cases when the nanoscale scallop features on the pillars could not pin the droplet contact line, we observed S droplets transitioning to PW droplets (Figure 3A) (see Supporting Information, VideoS3). This phenomenon further demonstrated the importance of the droplet wetting morphology on growth rate. Figure 3B shows the growth rate of three distinct S droplets, two of which underwent transition into the PW state. Upon transition, a liquid bridge formed between the droplet and substrate and the apparent contact angle decreased. The growth rate of these droplets increased by 2.8 compared to the S droplet immediately after transition. The transitioned growth rate (dR/dt = 0.34 µm/s) exceeded the steady growth rate of a comparably sized PW droplet (dR/dt = 0.18 µm/s), indicating that the driving potential for growth was larger. The increased rate was attributed to a larger substrate-vapor temperature difference (Tsat – Ts) due to additional subcooling from the constriction
resistance at the base of the pillars (Ts – Ts’).35 By determining the average temperature at the base between
pillars using a spatial conduction resistance and incorporating the additional surface subcooling into the droplet growth model, the theoretical results show excellent agreement with the experiments (Figure 3B) (see section S7 of Supporting Information). Note that at these transitioning length scales (~ 10-6 m), surface diffusion growth
due to adsorbed atoms on the substrate is negligible and cannot account for the rapid increase in growth.43-45
Implications to Heat Transfer
Based on the understanding developed for individual droplet growth rates, we investigated the heat and mass transfer performance of the two distinct droplet morphologies. To quantify the difference in performance prior to coalescence-induced ejection, the total heat removed Q by the individual droplet was determined
(3)
where lc is the coalescence length or alternatively, can be considered the coalescing droplet diameter when
droplets merge and shed from the surface.13 R* is the critical droplet radius for nucleation which is
approximated as zero due to its small magnitude (~ 10 nm). The ratio of the heat transfer rates for individual PW and S droplets, qPW / qS, is therefore approximated by
(4)
where θPW and θS are the PW and S contact angles at coalescence, respectively, and τpw and τs are the PW and S
droplet coalescence times (times at which coalescence occurs) corresponding to a coalescence length lc,
2 ∗
1
3
1
cos
22
cos
2
3,
1 cos 2 2 cos 1 cos 2 2 cos ,respectively. The coalescence times for the experimental and modeling results in Figure 4 were obtained from the growth rates in Figures 2 and 3. The higher error at lower coalescence lengths is due to the larger deviation between experimental and model growth rates for the S morphology, as well as larger experimental error associated with ESEM measurements for small droplet sizes.
Figure 4 shows the heat transfer ratio model overlaid with experiments, where a 4-6 droplet heat transfer increase during dropwise condensation was demonstrated for PW compared to S droplets. As expected, the increased thermal resistance associated with the S droplet morphology decreases the growth rate and, as a result, severely limits individual S droplet heat transfer when compared to its PW counterpart. The heat transfer enhancement diminishes at larger coalescence lengths due to the increasing droplet conduction thermal resistance for both droplet morphologies, resulting in similar growth rates. Figure 4 indicates that meeting the criteria for Cassie stable surfaces is not the only requirement for heat and mass transfer enhancement. In fact, preferential formation of Cassie droplets with the S morphology can even degrade total surface heat and mass transfer performance when compared to a flat (non-nanostructured) hydrophobic surface, which is investigated in the next section.
Comparison to a Flat Hydrophobic Surface
The insights gained regarding individual droplet wetting morphology led to an investigation of the overall performance enhancement created by nanostructuring compared to a flat (no surface structuring) hydrophobic surface. Specifically, we aimed to address whether the benefit of droplet departure below the characteristic capillary length created by nanostructuring outweighs the disadvantage of reduced growth rates due to the increased thermal resistance associated with the S droplet morphology.
Additional ESEM droplet growth studies were performed on a flat hydrophobic surface for comparison (see section S8 of Supporting Information). The flat surface sample consisted of a silicon substrate, functionalized by CVD as described above. Droplet growth on the flat surface was characterized using identical condensation conditions as the nanostructured surfaces and also showed good agreement with the thermal resistance model.
To compare the theoretical surface heat and mass transfer performance on the flat and nanostructured surfaces, we combined droplet size distribution theory, to account for the fraction of droplets on the surface of a given radius R, with the developed droplet growth model. For small droplets, the size distribution n(R) is determined by10 (5) where (6) (7) 1 3 2 2 3 ∗ ∗ 2 3 2 3exp 1 2 , 1 2 1 2 2 2 ∗ ∗2ln ∗ ∗ , 2 2 1 ∗ln ∗ ∗ ,
(8)
(9)
(10)
(11)
Ȓ is the average maximum droplet radius (departure radius), τ is the droplet sweeping period, and Re is the
radius when droplets growing by direct vapor addition begin to merge and grow by droplet coalescence,
Re = lc / 2. For large droplets growing mainly due to coalescence, the droplet distribution N(R) was determined
from17
(12)
The total surface steady state condensation heat flux, q”, was obtained by incorporating the individual droplet heat transfer rate (Equation 1) with the droplet size distributions (Equations 5 and 12)
(13)
For droplets growing on the flat surface (F), Ȓ was assumed to be 2 mm,10 and l
c = 2Re = 28 ± 7 µm.
Droplet growth on the structured surface above the coalescence length for both PW and S morphologies was neglected because most droplets coalesced and ejected from the surface.15 In addition, the sweeping time τ was
assumed to be infinite on the nanostructured surface due to the coalescence induced ejection departure mechanism, and lc = 2Re = 2Ȓ = 10 ± 2 µm. Figure 5 shows the total surface heat flux, q”, as a function of the
difference between the wall and saturation temperature, ΔT, for these surfaces with the three identified wetting morphologies (PW, S, and F). As expected, the structured surface with the PW wetting morphology showed a 56% heat flux enhancement when compared to that of the flat surface. Meanwhile, a 71% heat flux degradation was shown for the surface with the S wetting morphology which indicated the increased thermal resistance and the slower growth rate prior to coalescence outweighed the benefits of droplet ejection. Figure 5 indicates that meeting the criteria of Cassie stability is not the only requirement for heat and mass transfer enhancement via nanostructuring.
This comparison (Figure 5) assumed only PW or S droplet morphologies existed exclusively on the structured surfaces. In actuality, approximately the same number of PW and S wetting morphologies were observed on the nanostructured surface in this work, resulting in a total surface heat flux degradation of 12% when compared to the flat hydrophobic surface.
3 2 2 3 2 1 11 2 2 14 2 ∗ 8 3 11 3 ∗ , 1 ∆ 1 cos 2 2 cos , 2 4 sin , 3 1 2 1 cos 1 sin2 1 1 . 1 3 2 2 3 .
"
∗.
It is important to note that the difference in observed coalescence lengths between the flat and structured surfaces contributed to the heat and mass transfer performance. To control for this parameter, we investigated the hypothetical case where the coalescence length for all three droplet morphologies is equivalent,
lc,PW = lc,S = lc,F = 10 ± 2 µm. For the hypothetical case, the PW and S wetting morphologies showed an 11%
enhancement and an 80% degradation compared to the flat surface, respectively. As expected, the PW enhancement decreased and S degradation increased due to the higher heat and mass transfer of the F
morphology associated with the increased population of droplets with radii below the coalescence length.1, 16, 17
To gain a broader understanding of the P-C-G thermal resistance, the developed model was used to investigate the effect of pillar height (h) and coalescence length (lc) on the PW to F heat flux ratio (q”PW / q”F)
(Figure 6). This comparison assumed lc = 2Re = 2Ȓ for the PW surface, lc = 2Re = 28 ± 7 µm for the F surface,
and that scaling down the pillar height does not affect the PW surface wetting state or contact angle behavior. As expected, the results show that the heat flux ratio increases as h decreases due to the smaller P-C-G thermal resistance. In addition, a reduction in lc acts to increase the heat transfer ratio due to earlier droplet removal from
the surface and a higher population of smaller droplets.15 The results of these analyses further emphasize the
conclusion that structured surface droplet wetting morphology needs to be carefully controlled to realize enhanced condensation heat and mass transfer. Furthermore, the analysis suggests the importance of minimizing the thermal resistance of the PW morphology (i.e., by reducing pillar height), while ensuring Cassie stability to achieve dropwise condensation heat and mass transfer enhancement via surface structuring.
CONCLUSIONS
In summary, we demonstrated the importance of droplet wetting morphology on condensation growth rates for Cassie stable surfaces via an in situ ESEM study of S and PW droplet morphologies on superhydrophobic nanostructured surfaces. While both droplet morphologies demonstrated coalescence induced droplet ejection at identical length scales, the initial growth rate of the PW morphology was 6 higher than that of the S
morphology due to the increased contact with the substrate. Additionally, transitioning S to PW droplets showed a rapid 2.8 increase in growth rate due to the change in wetting morphology and surface subcooling. The experimental results were corroborated with a thermal resistance-based droplet growth model and showed PW droplets had a 4-6 higher heat transfer rate than S droplets for the observed coalescence lengths. Based on these results, which showed the importance of droplet wetting morphology on individual droplet heat and mass transfer, we investigated the overall performance of the structured surface compared to a flat hydrophobic surface. Using droplet distribution theory combined with the droplet growth model, we showed that these nanostructured surfaces with PW morphologies had 56% total surface heat flux enhancement, while S morphologies had 71% heat flux degradation when compared to a flat hydrophobic surface. These results shed light on the previously unidentified importance of droplet wetting morphology for dropwise condensation heat and mass transfer on superhydrophobic nanostructured surfaces as well as the importance of designing Cassie stable nanostructured surfaces with tailored droplet morphologies to achieve enhanced heat and mass transfer during dropwise condensation.
METHODS
Fabrication Procedure of Silicon Nanopillars. Silicon nanopillar surfaces (Figure 1A) with diameters of
d = 300 nm, heights of h = 6.1 μm, and center-to-center spacings of l = 2 μm (solid fraction φ = πd2 / 4l2 =
0.0177 and roughness factor r = 1 + πdh’ / l2 = 3.26) were fabricated using e-beam lithography and deep
reactive ion etching. Chemical vapor deposition (CVD) of
(tridecafluoro-1,1,2,2-tetrahydrooctyl)-1-trichlorosilane was used to functionalize and create Cassie stable superhydrophobic surfaces (see section S2 of Supporting Information). The samples were first cleaned in a plasma cleaner (Harrick Plasma) for 20 minutes, then immediately placed in a vacuum chamber containing an open container of silane at room temperature and held at 17.5 kPa for 30 minutes. Upon removal from the chamber, the samples was rinsed in ethanol, DI water, and then dried with N2. Goniometric measurements on a smooth silanated silicon surface showed an advancing
and receding contact angle of θa = 119.2° ± 1.3° and θr = 86.1° ± 1.3°, respectively.
ESEM Imaging Procedure. Condensation nucleation and growth were studied on these fabricated surfaces
using an environmental scanning electron microscope (EVO 55 ESEM, Zeiss). Back scatter detection mode was used with a high gain. The water vapor pressure in the ESEM chamber was 1200 ± 12 Pa. The sample
temperature was set to 9 ± 1.5°C using a cold stage, resulting in nucleation of water droplets on the sample surface from the saturated water vapor. Typical image capture was obtained with a beam potential of 20 kV and variable probe current depending on the stage inclination angle. To limit droplet heating effects,26 probe
currents were maintained below 1.9 nA and the view area was kept above 400 μm 300 μm. A 500 μm lower aperture was used in series with a 1000 μm variable pressure upper aperture to obtain greater detail. The sample temperature was initially set to 10 ± 1.5 °C and was allowed to equilibrate for 5 minutes. The surface
temperature was subsequently decreased to 9 ± 1.5 °C resulting in nucleation of water droplets on the sample surface. Images and recordings were obtained at an inclination angle of 70 to 80 degrees from the horizontal to observe growth dynamics and wetting morphologies close to the droplet base. Recordings were obtained at 2.5 s time increments corresponding to 0.4 fps. Copper tape was used for mounting the sample to the cold stage to ensure good thermal contact.
Acknowledgement. The authors acknowledge Rong Yang and Professor Karen Gleason from the MIT
Chemical Engineering Department for help in performing iCVD on the smooth pillar samples. The authors acknowledge the support from the MIT S3TEC Center, an Energy Frontier Research Center funded by the Department of Energy, Office of Science, Office of Basic Energy Sciences. N. Miljkovic acknowledges funding support from the Natural Sciences and Engineering Research Council of Canada. R. Enright acknowledges support from the Irish Research Council for Science, Engineering, and Technology, cofunded by Marie Curie Actions under FP7. This work was performed in part at the Center for Nanoscale Systems (CNS), a member of the National Nanotechnology Infrastructure Network (NNIN), which is supported by the National Science Foundation under NSF award number ECS-0335765. CNS is part of Harvard University.
Supporting Information Available: Four videos showing all condensation processes, as well as further
information on data collection methodology, the energetically favored wetting state, dynamic droplet contact angles, suspended droplet pinning due to pillar scallops, droplet coalescence and removal, droplet growth modeling, transitioning droplet surface subcooling, and flat surface droplet growth. This material is available free of charge via the Internet at http://pubs.acs.org.
REFERENCES
1. Glicksman, L. R.; Hunt, A. W., Numerical Simulation of Dropwise Condensation. Int J Heat Mass
Tran 1972, 15, 2251-2269.
2. Love, J. C.; Estroff, L. A.; Kriebel, J. K.; Nuzzo, R. G.; Whitesides, G. M., Self-Assembled Monolayers of Thiolates on Metals as a Form of Nanotechnology. Chem Rev 2005, 105, 1103-1169. 3. Andrews, H. G.; Eccles, E. A.; Schofield, W. C. E.; Badyal, J. P. S., Three-Dimensional Hierarchical
Structures for Fog Harvesting. Langmuir 2011, 27, 3798-3802.
4. Leach, R. N.; Stevens, F.; Langford, S. C.; Dickinson, J. T., Dropwise Condensation: Experiments and Simulations of Nucleation and Growth of Water Drops in a Cooling System. Langmuir 2006, 22, 8864-8872.
5. Rykaczewski, K.; Scott, J. H. J.; Rajauria, S.; Chinn, J.; Chinn, A. M.; Jones, W., Three Dimensional Aspects of Droplet Coalescence During Dropwise Condensation on Superhydrophobic Surfaces. Soft
Matter 2011, 7, 8749-8752.
6. Milani, D.; Abbas, A.; Vassallo, A.; Chiesa, M.; Al Bakri, D., Evaluation of Using Thermoelectric Coolers in a Dehumidification System to Generate Freshwater From Ambient Air. Chem Eng Sci 2011, 66, 2491-2501.
7. Chen, X.; Wu, J.; Ma, R.; Hua, M.; Koratkar, N.; Yao, S.; Wang, Z., Nanograssed Micropyramidal Architectures for Continuous Dropwise Condensation. Adv Funct Mater 2011, 21, 4617–4623. 8. Schmidt, E.; Schurig, W.; Sellschopp, W., Versuche über die Kondensation von Wasserdampf in Film-
und Tropfenform. Forsch. Ingenieurwes 1930, 1, 53–63.
9. Dimitrakopoulos, P.; Higdon, J. J. L., On The Gravitational Displacement of Three-Dimensional Fluid Droplets From Inclined Solid Surfaces. J Fluid Mech 1999, 395, 181-209.
10. Kim, S.; Kim, K. J., Dropwise Condensation Modeling Suitable for Superhydrophobic Surfaces. J Heat
Transf 2011, 133, 081502-1 - 081502-7.
11. Kim, H. Y.; Lee, H. J.; Kang, B. H., Sliding of Liquid Drops Down an Inclined Solid Surface. J
Colloid Interf Sci 2002, 247, 372-380.
12. Narhe, R. D.; Khandkar, M. D.; Shelke, P. B.; Limaye, A. V.; Beysens, D. A., Condensation-Induced Jumping Water Drops. Phys Rev E 2009, 80, 031604-1 - 031604-5.
13. Boreyko, J. B.; Chen, C. H., Self-Propelled Dropwise Condensate on Superhydrophobic Surfaces. Phys
Rev Lett 2009, 103, 184501-1 - 184501-4.
14. Lafuma, A.; Quere, D., Superhydrophobic States. Nature Materials 2003, 2, 457-460.
15. Dietz, C.; Rykaczewski, K.; Fedorov, A. G.; Joshi, Y., Visualization of Droplet Departure on a Superhydrophobic Surface and Implications to Heat Transfer Enhancement During Dropwise Condensation. Appl Phys Lett 2010, 97, 033104-1 - 033104-3.
16. Graham, C.; Griffith, P., Drop Size Distributions and Heat Transfer in Dropwise Condensation. Int J
Heat Mass Tran 1973, 16, 337–346.
17. Rose, J. W., On the Mechanism of Dropwise Condensation. Int J Heat Mass Tran 1967, 10, 755-762. 18. Chen, C. H.; Cai, Q. J.; Tsai, C. L.; Chen, C. L.; Xiong, G. Y.; Yu, Y.; Ren, Z. F., Dropwise
Condensation on Superhydrophobic Surfaces With Two-Tier Roughness. Appl Phys Lett 2007, 90, 173108-1 - 173108-3.
19. Dietz, C.; Rykaczewski, K.; Fedorov, A.; Joshi, Y., ESEM Imaging of Condensation on a Nanostructured Superhydrophobic Surface. J Heat Trans-T Asme 2010, 132, 080904-1.
20. Varanasi, K. K.; Hsu, M.; Bhate, N.; Yang, W. S.; Deng, T., Spatial Control in the Heterogeneous Nucleation of Water. Appl Phys Lett 2009, 95, 094101-1 - 094101-3.
21. Miljkovic, N.; Enright, R.; Maroo, S. C.; Cho, H. J.; Wang, E. N., Liquid Evaporation on
Superhydrophobic and Superhydrophilic Nanostructured Surfaces. J Heat Transf 2011, 133, 080903-1. 22. Lau, K. K. S.; Bico, J.; Teo, K. B. K.; Chhowalla, M.; Amaratunga, G. A. J.; Milne, W. I.; McKinley,
G. H.; Gleason, K. K., Superhydrophobic Carbon Nanotube Forests. Nano Lett 2003, 3, 1701-1705. 23. Cassie, A. B. D.; Baxter, S., Wettability of Porous Surfaces Trans. Faraday Soc 1944, 40 546-551. 24. Wenzel, R. N., Resistance of Solid Surfaces to Wetting by Water. Ind. Eng. Chem. 1936, 28, 988-994. 25. Rykaczewski, K.; Scott, J. H. J., Methodology for Imaging Nano-to-Microscale Water Condensation
Dynamics on Complex Nanostructures. Acs Nano 2011, 5, 5962-5968.
26. Rykaczewski, K.; Scott, J. H. J.; Fedorov, A. G., Electron Beam Heating Effects During Environmental Scanning Electron Microscopy Imaging of Water Condensation on Superhydrophobic Surfaces. Appl
Phys Lett 2011, 98, 093106-1 - 093106-3.
27. Cao, P. G.; Xu, K.; Varghese, J. O.; Heath, J. R., The Microscopic Structure of Adsorbed Water on Hydrophobic Surfaces under Ambient Conditions. Nano Lett 2011, 11, 5581-5586.
28. Anand, S.; Son, S. Y., Sub-Micrometer Dropwise Condensation Under Superheated and Rarefied Vapor Condition. Langmuir 2010, 26, 17100-17110.
29. Varanasi, K. K.; Deng, T., Controlling Nucleation and Growth of Water Using Hybrid Hydrophobic-Hydrophilic Surfaces. In 12th Ieee Intersociety Conference on Thermal and Thermomechanical
Phenomena in Electronic Systems, Los Vegas, NV, 2010; pp 1-5.
30. Rykaczewski, K.; Chinn, J.; Walker, M. L.; Scott, J. H. J.; Chinn, A.; Jones, W., Dynamics of Nanoparticle Self-Assembly into Superhydrophobic Liquid Marbles During Water Condensation. Acs
Nano 2011, 5, 9746–9754.
31. Moulinet, S.; Bartolo, D., Life and Death of a Fakir Droplet: Impalement Transitions on Superhydrophobic Surfaces. Eur Phys J E 2007, 24, 251-260.
32. Tanaka, H.; Tsuruta, T., A Microscopic Study of Dropwise Condensation. Int J Heat Mass Tran 1984, 27, 327-335.
33. Tam, D.; von Arnim, V.; McKinley, G. H.; Hosoi, A. E., Marangoni Convection in Droplets on Superhydrophobic Surfaces. J Fluid Mech 2009, 624, 101-123.
34. Umur, A.; Griffith, P., Mechanism of Dropwise Condensation. J Heat Transf 1965, 87, 275–282. 35. Mikic, B. B., On Mechanism of Dropwise Condensation. Int J Heat Mass Tran 1969, 12, 1311-1323. 36. Narhe, R. D.; Beysens, D. A., Nucleation and Growth on a Superhydrophobic Grooved Surface. Phys
Rev Lett 2004, 93, 076103-1 - 076103-4.
37. Narhe, R. D.; Beysens, D. A., Water Condensation on a Super-Hydrophobic Spike Surface. Europhys
Lett 2006, 75, 98-104.
38. Narhe, R. D.; Gonzalez-Vinas, W.; Beysens, D. A., Water Condensation on Zinc Surfaces Treated by Chemical Bath Deposition. Appl Surf Sci 2010, 256, 4930-4933.
39. Beysens, D., Dew Nucleation and Growth. Cr Phys 2006, 7, 1082-1100.
40. Beysens, D.; Steyer, A.; Guenoun, P.; Fritter, D.; Knobler, C. M., How Does Dew Form. Phase Transit 1991, 31, 219-246.
41. Fritter, D.; Knobler, C. M.; Beysens, D. A., Experiments and Simulation of The Growth of Droplets on a Surface (Breath Figures). Phys Rev A 1991, 43, 2858-2869.
42. Steyer, A.; Guenoun, P.; Beysens, D.; Knobler, C. M., Growth of Droplets on a Substrate by Diffusion and Coalescence. Phys Rev A 1991, 44, 8271-8277.
43. Hirth, J. P.; Pound, G. M., Condensation and Evaporation. Macmillan: New York,, 1963; p xvi, 191 p. (p. 191 advertisement).
44. Kaschiev, D., Nucleation: Basic Theory With Applications. Butterworth Heinemann: Oxford, 2000.
Figure 1. (A) Scanning electron micrograph (SEM) of an array of equidistant superhydrophobic silicon
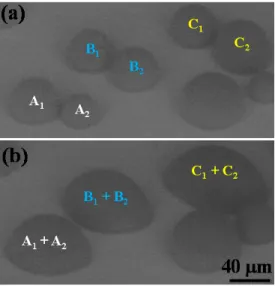
nanopillars with diameters, heights, and spacings of d = 300 nm, h = 6.1 μm, and l = 2 μm, respectively. Nanoscale scallop features exist on the pillar sidewalls due to the DRIE fabrication process. (B) Environmental scanning electron micrograph (ESEM) of water condensation on (A) showing both partially wetting (PW) and
suspended (S) droplets (P = 1200 ± 12 Pa, Ts = 282 ± 1.5 K). See Supporting Information, VideoS1. (C) Time
lapse images of condensation captured via ESEM showing the difference in growth behavior between PW and S droplets. Droplets A, B, C, and D are in the PW state, whereas E and F are in the S state. See Supporting Information, VideoS2.
Figure 2. Time evolution of the average droplet diameter (〈2R〉). (A) For the PW droplet, at early stages (〈2R〉 < 12 μm) the rapid growth is due to good thermal contact between the droplet base and the substrate (Ts).
Inset: ESEM image of a PW droplet. (B) The S droplet has a slower growth rate than the PW droplet due to poor thermal contact between the base and substrate. At later stages (〈2R〉 ≥ 12 μm), the S and PW growth rates converge due to the dominant conduction thermal resistance of the droplet (Rd). Inset: ESEM image of a S
droplet. Experimental data (black circles) were obtained from ESEM video (P = 1200 ± 12 Pa, Ts = 282 ± 1.5 K)
(see Supporting Information, VideoS1 and S2). The theoretical prediction (red line) was obtained from the droplet growth model (for model derivation and parameters see section S6 of Supporting Information). (C) PW and S droplet model schematics and thermal resistance diagram showing the liquid-vapor interface (Ri), droplet
conduction (Rd), hydrophobic coating (Rhc), pillar (Rp) and gap (Rg) thermal resistances.
C
θ
PWT
satR(t)
T
sδ
HCh
Liquid Vaporh
iθ
ST
satR(t)
δ
HCT
sh
T
s’ Liquidh
iPW
S
Tsat Ti Ri Tb1 Rd Rg Rhc Rp Rhc Ts Tb2 Tb3q
Figure 3. (A) Time lapse images of S to PW droplet transitions captured via ESEM showing the difference in
growth behavior. Droplets A and B transition from the S to PW state, while droplet C remains in the S state throughout (see Supporting Information, VideoS3). (B) Time evolution of the average droplet diameter (〈2R〉) for droplets A, B and C. Initially (t < 75 s), all three droplets grow in the S state. Upon transition (t = 75 s), the growth rates of droplets A and B rapidly increased due to better thermal contact between the base of the droplet and the substrate. Additionally, subcooling due to a constriction resistance between the pillars (Ts
Ts’ = 0.044 K) contributes to the growth behavior after transition. Experimental data (symbols) were obtained
using ESEM (P = 1200 Pa, Ts = 282 ± 1.5 K). Theoretical results were obtained using the droplet growth model
of S droplets (solid red line) and PW droplets (dotted red line). For model derivation see section S6 of Supporting Information.
t [s]
2R
[
m]
5 6 7 8 10
20
30 40 50 70 100
5
6
7
8
10
20
30
40
S Model
PW Model
A - Experiment
B - Experiment
C - Experiment
B
Figure 4. Individual droplet heat transfer ratio of PW to S droplets as a function of coalescence length, lc. The
PW droplets were 4-6 as effective as S droplets at heat removal during the dropwise condensation process due to better thermal contact between the droplet base and substrate. The large contact angle of both droplet morphologies results in small pinning forces at the contact line, allowing for coalescence-induced droplet shedding at coalescence lengths of 10 ± 2 μm. Heat transfer ratio data (black circles) was obtained from droplet growth experiments (Figure 2). Theoretical results (blue line) were obtained using the droplet growth model (see section S6 of Supporting Information). Inset: Schematic defining coalescence length.
l
c
[m]
q
PW
/ q
S
6
8
10
12
14
16
18
20
2
2.4
2.8
3.2
3.6
4
4.4
4.8
5.2
5.6
6
Model
Experiment
l
c
Figure 5. Theoretical steady state overall surface heat flux (q”) versus temperature difference (∆T) for surfaces
having distinct PW, S (h = 6.1 µm, l = 2 µm, d = 300 nm, φ = 0.0177), and F droplet morphologies. Model results were obtained by using droplet distribution theory with the developed droplet growth model (Equation 13). Dotted lines represent error bounds associated with uncertainty in the coalescence length, lc. Model
parameters: P = 4 kPa, lc,PW = lc,S = 10 ± 2 µm, lc,F = 28 ± 7 µm. When compared to the flat surface, there is an
average 56% heat flux enhancement for the PW morphology, and an average 71% heat flux degradation for the S morphology. S PW F
T [K]
q"
[k
W
/m
2
]
0
2
4
6
8
10 12 14 16 18 20
0
40
80
120
160
200
240
280
320
q"
S
q"
PW
q"
F
Figure 6. Theoretical heat flux ratio (q”PW/q”F) of a surface favoring PW droplet formation (q”PW) compared to
a flat hydrophobic surface (q”F) as a function of coalescence length (lc) and pillar height (h). lc = 2Re = 2Ȓ for
the PW surface, and lc = 2Re = 28 ± 7 µm for the F surface. As expected, the heat flux ratio increases as h
decreases due to the diminishing P-C-G thermal resistance. In addition, reducing lc acts to increase the heat
transfer ratio due to earlier droplet removal from the surface and higher population of small droplets.23 Inset:
Heat flux ratio (q”PW/q”F) as a function of h for the experimentally measured coalescence length, lc = 10 ± 2μm.
h [m]
q"
PW
/ q
"
F
0.1 0.2
0.5
1
2 3 4 5 7 10
1
1.5
2
2.5
l
c
[
m]
q"
PW
/ q"
F
3
6
9
12
15
18
21
24
27
30
0
1
2
3
4
5
h = 10
m
h = 1
m
h = 100 nm
l
ch
l
c= 10 μm
Supporting Information
Effect of Droplet Morphology on Growth Dynamics and Heat Transfer during Condensation on Superhydrophobic Nanostructured Surfaces
Nenad Miljkovic,† Ryan Enright,†,‡ and Evelyn N. Wang†,*
†Department of Mechanical Engineering, Massachusetts Institute of Technology,
77 Massachusetts Avenue, Cambridge, Massachusetts 02139, USA
‡Stokes Institute, University of Limerick, Limerick, Ireland
*Address correspondence to enwang@mit.edu
S1. ESEM VIDEOS
VideoS1. Condensation on the superhydrophobic silicon nanopillar surface (l = 2 µm, h = 6.1 µm, d = 300 nm)
captured with ESEM. Droplet removal via coalescence-induced ejection was observed towards the end of the video once droplets reached a size large enough to begin coalescing. The video was captured at 0.4 fps and is played back at 1.6 fps. The field of view is 266 µm x 133 µm.
VideoS2. Magnified view of condensation on the superhydrophobic silicon nanopillar surface (l = 2 µm, h = 6.1
µm, d = 300 nm) captured with ESEM. The video was captured at 0.4 fps and is played back at 1.6 fps. The field of view is 62 µm x 57 µm.
VideoS3. Suspended (S) to partially-wetting (PW) droplet transitioning during condensation on the
superhydrophobic silicon nanopillar surface (l = 2 µm, h = 6.1 µm, d = 300 nm) captured with ESEM. The video was captured at 0.4 fps and is played back at 1.6 fps. The field of view is 75 µm x 70 µm.
VideoS4. Condensation on the hydrophobic flat silicon captured with ESEM. The video was captured at 0.33
fps and is played back at 0.33 fps. The field of view is 300 µm x 225 µm.
Data Collection: The average droplet radius (Figures 2 and 3) is defined as the radius measured in each video
frame during the condensation process. Because droplets vary in initial size once condensation begins, the growth data was normalized with respect to the droplet radius. The droplet radius as a function of time (each frame) was recorded for all clearly visible droplets during condensation (13 PW droplets and 16 S droplets). Once the radius as a function of time was obtained, the droplets were ordered and averaged in terms of size, i.e. a droplet that began growth with an initial radius of 5 µm was only averaged with other droplets once they reached a radius of 5 µm and above. The growth rate of new nucleating droplets (above radii of 5 µm) showed good agreement with the growth rate of droplets growing from initial radii of 5 µm, which indicates that this method is appropriate.
S2. ENERGETICALLY FAVORED WETTING STATE
The distinct growth behavior in Figure 1B for can be explained using an energy approach. The relevant energy barrier dictating whether or not the contact line will de-pin is approximated by considering the energy required for the liquid to advance through a unit cell of a structured surface.1 The result of such an analysis is
angle, cos 1.2 An energy-based criterion can then be defined to delineate the expected droplet morphology given by ∗ cos cos 1 cos . (S1)
When ∗ 1 the contact line near the base of the pillars can overcome the energy barrier to de-pin and a
Wenzel droplet is formed. If ∗ 1 complete de-pinning is not possible and the droplet spreads over the top of
the pillar array forming a nominally Cassie droplet when ≫ . This interpretation is consistent with the behavior observed in Figure 1C where, after accounting for the scallop features on the pillar sides as ′
/2 ,3 ∗ 0.63.
S3. DROPLET WETTING MORPHOLOGY AND CONTACT ANGLES
Wetting Morphology
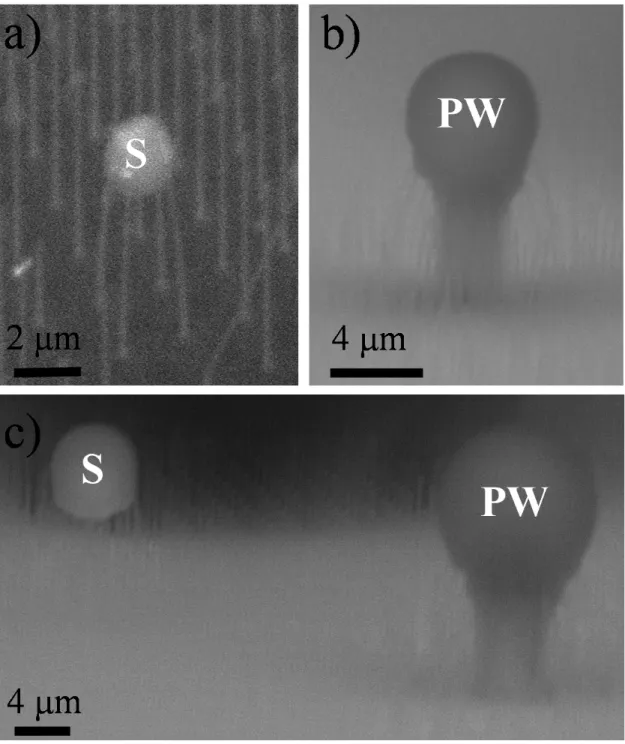
To confirm the wetting state of the S and PW wetting morphologies, higher magnification ESEM imaging was performed. The beam potential was kept constant at 20 kV while the probe current was reduced to 1.2 nA to minimize electron beam heating effects.4 The results of the imaging (Figure S1) indeed show PW droplets form
a liquid bridge connecting the base of the droplet and substrate, whereas S droplets form on the tips of pillars and are not substantially impaled by the pillars.
The droplet does not substantially penetrate into the pillars5 for the S morphology due to the flat tips and scallop
Figure S1. High magnification ESEM images of the S and PW droplet wetting morphologies performed at a
beam potential of 20 kV and probe current of 1.2 nA. Condensation conditions: P = 1200 ± 12 Pa, Ts = 282 ±
1.5 K. a) Initial formation of an S droplet. The droplet forms on a pillar tip, and grows across neighboring pillars remaining in the suspended state throughout. Adjacent pillars bend slightly due to surface tension6-9 created by
droplet receding (due to ESEM beam induced droplet evaporation). b) High magnification image of a PW droplet. A liquid bridge connecting the droplet to the substrate is observed below the droplet base. c) Adjacent S and PW droplet at very early stages of growth. The pillar tips are visible in the center of the image, as well as at the contact line of the S droplet, indicating the droplet is indeed suspended on the pillar tips, and is not appreciably impaled by the pillars.
Contact Angles
ESEM images of water droplets show high topographic contrast such that reliable contact angle measurements can be made.10 Droplet contact angles were determined from frame by frame analysis of condensation videos
(including VideoS1 and S2). Contact angles were determined by fitting a circle to each individual droplet (spherical approximation) and determining the slope of the tangent where the droplet neck intersects the fitted circle. This approach led to larger errors for S droplets due to the difficulty in determining where the base of the droplet intersects the fitted circle. Figure S2 shows the contact angle as a function of droplet diameter. The PW droplet morphology showed an initially varying contact angle (〈2R〉 ≤ 27 µm) due to local pinning of the droplet contact line until the advancing contact angle was reached 〈2R〉 ≈ 27 µm. This observation is consistent with previous studies of the PW droplet morphology.11, 12 At long times, both droplet morphologies have a similar
contact angle, characteristic of the Cassie-Baxter wetting mode. Note that at long times/large droplet sizes (in the absence of coalescence and gravity), we expect the apparent contact angle to approach that of the advancing Cassie angle → 180°.2
Figure S2. Droplet contact angle as a function of droplet diameter. (a) For the PW morphology, the model fit
(blue line) is defined as 85° 5.82 ° for 〈2R〉 ≤ 27 µm, and 164° for 〈2R〉 > 27 µm. (b) For the S morphology, the model fit (black line) is defined as 164° for all droplet radii. Red symbols represent experimental data obtained from ESEM analysis. Experimental contact angle error was determined by varying the possible droplet base location for the circle fitting method. Droplet diameter error bars are within the symbol size.
S4. SUSPENDED DROPLET PINNING DUE TO PILLAR SCALLOPS
To validate the idea that S droplet formation is due to the presence of scallop features on the pillar sides that act to pin the contact line, additional ESEM condensation experiments were performed on samples having smooth pillars. In contrast to the scalloped pillar samples, droplet transitioning on smooth pillars should occur more readily due to the lack of pinning points created by the scallops.
The smooth-pillar geometry was defined by pillar diameter, center-to-center spacing and height of d = 700 nm,
l = 4.2 µm, and h = 10 µm, respectively. The solid fraction /4 0.022 is similar to that of the scalloped pillar sample ( 0.0177 . The pillar pattern was created by e-beam lithography and then deep reactive ion etching (DRIE). The samples were thermally oxidized and then immersed in buffered HF to reduce
(a)
Droplet Diameter 2R [m] Co nt ac t A ng le PW [ ] 5 10 15 20 25 30 35 40 45 50 100 110 120 130 140 150 160 170 180 Model Fit Experiment(b)
Droplet Diameter 2R [m] Co nt ac t An gl e S [ ] 10 14 18 22 26 30 34 38 42 46 50 96 108 120 132 144 156 168 180 Model Fit, S = 164 6 Experimentthe prominence of the scallops. The samples were then coated with ~ 50 nm of PFDA (θa = 121.1°±2.2°) using
initiated chemical vapor deposition (iCVD).
Condensation on the smooth pillar surface resulted in similar (randomly distributed) nucleation behavior as the scalloped pillar surface. Condensing droplets formed both S and PW morphologies. In contrast to the scalloped pillar surface, the number of droplets that underwent transition from the S to PW wetting morphology greatly increased (Figures S3 and S4). This result supports our assumption that the pillar scallops play an important role in pinning the S droplet contact line and hinder transition to the PW wetting morphology.
Figure S3. ESEM image of droplet growth on a smooth nanopillar surface for two consecutive image frames
(a) t = 0 seconds, and (b) t = 80 seconds. Red dashed circles show S droplets prior to transition. Blue dashed circles show S droplets that underwent successful transition to the PW state. The frequency of transition for the smooth-pillar surface is higher than that of the scalloped-pillar surface, supporting the assumption that the pillar scallops play an important role in pinning the S droplet contact line and hinder transition to the PW wetting morphology.
Figure S4. Close up ESEM images of droplet growth on a smooth nanopillar surface for three consecutive
image frames (a) t = 0 seconds, (b) t = 80 seconds and (c) t = 160 seconds. Red dashed circles show S droplets prior to transition, and blue dashed circles show S droplets that underwent transition to the PW wetting morphology. As in the scalloped pillar case, droplets nucleating on the tops of pillars remain pinned in the S state throughout. Ensuring smoothness of the nanostructure does not guarantee droplet transitioning for all S drops. However, it does indicate that the energy barrier for transition is reduced.
S5. DROPLET COALESCENCE AND REMOVAL
Nanostructured Surface
During the condensation process, droplet removal via coalescence-induced jumping13, 14 was observed (see
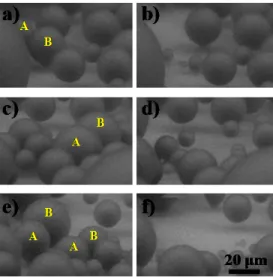
VideoS1). The spontaneous out of plane droplet motion occurs due to the surface energy released during droplet coalescence (Figure S5). Analysis of ESEM data showed a nucleation density of N = 3.14x10⁹ m-2. The
measured average coalescence length was 11.2 µm with a standard deviation of 2.94 µm. The rms length predicted by a randomly distributed Poisson distribution,15, 16 l
c = 1/(πN)0.5 ≈ 1/(4N)0.5, was 10.07 µm, which is
within one standard deviation of the experimentally measured average. Therefore, the average droplet coalescence diameter at steady state was assumed to be lc = 10 ± 2 μm, which is 30 smaller than the droplet
capillary length. Both PW and S droplets were observed to undergo coalescence-induced jumping, which suggests that the contact line pinning force for both droplet morphologies is below the critical threshold for jumping.
Figure S5. Coalescence-induced droplet shedding at three separate locations. Images a), c) and e) show the
condensing droplet surfaces prior to coalescence, while images b), d) and f) show the corresponding surfaces after coalescence and ejection. Labels A and B denote the coalescing droplets. For clarity and ease of observation, the three cases shown are all large droplet diameter coalescence events exceeding the average coalescence diameter of 10 ± 2 μm.
Flat Surface
During the condensation process on the smooth surface, droplet removal via coalescence-induced jumping13, 14
was not observed (see VideoS4), instead growth due to direct accommodation of vapor molecules and coalescence dominated (Figure S6). Analysis of ESEM data showed a nucleation density of N = 3.42x10⁸ m-2.
The measured average coalescence length was 28.7 µm with a standard deviation of 7.06 µm. The large error associated with the measured initial coalescence length on the flat surface was due to the non-uniformity from spot to spot on the flat sample. The rms length predicted by a random Poisson distribution,15, 16 l
c = 1/(πN)0.5 ≈
1/(4N)0.5, was 30.51 µm, which is within one standard deviation of the experimentally measured average.
Figure S6. Droplet coalescence on the flat hydrophobic surface for 3 separate droplet pairs (a) immediately
before and (b) immediately after coalescence. The droplets do not undergo coalescence induced droplet ejection on the flat surface due to larger contact line pinning to the substrate. As a result, droplets continue to grow past the coalescence length by direct vapor accommodation and further coalescence with neighbors. The average coalescence length for F droplets was lc = Re = 28 ± 7 μm.
S6. DROPLET GROWTH MODELING
The predicted growth of each droplet (PW and S) was obtained by modifying the model originally developed by Umur and Griffith17 to account for the pillar geometry and the details of the surface wetting. At the scales
considered in this work (~ 10-6 m), the dominant mode of droplet growth is due to the direct accommodation of
vapor molecules at the droplet interface.18 For a droplet with radius R(t) on a structured superhydrophobic
surface, as shown in Figure S7(a), the droplet contact angle θ varies with the droplet radius according to the fit given in Figure S1. The local vapor (Tsat) and surface (Ts) temperatures are assumed to be constant throughout
the growth process. The droplet heat transfer, q, is determined by considering all thermal resistances from the saturated vapor through the condensing droplet to the substrate (Figure S7(b)). All thermal resistances associated with the droplet are presented in terms of individual temperature drops: the liquid-vapor interfacial resistance due to direct vapor molecule accommodation at the droplet interface (ΔTi), the conduction resistance
through the droplet (ΔTd), the conduction resistance through the pillars (ΔTP,S) or liquid bridge and pillars
(ΔTP,PW), the hydrophobic coating resistance (ΔTHC), and the resistance due to the curvature of the droplet (ΔTC).
Internal droplet convection was neglected in the model since the droplets were sufficiently small so that conduction is the primary mode of heat transfer through the droplet.19, 20 This assumption was validated by
calculating the characteristic Rayleigh, ∆ / ≅ 1.5 10 ≪ 1 and Marangoni, ∆ / / ≅ 0.16 1 numbers.
Figure S7. (a) Schematic of the droplet on the condensing surface growing in the S morphology. (b) Droplet
thermal resistance diagram showing the liquid-vapor interface (Ri), droplet conduction (Rd), hydrophobic
coating (Rhc), pillar (Rp), and gap (Rg) thermal resistances.
The temperature drop is due to droplet curvature (ΔTC) given by21
∆
,
(S2)
where Tsat is the water vapor saturation temperature, σ is the water surface tension, hfg is the latent heat of
vaporization, and ρw is the liquid water density.
The temperature drop between the saturated vapor and liquid interface (ΔTi) is given by
∆
,
(S3)
where q is the heat transfer rate through the droplet and hi is the condensation interfacial heat transfer coefficient
given by17, 22
,
(S4)where Rg is the specific gas constant and νg is the water vapor specific volume. The condensation coefficient, α,
is the ratio of vapor molecules that will be captured by the liquid phase to the total number of vapor molecules reaching the liquid surface (ranging from 0 to 1). We assume α = 0.9, which is appropriate for clean
environments such as the ESEM,21 but in fact the model results were not sensitive to the condensation
coefficient ranging from 0.1 to 1 in this study.
θ
T
satR(t)
δHCT
s hT
s’T
i, h
iT
b1T
b2Droplet
Hydrophobic
Coating
Substrate
Pillars
(b)
T
satT
iR
iT
b1R
dR
gR
hcR
pR
hcT
sT
b2T
b3q
(a)
Once heat is transferred to the droplet interface, it must conduct through the droplet to the base. This resistance is modeled as a pure conduction resistance which leads to a droplet conduction temperature drop (ΔTd) given
by23
∆
,
(S5)
where Tb1 is the liquid temperature of the droplet base and kw is the condensed water thermal conductivity. The
temperature drop due to the hydrophobic coating is calculated using a conduction resistance given by
∆
,
(S6)
where Tb2 is the temperature of the silicon pillars beneath the hydrophobic coating, δHC is the hydrophobic
coating thickness (δHC = 1 nm), φ is the structured surface solid fraction (φ = 0.0177), and kHC is the coating
thermal conductivity (kHC = 0.2 W/mK).
The conduction resistance through the pillars is dependent on the wetting morphology of the droplet. For the S morphology, the temperature drop associated with the conduction resistance is given by
∆ ,
,
(S7)
where Ts is the substrate temperature, h is the pillar height (h = 6.1 μm), and kP is the pillar thermal conductivity
(kP = 150 W/mK).
Figure S7. Heat transfer resistance network in the droplet and pillar structure. The schematic outlines the
parallel path of heat flowing through i) the hydrophobic coating (Rhc) followed by the pillar (Rp) and ii) the
liquid bridge (Rg) followed by the hydrophobic coating (Rhc). Schematic is not to scale.
For PW droplets, the conduction resistance temperature drop through the pillar and coating structure is calculated by considering a parallel heat transfer pathway from the base of the droplet to the substrate surface (Figure S8) given by
∆
.
(S8)
It is important to note that the PW conduction temperature drop given by Equation S7 becomes the S temperature drop when kw = 0 W/mK. In this case, there is no liquid bridge available for heat flow.
Accounting for all of the temperature drops, the heat transfer rate is
∆
.
(S9)
In addition, the droplet heat transfer is related to the droplet growth rate (dR/dt) by
1 cos 2 cos
.
(S10)
Equating S8 and S9, the growth rate is
∆
.
(S11)
Equation S11 was numerically discretized such that a numerical solution for the droplet radius as a function of time can be obtained as
∆ ∆
∆
.
(S12)
To obtain sufficient accuracy and resolution, the time step used in the numerical simulation was Δt = 0.01 s. Material properties were obtained using NIST software (REFPROP) such that all input parameters used were temperature dependent.
It is important to note, while θPW varies as a function of time t (i.e., θPW is a function of R(t)), in this study it is
treated as a constant in the volume derivative / (E.10) due to the slowly varying nature of / . To determine the error associated with this approximation, we determined the error associated with this approximation.
3 1 cos 2 2 cos 3
(S13)
3
3
3 2 1 cos sin 2 cos sin 1 cos 3 1 cos 2 cos
3 2 2 cos 2 cos 1 cos sin 3 1 cos 2 cos
3 3 3 cos sin 3 1 cos 2 cos
1 cos sin 1 cos 2 cos
(S14)
The second term in the brackets (Equation S14) is the solution of / assuming a constant θ (Equation S10). The first term in the brackets is neglected in Equation S10 and is justified by the following
∆ 1 cos
2 sin
1 cos 2 2 cos ≅ 0.0158 1.58 %
(S15)
where ∆ is the average percent deviation from the constant contact angle approximation (Equation S10). ∆ = 0 for S or F droplet morphologies, as well as PW droplets larger than R = 12.5 µm because θS, θF and θPW (R >
12.5 µm) are constant.
S7. TRANSITIONING DROPLET SURFACE SUBCOOLING
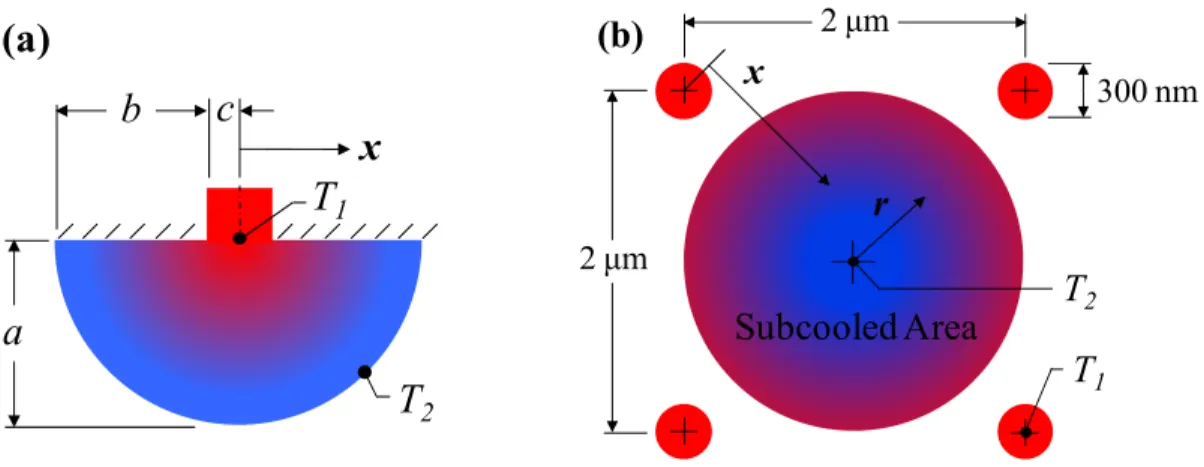
Previous experimental studies have shown large surface temperature non-uniformities during dropwise condensation due to a constriction thermal resistance at the base of the droplet.24-28 Crowding of heat flow lines
at the base creates a thermal contact resistance similar to that between two touching solids. This resistance is amplified for S droplets on a structured pillar surface with a relatively low solid fraction, φ (as is the case here, φ = 0.0177), since heat transferred through the droplet base must conduct through the low area pillar structure. To determine the magnitude of surface subcooling (T1 – T2) between pillars, the thermal contact resistance was