(\O~ '-a
\cN
ON AIRFOIL CHARACTERISTICS
uNri.r-s
NOy 19 1927
LIBR\A5Pby
James S. McDonnell,
Jr.
B.S., Princeton University, 1921
and
Constantine L. Zakhartchenko
Graduate,- Russian Naval Academy, 1920
Submitted in Partial Fulfillment of the Requirement
For the Degree of
Master of Science in Aeronautical Engineering.
Signatures of Authors:
Signature Redacted
Signature Redacted
Certified by:
Signature Redacted
Department of
AeronautiCal
Engineering
September 1, 1923.
THE EFFECT OF BIPLANE COUBINATION
MITLibraries
77 Massachusetts Avenue
Cambridge, MA 02139 http://libraries.mit.edu/ask
DISCLAIMER NOTICE
Due to the condition of the original material, there are unavoidable
flaws in this reproduction. We have made every effort possible to
provide you with the best copy available.
Thank you.
The images contained in this document are of the
best quality available.
Cambridge, Massachusetts
September
1,
1923.
Professor
I.
L. Merrill,
Secretary of the Faculty,
Massachusetts Institute of Technology.
Dear Sir:
In accordance with the requirement for the
degree
of Master of
Science in Aeronautical
&ngineer-ing, we submit herewith a thesis entitled "The Effect
of Biplane Combinations on Airfoil Characteristicsu.
We wish to express our appreciation to
Professor ]. P. Warner for his cooperation in the
de-velopment of this research.
Respectfully submitted,
Signature Redacted
Signature Redacted
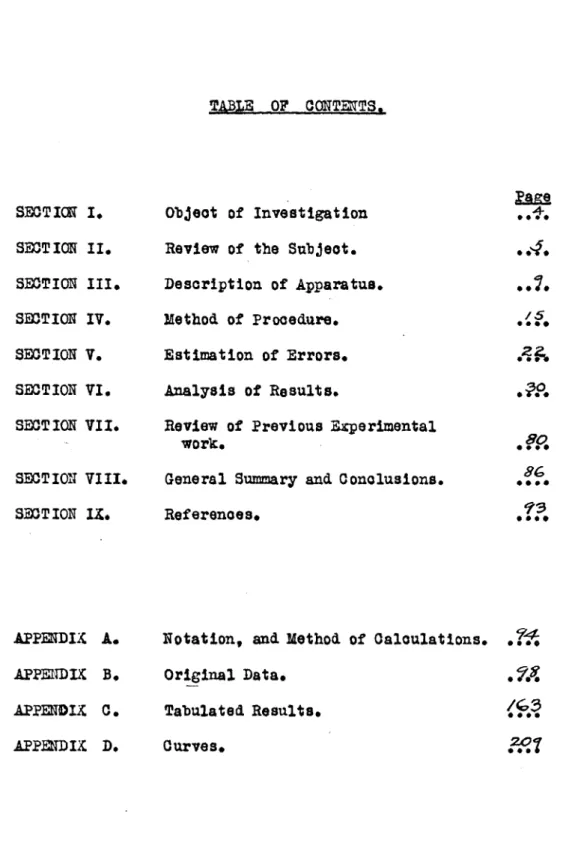
TABLE OF C0NTETS.
Object of Investigation
Review of the Subject. Description of Apparatus.
Method of Procedure. Estimation of Errors.
Analysis of Results.
Review of Previous Experimental work.
General Summary and Conclusions.
References.
APPEDIX A. APPENDIX B.
APPENDIX G. APPENDIX D.
Notation, and Method of Calculations. .I*
Original Data. . VA.
Tabulated Results. *0.0 Curves. SECTICiK SECT ION SECTION SECTION SECTION SECTION SECTION SECT ION SECTION I. II. III. Iv.
V.
VI.
VII.
VIII. Iz... g.
4-.. 0. .. 7. 60 *.ea . 0.0.TABLE OF C ONTEITS -Continued
-SUBJB3 T MATTER
The biplane structure.
Biplane mounted in wind tunnel.
FIGURE 1. PLATES Plates 1-2. Plates 3-4 Plate 4a. Plates 5-12 Plates 13-14 Plate 15. TABLES Tables 1-33. Tables 34. Balance crosshead.
Curves of Le, D , L/D, and M for U.S.A. 27 and Gt. 387 monoplanes. Curves of effective strut resistance. Curves of Le, Ds, L/D, Me, and C.?. for
U.S.A. 27 and Got. 387 biplanes
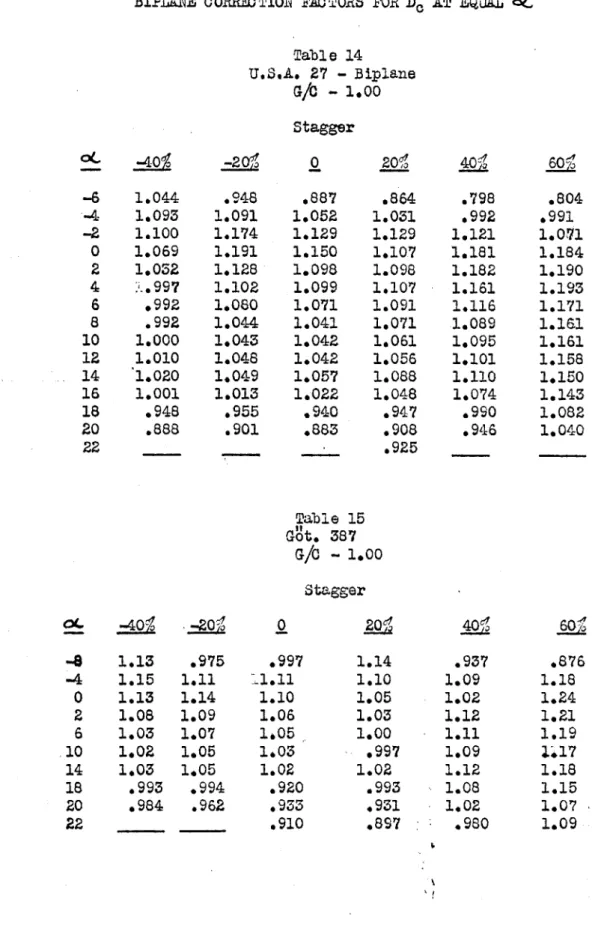
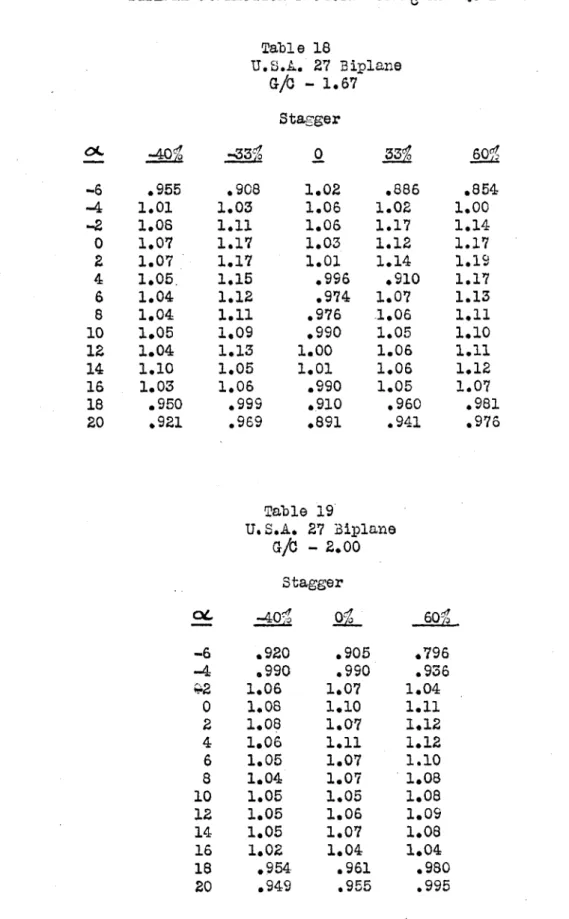
Curves of biplane correction factors,
oC required to produce equal lifts at
various staggers
Biplane correction factors at equal Loading on upper and lower wings
Tables 35-46 Lc-,Y D, L/412, I0, and4 C.P. for U.S.A.- i-and Cot, 387 biplanes
Tables 35-76 Lc, Dc, L/, Mc, and C.P. for U.S.A. 27 and Got. 387 biplanes (Appen. C.)
Comparison of Theoretical and Experi-mental Biplane Values
For:
-Tables 77-80 Lift and Drag on upper wing
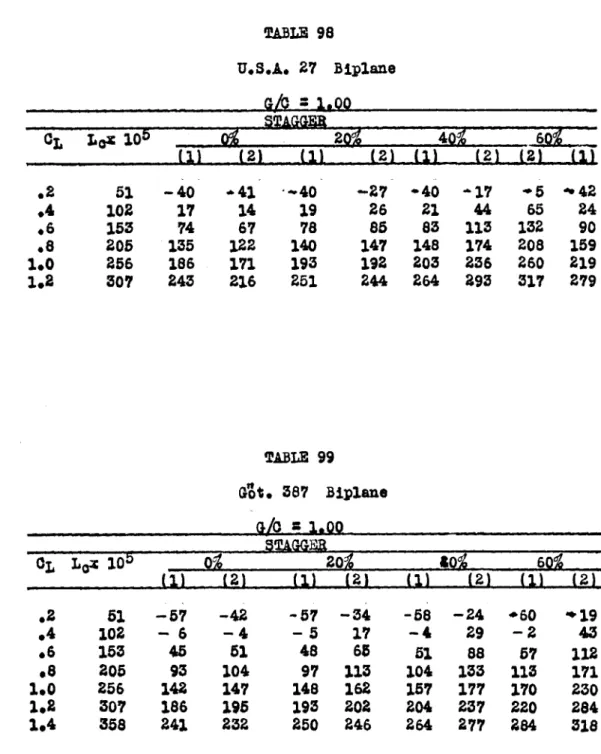
Tables 81 Lift coefficient Tables 82-85 Angle of Attack Tables 86-88 Drag Coefficient Tables 98-99 Moment Coefficient
Tables 104-107 Center of Pressure Coefficient
Biplane Correction Factors (Appen. C.) For:
-Tables 89-92 D at equal Lo Tables 93 D minimum
Tables 94-95 LA maximum
Tables 95a Lc maximum
Tables 96-97 L/D at equal Lc Tables 100-103 Mc at equal Lc Tables 108-109 0.P. at equal Le PHOTOGRAPHS Photo 1. Photo 2. Page s /0 /2-/3 207-.2/7 11- 2 6/ /6* -/7? /81- /'6 -4:-4
Z_&
75-78 20 zez.zoG,
20A 2OM .~ 204.
Section
I.
OBJET OF EIESTIGATICH
The object of this investigation is to make
a complete test in the wind tunnel of a large njniber
of biplane combinations having different proportions
of
stagger and gap/ohord ratio, to derive a thoroughly
accurate and systematic set of biplane correction
fac-tors from the results so obtainedand to verify the
accuracy of the formulae from
Munk's
"General Biplane
Theory" (ref. 9) by calculating corresponding results
S
SELTIOI II.
REVIEW _0F THE SUBJMT
The effects of biplane combinations on the aerodynamic
characteris-tics of airfoils have been known in a general way for several years, but such iowledge as exists is based on scanty experimental data and on a
theory which still lacks that exactitude of prediction necessary to win for it the authority of physical law. We shall revieav the theoretical and
experimental sourmes of this knowledge in turn.
From the theoretical standpoint the effects of biplane combinations
are bound up with the whole aerodynamical theory of airfoils. The only
general theory dealing with the subject is the voxtex theory, which
Lai-chester in England first boldly applied as an explanation of the lift of
wings, over twenty years ago, and by which he worked out a fairly complete
descrip tive account of the mechanism. Kutta in Germany and Joukowsky in
Russia developed the mathematical details of the circulation for wings of
infinite aspect ratio, i.e., of negligible end-effect. Then the whole
school of German aerodynamicists, headed by Prandtl, took up the further theory of the effects caused by the trailing vortices, usually embodying
their cogi tations.in exact mathematical language. In 1922, ]unk, (ref. 1) also of the German school, made a quitt complete application of the theory
to biplanes, the previous work having been more or less restricted to
mon-oplanes. The result is we now have a truly physical theory of the
aero-dynamics of airfoils, expressed in exact mathematical form, and capable of maldng some quite good predictions.
But although this theory is invaluable for the ;ay in which it
illu-minates part of the mechanism behind the phenomena, it is still embryonic;
6
yet be worked out in greater detail before it will be adequate for
obtain-ing exact numerical information. For instance, good agreenent between
theoret ical and experimental values is restricted to about 80 of the
or-dinary flying range. The theory cannot predict maximum lift, or the
fly-ing range; and although the mechanism of the induced drag has been
care-fully worked out, that of the renaining part of the drag has not been
elucidated with the same definiteness. In short, few calculations from
the theory are now capable of being used as a routine method in the design
room and drawing office.
On the Other hand when we examine the empirical knowledge by which
the airplane designer might predict the aerodynamical obefficients of
bi-planes, our satisfaction is not much greater. The only published data of
this kind which we have been able to espy are incorporated in references
1 to 7, all of which only comprise wind tunnel tests on twelve biplane
combinations of zero stagger and different gap chord ratios, and on six
biplane combinations having miscellaneous stagger and gap chord ratios.
These tests were performed by six different experimenters working in four different wind tunnels, each operating at a different wind speed, and the biplane models enbodied five differEnt types of airfoil ranging
in size from 181 x 2".*65 to 33".6 x 6". A comparison between the various
results would be interesting, but a direct comparison is rertlered impossi-ble by the fact that with two exceptions no biplane combination with the same stagger and gap chord ratio was tested by different experimenters. In Section VII we shall make a detailed comparison between our own results
and these previous results. So suffice it here to say that the gist of
7-chord ratio variation on lift, drag, and lift drag ratio, at zero stagger.
Part of thi s data was sumnari zed in "biplane c orrec t ion f ac t ors " by
which the aerodynamic coefficients of the airfoil as a monoplane must be
multiplied in order to obtain the corresponding biplane coefficients.
Practically no biplane correction factors were available to show how
variation of the gap choxd ratio at zero stagger would effect the moment and center of pressure coefficients, or the distribution of load between the two wings; and no correction factors were available to dimlose how
variation of stagger at various gap chord ratios would effect the lift drag ratio or the lift, drag, moment, and center of pressure- coefficients.
Having thus briefly revieved our subject it seems that at the presEat
time the airplane des igner can neither obtain from previously published experimental data or from theory, knowledge of the aerodynamic coefficients. of biplanes commensurate in accuracy with that available for monoplanes.
We therefore propose to make a complete test in the wind tunnel of a
large number of biplane combinations, from gap chord ratio equal 0.50 to 2.00, and fram stagger equal -40% to 46016. For each biplane combination
we shall determine lift coefficients, drag coefficients, lift drag ratios,
moment coefficients, and center of pressure coefficients, for angles of
attack from -60 to *200. Wie shall then use this data (1) to verify the
qccuracy of various biplane formulae taken from 1.1unks "General Biplane
Theory" (ref. 1), which represents the application of the vortex theory to biplanes; and (2) to calculate biplane correction factors at equal values of the lift coefficient for drag coefficient, lift drag ratio,
moment coefficient, and center of pressure coefficient, and also biplane
correction factors for the maximum lift coefficient, minimum drag
co-efficient, maximum lift drag ratio, and for the distribution of total
It is desirable to calculate the correction factors by comparing
bi-plane with monobi-plane results at the sana lift coefficient instead of at
the same angle of attack, because from the standpoint of the designer
the weight of the airplane is the primary quantity known, and from the
standpoint of the vartex theory the lift coefficient instead of the angle
of attack is taken as the independent variable because all formulae are
thereby simplified, and it is easier to calculate the angle if the lift coefficient is given, than the lift coefficient if the angle is given.
In order to make these comparisons at equal lift coefficient it will be
necessary first to plot all of our data, because in wind tunnel tests
the angle of attack is the primary quantity and the lift is measured
afterwards.
After having tested the veracity of the theoretical biplane formulae, and calculated correction factors from our data, we hope to be able in
the statement of our conclusions
- (1) to indicate which formulae represents the facts with sufficient
accuracy to be immediately used as a routine method in the design room, and
(2) to present one or two small charts which shall summkarize all the
correction factors for biplane combinations fran gap chord ratio equal
1
Section III.
DESCRIPTION OF A-PARATUS
All of the tests were ocnducted in the'r.I.T. 4'0 wind timnel,
with the N.P.L. tpe balanceat a wind velocity of 40.0 m.p.h. The
standard apparatus of the wind timnel was used'fcr testing each
air-foil as a monoplane, and for mounting the two biplane combinations
in which each wing was tested separately in the prese re of the
in-terference of the other.
Each of the remaining combinat ions was tested as a biplane unit,
and for this purpose we developed the type of mounting illustrated.
by Photos 1 and 2, and Plates 1 and 2. The canplete biplane struct-ure, consisting of balanoe crosshead, 2 spindles, 2 airfoils, and
one strut, is shown in Photo 1. The balame crosshead and spindles
are shown in conplete detail by Plates 1 and 2. So suffice it to say that the crosshead was designed to screw into the bale-nce head in place of the regular chuch for mounting monoplanes, and was equipped with all the gadgets necessary to align it transverse to the wind
tunnel axis, to hold the two spindles firmly in alignment, and to
quickly and accurately adjust the distance between their axes and
the balance axis. In the 17ethod of Procedure, p. jj, the method of
mounting is described. All parts of the crosshead were c anstructed
of brass, with the exception of the chvck (7), 'the two slider rods
(5), and the spindles (2), which were of mild steel.
The airfoil models were of aluminum, 1S" x 3", accurate to
0".0015. For the purpose of holding the two airfoils rigidly spaced
fo
PH oro .1.
THE BIPLANE STRUCTURE
Composed of balance crosshead,
spindles, airfoils, and strut.
/I
PHOT-O Z.
I
BIPLA3E MOUNTED IN WIND TUNNEL
Balance croashead protected
from wind by discoid case.
---
-
-...
...
...
...
...
.
....
..
..
..
..
.
.
.
.
...
..
...
.
.
....
..
....
... --- - ---
which we shall refer to as the long, medium, and short struts. rach strut was constructed of brass, vas prong-shaped throLUhout half of its length, and was filed into a stream-line form, as far as possible. When a given strut had been attached to the biplane by means of two round-headed screws, the prong part of the strut was filled in with
putty in crder to decrease the resistance. This vas also done of
course when the effective resistance of the strut was measured
separate-ly.
It was found that the resistance of the balance crosshead was of the same orider as that of the biplane model itself, so it was found desirable, in oxder to obtain more accurate values for the biplane drag, to protect the crosshead frcm the wind stream by means of some kind of a case. For thi s purpose we utili zed a cello hot watter bottle, which provided us with a hollow metal case, of discoid shqpe,
10".5 in. diameter by 2".0 maximum thickness, which we shall hereafter
refer to as the "discoid case." From the top of the disc oid case a circular c.over 8".0 in diameter was cut, and with the excep tior. of
1-" at its center it was slotted across one of its diameters. The bottom of the dimoid case vas attached to the tov of the fairv.'ater
through which the bala2ce head projected, and the cover was attached
to the central black (8) of the balance crosshead. The boitcm thus
remained stationary while the cover rotated with the crosshead, and
the slots in the cover permitted the distaice between the spindles to
be varied. The method of utilization is evident fran Photo 2, which
shows a biplane -combination momted in the wind tumnel, with the bal-ance crosshead protec'ted from the wind by the discoid case.
/5
Section IV.
IETHOD OF PROCEDTE
Each of the two U.S.A. 27 airfoils was tested twice as a
mono-plane, and the average (p. /0) taken as the standard to which to
apply biplane correction factors.
The upper and lower wing of two biplnie combinations were then
tested separately, in the presene of the interfereme of the other,
at G/1= 1.00 and 1.67, and stagger = 0 (ppIuv.Lff). It was originally
intended to test all the biplane combinations in this way, but the
vibration of the two airfoils, due to the repulsion existing between
them wacking against the elasticity of the material, was appreciable at G/0
=
1.67, and at G/0 = 1.00 it was entirely too large for accuratewiot when this lift was larger than 1.2#. It would have been possible
to have rigidly fixed one of the two airfoils by means of an additional spindle supporting its upper enir, but that wculd have increased the
amplitude of vibration of the airfoil which was being tested, and the
only way to decrease the latter would have been to decrease the wind
speed.
It was not desirable to conduct the test at a wind speed below 40 mn.p.h., since that is the standard speed at which most of the tests on airfoils have been conducted at L1.I.T., and a direct comparision
of results would thus be po sible. So for the remainder of the tests
we mo-ated the biplane model in the wind tunnel as a rigid uni t, as
described in section III.
We then conducted a series of' tests to determine whether the balance crosshead should be protected from the wind, a.l what spindle
/6
mounted on the balance crosshead expo sed (p. /_/_). This showed that
the resistance of the balacme crosshead exposed was equal to about 3-times the minimu= drag of the airfoil, and thus necessitated the use of a protecting case, for which purpose we utilized the discoid case
previously described. WYe then tested each of the two U.s.A. 27
air-foils twice as a moiioplane, mounted on the balate crosshead protected by the discoid case, and with stanilard spindle length, i.e., projecting
5??.00 above the balance head Oppi-asiz). Owing to the presence of the discoid case within 3'0 of the end of the airfoil, the lift and drag
were both increased by about 450. In
am
attenpt to eliminate thisin-terference we increased the spindle length to 8"?.0, i.e., 3".00 longer than the standard length, and cnaducted the same number of tests as
bef ore (pp.sj/j, but the average results (p.j6) were not so good as
the previous average (p. 11-, most likely due to the larger deflection
error arising fran the bending of the spindle. For the bipltne tests
we therefore decided to protect the crosshead by means of the discoid case, and to use the 5".00 spindle length. As an aid to co;parison we have platted the results of the above mentioned preliminary tests in
Plate 3. See bEtez1: efrziu -9
The average value of the four tests on the U.S.A.- 27 monoplane with crosshead mounting protected from the wind by discoid case, (p.1), and curve 3 on Plate 3) is taken as the standard to which to compare
U.S.A. 27 biplane results and thereby obtain biplane correction factors.
This procedure involves the assumption that the interference effects of the discoid case on the biplane are in the same proportion as for
the monoplane. 'We later tested each of the two G~ttingen 387 airfoils
.00410~~~
160
, 0,,.0~ 03 /
G-,T THVC-E* .317 MONDPiANE 00 tv3 Rs 0 00 a c p S6. 4k Q~ja
2 on Plate 4) as a basis to which to compare the G6ttingen 387 biplane results*
Vie then proceeded to test twenty-nine U.S.A. 27 and twelve G~tt-ingen 387 biplane canbinations. In each test we measured L, D, and I., the moment about the balarce axis prolonged, and then calculated L/D,
164.,and C.P. The procedure in each case. was as f ollows:
The set up. The cover of the disc oid case vas removed and the balance crosshead aligned transverse to the axis of the wind tunnel. Collars (1) were attached to the spindles (2) by screws (3), so that
the distance fram the top of the collar to the top of the spindle was 3-11/321t. This made the distaime fran the bala:xe head to the airfoil 5".00. The distance between the spindle axes was then adjusted by mov-ing the slides (4) along the slider rods (5), ani lockmov-ing them in
position by means of the slider clamp screws (6). The spacing was always previously calculated so that the choxd. of each airfoil would be equidistant from the balare axis; and the distance was laid off
accurate to o".01 by laying a snnll steel rule flat on the upper sur-face of a slide(4), at the sane tine placing its end squarely against
the side surface of the central block (8), and measuring from the latter to the index line (9) on the surface of the slide. The balance head was then rotated througi the number of degrees of stagger which the given biplane canbination was to have, and locked. The airfoils were
screwed on to the spindles and aligned parallel to the tunnel axis by sighting along a batten. The spindles were then locked by the screws (10), the airfoils rigidly and accurately spaced at their upper ends
by means of a strut, the discoid cover replaced, and the test was ready
20
The test. Lo, L,, 3D, D, 1%, and , were measured in the
usual manner. The center of rotation at the upper enl'of the model
was then located, and its coordinates, p and d (fig. __, p. .), measured. Frou p and d we then calculateda and h (fig.I ), the
coordinates of the mean center of rotation. After correcting the
drag for effective 'spindle resistance, D,, and effective strut
resist-ance, 'D, we calculated L, D, L/D, Mle, and C.P. The values of the
effective strut resistance had been p-viously !ieasured so that in a given iriplane test it was only necessary to taee them from the curves
on Plate4d. This strut resistance vas of co urse different for each
angle of incidence of the biplane, whereas for a gi'ven pair of spindles the resistance was practically constant. Lift and moment corrections
due to strut ani spindles being not equidistant from the balance axis
were negligible.
All of the original data for the 41 biplane tests and for the
PLATE -< EONG STRU 41--EIU x-T-U-SH4ORT STRA4\ ijo62 {S -j / -..0 / o 0N */. 2.0 0 +
2,e
Section V.
ESTIMATION OP ERR07S
It is unnecessary to mention here the errors inherent in a wind
tunnel equipped with an IT.P.L. type balame. We shall discuss only
those errors arising when our procedure departed from routine procedure.
(1) Mis-Alignment of biplane model. In setting up the biplane
model the distarpe between the spindle ages and the balance axis could be set -to the nearest 0".01, thus making the maximum error in gap equal
to 1 0".01 at zero stagger. Likewise at the other end of the model the strut distance could be set within O".01. The maximum error in
G/' ratio would then be & 0.003 at zero stagger, and the maximum error in stagger would be 0t".01 sin 500.2 z 0".01, i.e., I 0.3%, at G/b
=
.50 and 60% stagger. In setting the number of degrees of0
stagger the balance head could be set to the nearest 0 .1, thus
giv-ing an error in stagger of - 00.05, or 1 0.1%, and a G/0 error equal 0.0000. The sum of these factors gives a maximum error of E 0.003
in G/C, and of E 0.4% in stagger. Since the smn of the errors both
in stagger and G/C can only produce an error of about f, 0.2% in
Le max., and 1% max., as shown by our final results, they are
en-tirely riegligible, and would have to be neglected even if they were
not so, becausd they are so far within the wind tunel error. No further mis-alignment of the biplane model took place due to the forces acting upon it during the course of the wind tunnel test
be-cause the balance crosshead, the airfoils, ani the stiff strut at
the top formed a very rigid structure.
axis, occurred to a greater or less degree when the airfoil was
screwed into the spindle, but a larger misalignment occurred in the
case of those models which were mounted on the balance crosshead
due toqthe fact that the spindles supported thereon vere not exactly
parallel to the balance axis.
These two factors,cnbined, served to
give a small amomt of
roll
and yaw to the model, which amounts can
be estimated
fran the codrdinates of the center of rotation measured
at each end of the model.
"A" and "B", the average values of these
cordinates measured at each end INotation p. 76), have been set dwn
at the head of the tabulated records for each test, and are summarized
in the following table.(1)
(2)
(3)
Aver.
.15
.86
.07
hax..19
.92
.21
Aver.
.98
.79
.90
a Max..93 .74.81
All values are positive, and are given in inches. Column (1) gives the
average and maximum values of "a" and "h" for the eight monoplanes
tested in the routine way, with spindle mounted directly in the balance
head)
(2) gives the corresponding values for the four monoplane tests
conducted with'the airfoil mounted on the balance crosshead protected
from the wind by the discoid case, with spindle axis 0".75 from balance
axis) (3) corresponding values for the 41 biplane
tests.-From these values of "a"? and "h"
we have calculated the values
in inches of roll and y%7 at the upper
enid
of the model.
24
(1)
(2)
(3)
Aver. .17 .08 .14 Roll ax. .25 .15 .42 Aver. .04 .42 .21Yaw
.ax. .14 .51 .38In calculating the degrees of roll and yaw we divided the values
in column (1) by 18.00
(a
span of airfoil in inches) pnd mult-iplied by 57.3, whereas in the'case of (2) and (3) we divided by 22.00 (= span ofairfoil in inches,plus spindle distance from bottom of airfoil to axis
of balance crosshead) and multiplied by 57.3. This method was
follow-ed because in the case of (1) a single airfoil mountfollow-ed in the routine manner, the spindle was but a prolongation of the balaime axis, and the mis-alignment was between the spingle axis and the airfoil axis; whereas
in the case of (2) and (3) the mis-alignment between model axis and
balance axis was due almost entirely to the fact that the spindle axs
themselves were not parallel to the balamre axis, the model axi.s being
pzactically parallel to the spindle axes. The value of roll and yaw
calculated in this way were:
(l)
(a)
(3) Aver. 0?5 -0?2 0o4 Roll. ax. 028 024121
Aver. 021 1.1 0o5 Yaw Max. 0*4 123 120All angles of roll and yaw were positive, according to NT.A.C.A.
25
The effect of the mis-alignment in. roll would be negligible.
The wind direction mould still be parallel to the wing chord, and the
forces measured on the balance would be (the actul forces) X cos
(angle of roll).
0
The cosine of the largest angle of roll recorded, 1.1, is 0.9998, so the negligible error of only 1/50% would be involved. Even for 4.0 of roll the error would b6 only -e
The effect of yaw is more potent, because it puts the airfoil
choi at an angle to the wind direction. The f ollowing % errors are
taken from data on a Clark tractor biplane model tested at 1.I.T.*
% Errors for angle of Yaw - +.20
Angle of attack 00 60 120 Lift. .. a a* -1*5.5 -0.7
0.7
Drag... +2.6 +1.2 0 C... Less than
-W%
of chord.These values were calculated for a complete model at 4 20 yaw, but for tests on airfoils only, the importance of accurate alignment is greatly lessened, because the forces which cause most of the
difficul-ty arise principally from the fuselage and tail surfaces. If we
assume that 25% of the error, arises from the airfoils alone, and
re-meriber that the maximum yaw arising in any one of our tests was +1.3,
it would seem by comparison that in our case the maximum error due to yaw was less than *-% for drag, less than -Y for lift, and entirely
negligible as regards moment. Detailed caloulationg'or our specific
case appear unnecessary.
Z6
(III) Spindle and Strut Resistance. In the case of the 41
bi-plane tests the effective spindle nsistance, D., could not be
deter-mined to any greater degree of accuracy than 1 0.0009#, due largely
to the fact that slightly different lengths of the spindle, as much
as i 1/20", were inevitably exposed each time the di soid case oover
was removed and replaced. Likewise we believe that the error involved
in determining the effective strut resistance, D., was about +_ 0.0003#.
This makes the sun of the deviations for effective strut and spindle
resistance equal to L0.0012#, and involves the following errors in
our biplane computation.
%
Errors due to strut and spindles.M Min. L/D Max. D at LIAX U.S.A. 27 Min. 15 +1.0 0.3 Biplane Max. t.? *1.1 t0.2
Gottinger Ylin. k1.3 *0.8 +0.2
387 Biplane
Max.
*1.4 *0.8 t0.2All of these values really represent zaximum
%
errors, the rowdesignated''min" being calculated for G/ = 0.50, stagger -40%,
which involved the largest values of drag, while the row desi ted
max. was calculated for G/0 a 2.00, stagger : 60, involving the
smallest values of drag. The maximum possible errors in measuring
drag were thus about *1.7% at Dmi n.l.l% at L/D max., *. 0.6%
tbroughout the flying rangp (40-100), and negligible when the lift
was near its _mniimmu. The average errors were of course about one
27
The fact that the spindle azes were not quite equidistant from the balame axis, but were so spaced as to mal.e the wing choids equi-distant, as well as the fact that the strut usually protruded over one en of the model (Photo 1), produced no appreciable error in
mea-suring moments. This was determined both by computat ion and by actual
measurement.
(IV) Deflection and N.P.L, balamce errors. Deflection of the bi-plane model would if anything be less than that of a single airfoil
mounted in the usual manner, because in the case of the biplane any deflection in roll must cause distortion or slipping of the strut
attached at the top. Zi1eei~z efindledfleeticn at th t9.
Like-wise spindle deflection would be less because the spindles had a free
length about l.O shorter than the usual free length. At the sarre
time all the errors involved in the IT.P.L, type balance, whether of dleflection or otherwise, remain entirely negligible, even though ,the forces were doubled as compared to the forces on a single airfoil.
SUCAlRY
We believe we have found and estimated approximately correctL9 most of the errors characteristic of the method we employed in
con-ducting our tests. These errors are summarized in the follo7ing
25.
11AXIML" EnfRops.
%5ources ., IDS
of At
E*v-or.
MaL.
MI'- L/,,, 4.I) z 0 .2.
(tz) -o..3 +0.6 +0.5 +0.5 -o.w -0.9
QT . - .g.7 i.i -G M I-x -. t o.
er.or, O.3 ., +2.2 +I. +1- I -4
We have previously stated that th.e errors.arising in the
determination of K and C.P. were negligible, and wehere see that the L. errors are also negligible, but the errors for D
min., and L/D max. could be over
a%,
while throughout the fly-ing range the errors for D. and L/D c ould be as much as 1% and 1jrespectively. These are the maximum errors, The average errors would be about half as zmich. But even at their maximum these
errors are no larger than the wind tunnel experimental error,
which is considered to be about 2%. Taking the latter into
account the maximum errors cculd be about 4% for DO min. and
L/D max,, and about 3% for D and L/D throughout the flying
range.
However, our final biplane correction factors (Plate3 83,
_14_ have a greater reliability than this, They were obtained
by comparing the data from 41 biplane tests and plottinvg smocth
21
But although these final generalized results have this degree of accuracy, the specific results from a given biplane test may not have. In conducting as many as 41 biplane tests it was inevitable that to one or two of them there should befall all of the maximum errors estimated above. Such was the lot of the U.S.A. 27 biplanes, G/O = 1.67, wtagger a 0, and of the upper wing tested separately for the U.S.A. 27 biplane, G/O) 1.00,
stagger = 0.
Such individual discrepancies as these have not vitiated the final results. By a comparison of the results as a whole they have been detected and eliminated.
30.
Section
VI.
AlqALYSIS OF RESULTS
Page
I.
Biplane Correction
Pactors
at Equal o.
.",,1.
Lift coefficient
.2. Drag coefficient.
.. 9.0
3. Lift Drag ratio.
..0*.
4. Moment coefficient.
II. Loading on Upper and Lower Wings.
.
Center of
p
essure.
.
2. Moient coefficient.
3. Lift coef. Distribution of lift between
upper and lower wings 40,
4. Drag coef. Distribution of drag between
upper and lower wings.
III. Aerodynamical Coefficients of the Biplane as
a Unit.
(Comparison of theoretical with
(experimental values, and calculation
(of biplane correction factors at
(Equal L.0)
1. Lift coefficients.
2. Drag obefficients.
3. Lift/drag ratios.
.8
4. Moment o effiOients.
3/
Section I.
ATALYSIS OF 1MSU 3L
The U.S.A. 27 airfoil was thoroughly tested as a monoplane, and in
81 biplane combinations; while the 9'6ttingen 387 airfoil was $tested as
a monoplane, and in 12 biplne c ombinat ions. All of the biplane
carbin-ations te.sted are listed in the following table:
G/O
Stagger 0.50 0.75 1.00 1.33 1.67 2.00 -40% u Uu ug iU -20% u Uu -33 0% u ug uug ug iiu u 2 ug u aa 40% u ug u 602 u ug ug ug u ue GUttingen 387, u= U.S.A. 27, uu U.S.A. 27 tested both as a
biplane unit, and in addition each wing tested separately in the
presence of the other.
The original data for these tests are tabujlated in the order in which
originally made, in Appendix B.
It must be renabered that this original data rep-resents the forces acting on the biplanes in the presence of the interfercnce of
the discoid case. As mentioned in SectionlV, p. jj, it was thourit
that the easiest way to correct for this interference would be to com-pare the b iplane resul ts with the resul ts obtained from a monoplane
"s
tested in the same way (p.gi_). We mcde these co7,arisons at equal
angles of attack, because to have done so at equal Lc wauld have
necessitated plotting all the original data. Instead, we obtained
(Tables 1-33). We then multiplied the aerodynamical coefficients
for the U.S.A. 27 and G'ttingen 387 monoplanes tested in the routine
way (pp. fO,146) by these biplane correction factors, and so
ob-tained the true biplane values for the L' D0, L/D, and M (Tables
34 - 55, 62 - 73); while the true b iplane values for C.P. (Tables 56 - 61, 73 - 76) were more easily obtained by aaing certain cx
rect-ions to the original biplane data. Having thus arrived at true values
of the biplane coefficients, we plotted than (Plates 3-12), and by
reading values from the curves were able to check the accuracy of 1unk's formulae (pp.1z-7q) and to calculate biplane correction factors at equal
values of the L. (Tables 61-101 ).
Having thus outlined the use to which our original data was put, we shall now analyze in detail the results obtained.
I. Biplane Correction Factors at Equal .
These factors (ables 1 - 33) were obtained more or less as a
by-prod.uct in the process by which we arrived at the true biplane values
for the L c' D L/D, and They are not of as much significance
as the correction factors obtained by making comparisons between the
biplane and monoplane results at equal values of the Lc, because lift
is really the primary datum in considering an airfoil, and the angle
of ttack at which the lift occurs is only a secondary consideration.
Levertheless, an analysis of these factors will doubtless repay the effort involved, for they show
-(1) the values of all biplane coeff ic ients in terms of the
correspond-ing monoplane results at equal oc,
(2) how the biplane coeffieicnts at eaual Oc.- vary with stagger and
G/0, and
33
and G/C vary with ol.
We shall analyze in turn the correction factors at equal for Let D., L/D, and M.,
1. Lift Coefficient. - For a given biplane combination the
correo-t-ion factors are practically constant from CC- 00 to oL = 120 or
140. Thus for the U.S.A. 27 biplne, G/C = 1.00, stagger 0, the
values
are-0C
0 2 4 6 8 10 12 14
Correction
Factor *85-2 .8 .87 .86-; .85-1 .86i .86} .87i
The average value is *86- * .01, while the corresponding average for
the G3t. 387 is .85iA= .01, thus malding the average for the t-io,0.86. The constancy of the correction factors from 00 to 120 - 140 for a
given biplane combination, and the g'ood agreement between the U.S.A.
27 and GUt. 387 results, are shown to better advantage by plotting
the factors for each combination, but we consider it unnecessary to
ind~lude the chart so obtained here. In the way illustrated above we
have found the average factors for all the biplane combinations tested
and tabulate them below.
Table 75
Biplane Correction Factors for L., of- 00 to 13 .
U.S.A. 27, and *Gbt. 387 Airfoils.
Gap/Chord Stagger 0.50 0.75 1 .33 1 2.00 60% .89 .921 .9& .89 .95 .96 *l.1 *95 *.90i 40% .90 .90 .94 *.90 20% .84A- .88i .94 *.854
o%
.7&61 .82 .8v2 .89j .8j .94 *82 *.&& *89: .78 .88 .89 -49-. .77 .82A .87 *88 .91' *78 ".84J *.8534
The data of Table 75 are platted in our f inal Chart, Plate /, and
givex a series of smooth curves which vie believe are accurate within
+-%, and from which we take the following values as a comparienn to Table 75.
Table 76
Biplane Correction Factor For L , 0 - 130
Applicable to Airfoils having a I'ax. Camber 10 to 164.
Gap/Chord Stagper 0.50 0.75. 1.00 1.033 11.67 2.00 6o% .89 .92 .94 .95 *95 .96 40% .89 .911 .93 20% .94 .88 .91 0& .82 .86- .89}
.91i
.94 -20% .80 .84t .88 -40% 6 77 .83 .86 .89 .91)We sliall now consider whether the factors in Table 76 are
alpli-cable to any airfoil. From the standpoint of the vortex theory the
lift of an airfoil may be divided into two rarts, lift due
tocur-vature, and lift die to angle of attack. For a monoplane,
Lift coefficiezit.*due to curvature Zirsin/3. ... (1)
" angle of attack=2-rrsin(3...(2)
While f or a biplane,
Lift coefficient due to curvature = 2rsin ,<.Bo...(3)
" angle of attack = 2-rrsing3 B**... 0 )
df comparisons are then made at equal angles of attack (equal13
)
for monoplane and biplane, the biplane c orrection factor for the
lift coef. due to curvature is
2rr 'Sin/.
2
2 r- n/.
and for the lift coef. due to angle of attack is
Z7r- "rf3
35
B and B0 are theoretically determined constants (ref. 9)
which depend only on the biplane eccibination, i.e., on the amoun t
of stagger and G/, so that these biplane correction factors for the
two individual components of the lift coefficient are independent
both of airfoil'profile and angle of attack. But the lift due to
angle of attack increases as the argle increases, while the lift
due to curvature remins constant for a riven airfoil. Therefore
the biplane correction factor for total 1 will be at least slightly different for every airfoil and every angle of attack. Precjsely it
will be equal to
-sin/30-BO + sin/3-B - B (B -B)-
-inf +-(n)
sin/Io + sin in/3 s
The value of this is (-) when,/3 ./-, ain. gradually approaches B as
the angle of attack is increased. Thus far the U.S.A. 27 airfoil,
G/C = 1.00, stagger = 0: B,= .854, BO= .925, and the theoretical and
experimental values of the biplane correction factors are
-0 .2 46 8 10 .12 14
Theor. .91 .89* *88- .872 .87%1 .87 .87 .86
Exper. .8& .8&; .87 .86 .85. .861 .86i- 87}
The agreement here is good from 6 - 140 , but the predictionsof the
vortex theory are usually restricted to this range anyvay. It might
be inquired as to why the biplane lift ccuald not be determined directly
by us ing formulae (3) and (4), but that cannot be done, as sbov= by
a detailed computation, p.5, because these formulae represent a
solution of the two - dimensional problem only. Qut we' can compare results obtained from (3) and (4) with those obtained from (1) and (2), and thus get biplane correction factors, based on the asstmption
propor-3'
tionately the same for both monoplane an1 biplane.
From formula (5) we see that for a given biplane combination the
value o f the biplnne correction factor depends on /, and /G .
/.(
represents the curvature effect, while/s=
0 represents the anCleof attack at which the moment about the center of the wing is zero. Since both of these factors are~a function of camber, we should expect airfoils of approximately equal canber to have approximately equal
biplane correction factors. Our experimental results show this to be
true for the U.S.A. 27 with maximum canber equal 10.98%, compared to
the GUt. 387 with maximum camber equal 15.14%. And a comparison of the
correction factors for these two airfoils with the limited data
pre-viously published for the thin Eiffel 13 bis, R.A.F. 6c, I.A.F. 15Z,
and Eiffel 36 airfoils, shows that the latter are always about- 5%
lower than the former.* From formula (5) we also see that as the
angle of attack (p3) is changed. the biplane correction factor must change, but our experimental results show that the deviation from the
average taken between 0 120 is only about -t 1% for the U.S.A. 27
and GUt. 387 airfoils.
Sunining up, we can therefore say of the factors given in Table
76, that they are not of any especial significance, but afford a
con-venient means of comparing the lift of different biplane combinations
throughout the flying range (0 - 130), and are accurate within i15
for airfoil s having a rraimum camber of from 10 to 165.
97
2. Drag Coefficient - The biplane correction factors at equal 4C
for D. (Tables 11 - 19) are invariably larger than 1.00 for minimum
drag, ani show a steady decrease from that point onwards as ox-increases. However, they renain fairly constant from 60 to 160,
throu2hout which range an average value zan be taken from which the
deviations will not usually be greater than *21. The Gtt. 387 results
as a whole agree with the U.S.A. 27 results within about 35 from ol
-00 to 14 0 The rarge of variation of the factors from 60 - 160, as well
as the lack of -a closer agreement.between the results for the two
airfoils, does not justify a tabulation similar to that made for L
factors in Table 75. The effect of stagger is much more pronounced
than that of G/., wheret the biplshe correction factors for'D at
eqval LO, as we shall see on p._66 , are affected in Exactly the opposite way.
3. Lift - drag Ratio. The correction factors at equal oe- (Tables
20-24) vary definitely for a given biplane combination as o. is
increased. They increase very little 'ith stagger between oL= 00
and 160, the variation being within t25 from the average, but they
increase rapidly as G/C is increased. The results for the U.S.A. 27
and Get. 387 airfoils agree within about 2% from oL= 00 to 140.
4. Moment Coefficient - The c orrection factors for Mc (Tables
25-7-for a given biplane combination are fairly constant from about 40 to
140, sometimes over a larger raie, aid. sanetimes not at all. We
would expect constant factors from about 00 to 140, because within that
range . cc c , and the curves of 1 vs. L. are practically
straight lines radiating from a focus. As stagger is increased from 40% to O1 there is a slight decrease* in M, *Of from 1 to 5 ; whereas
* Decrease here means a decrease in the absolute value of the pitching
from stagger = 0 to 60% there is a decided decrease, of from 15 to 25%. The effect of negative stagger is thus negligible; the effect
of positive stagger potent. The effect of increasing G/C is to
de-crease the M, but not to so great an Extent as does stagger. The
M correction factors f or the Not. 387 airfoil are effected to a
C
smaller extent by variations of stagger and G/0 than is the U..A. 27,
so that the latter has higher values at negative staggers ari lover
values at positive staggers.
S* * ** * * * **
This concludes the analysis (so-called) of the biplane correction
factors at equal c.-for L., Do, L/), and i&. They are not of mnuch significance. They befell us as a by-product from the procedure by
which we tried to obtain true values of the b iplane aerodynamic
coefficients. 7ie hoped to correlate them in scte useful way. In the
care of the correction factors for L , from 00 to 130, we succeeded, and consider the bother repaid.
We shall now proceed to consider the data on the upper ani
31
II. Loading on Upner...and Lower Wings4
The upper and lower wings were tested separately in the
presence of the intelferexme of the other for two U.S.A. 7 biplane
canbinations (stagger 0, and G/O
=
1.00, 1.67). We consider thisdata to be very reliable for' G/
=
1.67 but not so reliable forG/b = 1.00, because during the test of the latter biplane the wings
vibrated rather violently, whereas c ompardtively little vibration
occurred in the case of the former. The Lo, Do, L/), 21 ,and C.P.
for each wing are tabulated with the Original Data, pp. lo -io,.
while the fractions of the total biplane lift and drag on each wing
are listed on Table 34. We shall examine the aerodynamic
coeffi-cients for each wing in reverse of the oider mentioned.
1. Center of Pressure. The vortex theory indicates that for
unstaggered biplanes.there should be little difference between the
0 .. on the upper and lowe r wings. Our 0 .P. Is f or G/O - 1.00 are in eaact agreement from & 00 to 180, but they differ by 4,
of the chord for G/b 1.67. There is nothing to indicate that
these latter values are in error, for a corbination of them in such a may as to give the C.P. of the biplane as a whole (Table 34)
checks within 1- with the corresponding values obtained when the
biplane was tested as a unit (Table 58). The same holds true for
the C.P.'s at Gt
=
1.00. Our data is therefore insufficienteither to gainsay or verify the theory, and we have not been able to find any published data of this specific type.
2. Moment Coefficient. The 1I s for the upper wing are
.smiller than those for the lower wing at small angles of attack,
40
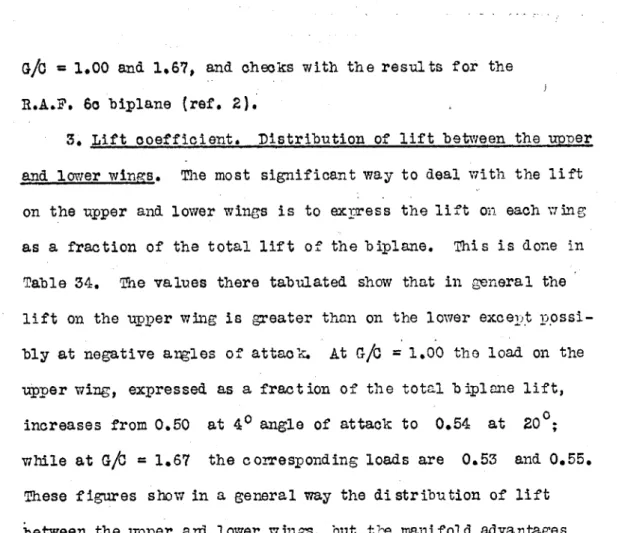
G/0 = 1.00 and 1.67, and checks with the results for the
R.A.F. 6o biplane (ref. 2).
3. Lift coefficient. Distribution of lift between the upper
and lower wines. The most significant way to deal with the lift on the upper and lower wings is to express the lift on each wing
as a fraction of the total lift of the biplane. This is done in
Table 34. The values there tabulated show that in general the
lift on the upper wing is greater than on the lower except
possi-bly at negative argles of attack. At G/O = 1.00 the load on the
upper wing, expressed as a fraction of the total biplane lift,
increases from 0.50 at 40 angle of attack to 0.54 at 200;
while at G/0 = 1.67 the corresponding loads are 0.53 and 0.55.
These figures show in a general way the distribution of lift between the upper and lower wings, but the manifold advantages to be gained from a more careful detailed design of wings
justifies a thorough analysis of the load distribution from both theoretical and experimental standpoints.
From the standpoint of the vortex theory the lift on each
wing of a biplane is considered to be the sum of prd.mary and
secondary lifts (ref. 1). The primary lift is the sum of lift and counterlift; it is that part of the entire lift of a wing which is produced by the interaction of the uniform flow with the
circulation and counter-circulation flow around the winr. The
secacndary lift is a component of the mutual forces acting between
parts of the whole biplzie, consisting in this case of the re-pulsion between the upper and lower wings, increasing the lift
41
For a biplane without stagger.the u'pper and lower primary lifts are equal, for the induction at the upper ari- lower wing is almost equal, and therefore the changes of lift are equal.
But a secondary difference is induced between the primary lifts
due to the change of "effective stagger" as the angle of attack is changed. The "effective stagger" is not measured parallel to the wing chord, but more nearly parallel to the direction of
fliht. For the effects of aerodynamical* induction are
deter-mined by the position of the vortex layer behind the wings, and
the direction of this layer nearly coincides with the direction
of fli ht. The "effective stagger" must therefore alvays be
con-sidered whether the biplane is staggered or not. For an
un-staggered biplane it 4s directly proportional to the gap and to
the lift coefficient. Due to it the change of induced upper
and lower lift coefficient is
0r -- --
6-
l *This qmantity must be added to the absolute lift coefficient of
the forward wing, ani subtracted from that of the rear wing.
It constitutes the only appreciable change of u'pper ani lower
pri-mary lift on an unstaggered biplane.
We shall now analyze the secondary lift, which is a
repul-sion between the two wings. This repulsive fozme is produced
both by the ciztulation flow ani the vertical flow around the
wings. The component due to the vertical flow. is proportional
4Z
to the square of the angle of attack, and expressed as a
qtantity to be added to the upper and subtracted from the lower
absolute lift coefficient, it is
sin v (7)
On the other hand, the canponent due to the circulation flow is
proportional to- the square of the lift, and is * 2
2 2 2 TT-r B
Adding (7) and (8) we get the total seccndary lift coefficient which must be added to the lift coefficient of the upper wing and subtracted from that of the lower:
2
0. sinU2 3- + . . . . (9)
L 2 2
2 T - B
The first term of this expression is proportional to the square of
the angle of attack, while the second is proportional to the square
of the lift. But lift arises both from curvature and from angle
of attack. So for a given biplane the lift due to angle involves
a double repulsive force, that arising from both (7) and the part
of (8) due to angle; whereas the lift due to curvature involves a
single repulsive force, that arising frcn the part of (8) due to
curvature. Thick wing biplanes therefore have small)repuls ive
forces than thin wing biplanes, and upper and lower lifts are more
equal for the former.
-43
Calculations for a specific case, however, show that at equal
values of the lift coefficient this factor causes negligible
differences of loading for a thin wing as compared to/meditunly
thick wing. The theoretical curves, showing the fiction of
total biplane lift on the upper wing plo.tted against lift
co-efficient, c'oincide for the R.A.F.6, (max. camber 6.95%) and the
U.S.A. 27 (*iec. camber 10.98%), both biplanes being at G/C = 1.00,
and zero stagger. The corresponding experimental curves do not
so agree, but for the reasons previously stated the la tter results
are considered inaccurate. It seems safe to say that differemes
of curvature cause negligible differem es of seondary lifts.
By add Ing the secondary lift coefficient (9) to the chae of
primary lift coefficient (6), we obtain
2-0L 1CL
3
G
j
sin
3 2v
+2
6B910)This 'expresses the eqgal and opposite amounts by which the upper
and lower lift coefficients of an unstaggered biplane are changed.
The first term of formula (10) must be added to the upper wing and subtracted from the lower at negative anCles of attack, ahd vice
versa at positive angles of attack. The second term is always added
to the -upper, and ambtracted from the lower. According to the method
of this formula we have calculated the lift on the upper wing of the t1ree biplane c anbinations for vAich we have exp-,erimental data to serve as a basis of comparison. For one of' these we rive the detailed computations.
44 R.A.F.Gg Biplane.*
Gap/Chord = 1.03, Stagger = 0, Aspect ratio = 8.
1.03
We calcul ate S/b2 = 1/3, GA/b 0.172 -From curves of the original data we find that
: a 00 when d w 003.
From ref. 9, Tables I and III, we obtain the f ollowing values:
B 0.858, 0 = 1.88, V - 0.078,b(1 0.5)= 0.71
We calculate CL = 0.0143 CL9 0.078 sin + 0.130 C .
It is then easy to calculate the value of CLI and CL, for
each angle of attack. These are tabulated in Table 77. Table 77.
Amount, (0 +
*
),
by which upper lift coef. (0L) is increased.R.A.F.6c Biplane
Gap/chozd - 1.00, Stagker- 0 , Aspect ratio = 6.
a LCX105 -6.3 -4.3 -2.3 -0.3 1.7' 3.7 5.7 7.7 9.7 11.7 13.7 15.7 17*7 19.7 r67 -30 7
46
87 127 161 195 222253
276
297 295 277 CL x10 3 OLx103 14.3-0 L-260
-118 28 178 340. 498 630 650 868 990 1076 1160 1150 1080 1 0 0 0-2
-4 -6 -8 -11 -17 -19 -19 -17 0L 103 78 sin 130 0L (OL .k
)x103 10
0
0
0
0
1 2 3 4 5 6 7 9 9 20
4
15 32 51 75 98 127 151 174 171 151 11 20
4 13 28 48 69 90 118 139 161 159 14345.
In the 2nd and 3rd coluns the lift coefficients of the biplane
as a whole are tabulated. 0Li and
the two components of CL
are tabulated in sel-arate columns so that the relative inportarce
of each of these three factors can be gaugada1 It is evident
that the component of the secondary lift wibch arises from the
circulation flow, viz.,
2
0-
0L
2
0.130 C
-2 rrB2
is by far the most important factor of the three involved. The otlber two, listed in the 4th and 5th columns could be omitted
without causing an error of more than 1.l% in determining the
%
of lift on the upper wing. That amount is too large to be neglected, hovaver.The fraction of total biplane lift on the upper wing is equal to
0.50 t (CL + OLZ ) 1z.-CL, ... (11)
where CL is the lift coefficient of the biplcane as a whole. The
values of this fraction were calculated for the R.A.F. 6c, and
also for the U.S.A. 27 at G/C -1.00 and 1.67, according to the
method of computation illustrated above. The experimental values