HAL Id: hal-00329093
https://hal.archives-ouvertes.fr/hal-00329093
Submitted on 1 Jan 1998
HAL is a multi-disciplinary open access
archive for the deposit and dissemination of sci-entific research documents, whether they are pub-lished or not. The documents may come from teaching and research institutions in France or abroad, or from public or private research centers.
L’archive ouverte pluridisciplinaire HAL, est destinée au dépôt et à la diffusion de documents scientifiques de niveau recherche, publiés ou non, émanant des établissements d’enseignement et de recherche français ou étrangers, des laboratoires publics ou privés.
Fabry-Perot interferometer measurements of neutral
winds and F2 layer variations at the magnetic equator
P. Vila, D. Rees, P. Merrien, E. Kone
To cite this version:
P. Vila, D. Rees, P. Merrien, E. Kone. Fabry-Perot interferometer measurements of neutral winds and F2 layer variations at the magnetic equator. Annales Geophysicae, European Geosciences Union, 1998, 16 (6), pp.731-737. �hal-00329093�
Fabry-Perot interferometer measurements of neutral winds
and F2 layer variations at the magnetic equator
P. Vila1, D. Rees2, P. Merrien3, and E. Kone4
1CETP, 4 Avenue de Neptune, F-94107 St Maur des FosseÂs, France
2Center for Atmospheric and Space Studies, Utah State University, Logan, Utah 84322/4405, USA 3CSN Commissioner at the Korhogo station (CoÃte d'Ivoire) for 1996
4DeÂpartement de Physique de l'AtmospheÁre, Universite de Cocody, 22 BP 582 Abidjan, CoÃte d'Ivoire Received: 7 February 1997 / Revised: 9 January 1998 / Accepted: 16 January 1998
Abstract. This letter presents some night-time observa-tions of neutral wind variaobserva-tions at F2 layer levels near the dip equator, measured by the Fabry-Perot interfer-ometer set up in 1994 at Korhogo (Ivory Coast, geographic latitude 9.25°N, longitude 355°E, dip lati-tude )2.5°). Our instrument uses the 630 nm (O1D) line
to determine radial Doppler velocities of the oxygen atoms between 200 and 400 km altitude. First results for November 1994 to March 1995 reveal persistent east-ward ¯ows, and frequent intervals of southeast-ward winds of larger than 50 ms)1 velocity. Compared with the
simultaneous ionospheric patterns deduced from the three West African equatorial ionosondes at Korhogo, Ouagadougou (Burkina-Faso, dip latitude +1.5°) and Dakar (SeÂneÂgal, dip latitude +5°), they illustrate various impacts of the thermospheric winds on F2 layer density: (1) on the mesoscale evolution (a few 103 km
and a few 100 minutes scales) and (2) on local ¯uctuations (hundreds of km and tens of minutes characteristic times). We report on these ¯uctuations and discuss the opportunity to improve the time-resolution of the Fabry-Perot interferometer at Kor-hogo.
Key words. Ionosphere (Equatorial ionosphere; Ionosphere-atmosphere interaction) á Meteorology and Atmospheric Dynamics (General circulation)
1 Introduction
Neutral wind velocity measurements in the equatorial F layer have so far resulted from satellite probes or from the South American ground-based network (Biondi
et al., 1991). The topic has not been studied intensively (for references see Sipler and Biondi, 1978; Herrero and Meriwether, 1994; Colerico et al., 1996). Since November 1992 the early results of the ionosonde network at Dakar, Ougadougou and Korhogo have provided a series of morphological surprises with problems of interpretation in terms of thermosphere dynamics. (e.g. Sambou et al., IEEY special issue, this journal). In this study we present the ®rst continuous night-time measurements of thermospheric winds with the imaging Fabry-PeÂrot interferometer system, IFPI, set up at Korhogo during the ``magnetic winter'' months November, 1994 to early March, 1995. We compare them with simultaneous F2 peak distributions of the ionosonde network. We show here that the meridian wind aects the near-equatorial F2 peak distributions. These density changes become easily interpretable as the eects of simultaneous wind drag. In order to study the eects of zonal perturbations also, and possible rapid electric ®eld and gravity wave disturbances in the night-time F region, it would be desirable to reduce the measurement sequence time to 10±15 minutes.
In this letter we describe brie¯y the present mental FPI system (Sect. 2). We then present experi-mental examples of FPI measurements together with the West African IEEY network ionosonde variations (Sec. 3). The discussion of these results leads us to suggest an upgraded time resolution, now available by the replace-ment of the original imaging photon detector by a more sensitive and more automatically controlled intensi®ed charge transfer device.
2 The imaging Fabry-PeÂrot interferometer 2.1 The system functions
An imaging Fabry-Perot interferometer was installed at Korhogo in 1993 and has been in operation since then. It observes the O(1D) line of oxygen atoms, which
result from dissociative recombination with electrons O2+ + e ! O + O(1D), in the ionosphere between
approximately 200 and 400 km altitude. Since 1994, this IFPI has been in use regularly, obtaining around 10 nights of data per month (mainly during clear nights in the dark sky period around new moon). The sightings from 60°zenith angles enable observation of F layer volumes with average height, h, at horizontal distances of h.Ö3 (about 500 km). This allows for average estimates of the wind components across our zone of observations.
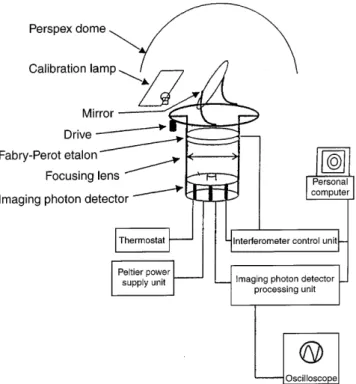
The IFPI records the high-resolution spectra of suitable nightglow emissions from atoms and molecules in the upper atmosphere. From analysis of these spectra, the wind velocity (Doppler shift or line displacement) can be obtained. Wind velocity is measured by allowing the instrument to view successively in dierent directions, and comparing the Doppler shift in each direction. A rotating mirror scans successively seven azimuthal directions of an 8-position compass card. The distances between volumes of space observed in each pair of opposite directions are appropriate for the determination of night-time wind gradients. The basic principles of the Fabry-Perot interferometer are discus-sed by Hernandez (1988), and the particular version of the imaging Fabry-Perot interferometer used at Kor-hogo has been described in detail by Rees et al. (1989). Figure 1 summarizes the main instrumental functions which are listed next.
1. Scanning mirror system, to allow the instrument to view the sky in seven directions, as well as a calibration lamp to check the instrument stability; 2. Fabry-Perot etalon. In a temperature-stable,
evacu-ated container, the etalon produces the high-resolu-tion spectra of the airglow emission sources;
3. The imaging system: it is used to project the Fabry-Perot fringes onto a two-dimensional imaging detec-tor;
4. Interference ®lter, used to isolate the O(1D) emission
line from other emissions and background contami-nation;
5. Imaging detector: a two-dimensional detector of high sensitivity and low noise, used to record the interfer-ometer fringe pattern. The detector is Peltier-cooled to reduce noise;
6. Calibration lamp: it provides a constant reference for monitoring base-line shifts of the interferometer; 7. A Fabry-Perot control system controls the scanning
mirror and the calibration lamp;
8. A PC computer is used to control the IFPI, to process and store the data, and to monitor the fringes in real time.
2.2 The zero velocity/baseline
The zenith reference often used at high latitudes for determining an empirical ``zero velocity'' baseline is not practical at the magnetic equator where the weakness of the emission would impose a long dwell at the zenith, aggravating the poor time resolution of the measure-ments. A local calibration lamp is used, with a RF excited neon line at 630.4 nm, suitable for measuring (and tracking changes of) the optical path dierence of the Fabry-Perot etalon. At Korhogo this lamp is viewed at every scan. This calibration provides a regular update of any changes of the instrument base-line.
We have to determine the oset between the neon line and the O1 630 nm (at zero velocity). The zero-reference for wind velocity comes from a combination of: 1. Regular long-term observations using all horizontal winds in all directions. This introduces the assumption that the long-term divergence of horizontal winds is small (at the magnetic equator there are good physical reasons to expect that local electro-dynamical forcing from the ionosphere may create signi®cant divergence/ convergence).
2. Regular long-term observations using all the mea-surements of ``horizontal winds'' in all directions on cloudy nights. On such nights, multiple scattering greatly reduces the dierential Doppler shift observed in dierent directions. ``Wind'' data from all directions during a small number of cloudy nights provides a graphic illustration of the correct oset of the calibra-tion lamp from the `zero velocity wind'. The night-by-night consistency of this oset is used to gain con®dence in the determination.
The solution chosen for the instrument at Korhogo was: 1. To spend all the time looking at the `horizontal
winds'
2. To observe regularly a bright calibration lamp to get an `oset zero' wind reference
3. To calibrate the oset from neon lamp reference to O1 630 nm `zero' by looking at data from many cloudy nights
Fig. 1. Schematic diagram of the FPI instrument
4. To use this oset, and check by considering the possible wind divergence/convergence over as many clear nights as possible
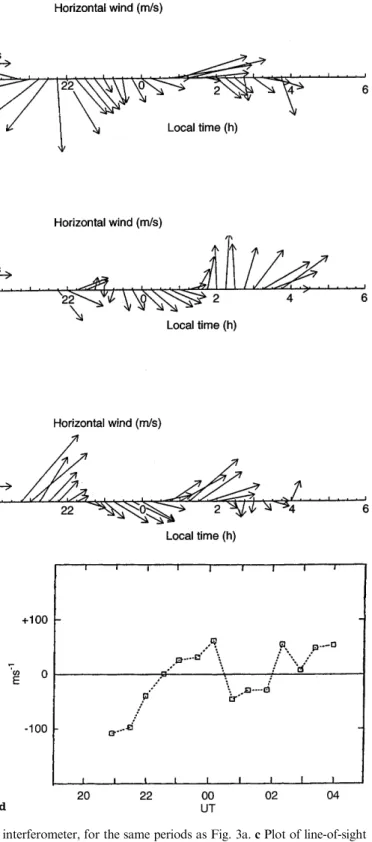
An example of this procedure is shown in Fig. 3c. This shows the individual wind components for the north and south directions for the night of March 3/4, 1995. Despite the relatively small number of individual observations during this particular night, the ``zero velocity'' baseline does correspond quite well with the night-long average of the individual winds in the north and south directions. As the result we have combined the wind data from the two individual directions to produce the combined meridional wind velocity which is shown in Fig. 3c. The zonal wind components have been similarly processed. In turn, these have been used to produce the wind velocity which is plotted in Fig. 3d.
This procedure is not perfect. The improved solution is to put a more sensitive detector on the FPI, an extra mirror to record the zenith wind, and use both the zenith wind and the calibration lamp to update the `zero-wind velocity' reference. The presently used procedure leads to a wind base-line uncertainty (zero velocity) of 10 m s)1
at worst, compared with 3±5 ms)1 in an improved
version.
Since the instantaneous wind values are typically 50± 100 ms)1, this process for determining the base-line
leads to a valid analysis procedure for the winds. 2.3 Projected improvement
In order to follow the short time evolution of key features of the electric ®eld driving motions, a maximum integration time of about 120 s per direction is required. With such brief intervals, an adequate signal-to-noise ratio cannot be obtained with the present detector of the IFPI and the weakness of the equatorial red line nightglow intensities. By using a newly developed cooled, intensi®ed CCD detector which has already been demonstrated to perform extremely well with the IFPI (Kosch et al., 1996; Rees et al., 1989) this level of performance could now be achieved. A similar detector will be installed on the IFPI at Korhogo in the near future.
Fig. 2a, b. As a function of the dip latitude and local time, winter solstice night-time evolution of: Top panel: h'F, altitude of the F2 layer bottom; middle panel: foF2 expressed in MHz; lower panel:
horizontal wind observed with the Fabry-Perot interferometer. a For November 28±29 1994; b for November 29±30 1994.
3 Neutral wind velocities and equatorial F2 peak distribution
For the period 1994±1995 of ®rst regular measurements (15 nights of good quality records) the night-time equatorial F2 layer shows a complex behaviour.
3.1 Wind night-time behaviour
At the local scale of 100 min time and over a few 100 km region the wind vector variation shows three main phases, rather well represented on the nights of Novem-ber 28 and 29, 1994 (Fig. 2):
Fig. 3. a As a function of the dip latitude and local time, night-time evolution of foF2 for three dierent periods: top panel: December 3±4, 1994; middle panel: December 4±5, 1994; lower panel: March 3±4, 1995. b As a function of the dip latitude and local time, night-time evolution of the horizontal wind, observed with the Fabry-Perot
interferometer, for the same periods as Fig. 3a. c Plot of line-of-sight velocity components and resulting horizontal vector variations at Korhogo, 3±4 March, 1995 corresponding to Fig. 3b bottom panel. d Plot of line-of-sight velocity for the zonal wind component at Korhogo, 3±4 March, 1995 corresponding to Fig. 3b bottom panel.
1. During the post-sunset transient interval 18.00 to 21.00 LT(+ or )1 h) the wind is irregular, with frequent persistence of the day-time northward mo-tion, but with zonal ¯ows not always strongly eastward as expected from the classical models (Spencer et al., 1979; Biondi et al., 1991)
2. From 21.00 to 02.00 LT the meridian velocity is consistently southeastward (except for short spells of westward ¯ow of less than 1 h)
3. Pre-sunrise winds are generally northeastward, with exceptions for December 4, 1994 and March 4, 1995 as shown on Fig. 3.
This ®rst set of wind determinations is remarkably self-consistent, suggesting good stability of the Doppler shift analysis.
3.2 F2 Layer night-time behaviour
The F layer density was simultaneously measured by our three equatorial ionosondes. The night-time evolution presents three phases, rather synchronous with the wind variation, e.g. Fig. 2a:
Phase 1. Post-sunset rise, 18.00 to 21.00( + or )1.5 h) LT; most of the F region plasma accumulated at low magnetic latitude at the end of the afternoon is lifted more or less rapidly (from h < 220 km to h > 350 km) out of the rapid recombination levels, maintaining high plasma density while plasma from the subtropical latitude zones is entering the equatorial segment under the night-time fountain ¯ow reversal.
Phase 2. Midnight stagnation, 21.00 to 02.00 LT; the reverse fountain ¯ow seems to continue in a symmetric fashion relative to the magnetic equator, and it appears modi®ed by meridional wind-drag with extremely short response times, but the overall result is a stable density pro®le.
Phase 3. Photochemical decay during 02.00 to 06.00 LT, with quite dierent rates depending on the height electron density pro®le; this is the phase when large gravity wave oscillations can profoundly modify the otherwise depleted ionosphere, with upward-moving F layer strata.
3.3 Comparison between the wind and F2 layer density behaviours
During phases 1 and 2, moderate eastward thermos-pheric winds (<50 m s)1) leave the dominant motions to
upward drift across the F region, prolonging its density, and possibly smoothing its variation by zonal transport supply from earlier LT sectors. These variations are con®rmed by the variations in bottom height of the F layer (h¢F).
During the ®rst part of the night of November 28±29 (Fig. 2a) there is a southward ¯ow through the equato-rial zone (perhaps as a consequence of the magnetic disturbance of November 26). After 22.00 LT, a weak northward ¯ow re-equalises the F layer height and
maintains a northward foF2 gradient until 00.00 LT. The wind reversal to south after 00.00 LT seems to be responsible for the short-lived increase in h¢F at about 01.00 LT with a corresponding foF2 decrease.
The following night, November 29±30, is a magnet-ically quiet interval with a probable dominant north-ward wind before 21.00 LT, and relatively high values of foF2 at Dakar at the northern edge of the equatorial region. This wind abates after 23.00 LT and the latitude distribution tends to the uniform pattern typical of the middle-of-night (see phase 2). After 01.00 LT the return to northeastward ¯ow only slows down the pre-sunrise decrease in foF2.
3.4 Small-scale features
The same average behaviour is also observed on other nights; however small-scale dierences, mentioned later, appear. Figure 3 shows two sets of results obtained during dierent nights in 1994-1995. The clear ¯uctua-tions observed on the individual foF2 (latitude, time) patterns seem to be essentially due to the meridional plasma ¯ow changes imposed by the neutral wind.
On December 3, 1994 the large evening westward ¯ow is associated with an early decrease in F2 peak density until 00.00 LT. The midnight reversal to northeast wind is immediately followed by an foF2 increase to 9 MHz on the northern side of our zone.
On December 4, 1994 the southward ¯ow lasts until 01.30 LT. This appears to be sucient to deplete entirely the plasma reservoir at higher altitudes and latitudes, the lower range of the southern part of our zone behaving as a recombination well for the equatorial plasma: by 02.00 LT, the entire zone is depleted with foF2 less than 4.0 MHz. Subsequent northward ¯ows remove the plasma in the northern region until 04.00 LT.
On March 3±4, 1995, the evening evolution does not exhaust the plasmasphere reservoir. The southward ¯ow interval 22.30 to 00.30 LT shows only a strong decrease in the southern part of the equatorial zone, and the subsequent northward turn of the wind immediately brings about a large foF2 increase in the entire northern part.
3.5 The problem with slow-scan measurements
As an example of individual variations Fig. 3c shows directly scaled measurements for 6 horizontal wind components representing the individual scans during the night of 3±4 March, 1995. The opposite values of the north versus south and east versus west wind variations (left-side panels) con®rm the quasi-stationarity of the wind components in a ®rst approximation. However the zonal wind ¯uctuations (bottom left and right-side panels) exhibit clear distortions of the opposite sides, in particular during the 22.00 to 02.00 interval. The vector composition of Fig. 3b (identical with the top line on Fig. 3c) is helped by the successive sampling over the six available azimuths. We believe the distortions to be
mostly due to time changes in the north-to-south gradient, but more and faster-acquisition scans are required to discuss these small-scale ¯uctuations.
Direct interpretation of the night-to-night wind phase changes must await a larger data sample.
4 Discussion: mesoscale regimes, ¯uctuations
One aim of the IEEY worldwide project was to test the interactions between the thermosphere and the equato-rial plasma. The West African sector presents excep-tional geomagnetic conditions, with its 11.3°dip latitude oset to the north, following a gradual increase of this oset from the 150°E longitude. Our results give evidence of perturbations superimposed on the average patterns (Fig. 2): strongly asymmetric latitude changes dier from one night to the next. The FPI results allow the ionospheric changes to be directly compared with simultaneous neutral wind vector variations.
Two dierent schemes have been proposed to explain the main driving forces of mesoscale equatorial F2 layer variations during the night.
1. The most consistent experimental models compare the Jicamarca incoherent scatter drifts with results of ground-based optical interferometer variations and with global in situ measurements of plasma drifts, neutral winds and temperatures (see Jenkins et al.,1996). They demonstrate the global convergence of neutral winds towards a night-time area approximately antipodean to the subsolar heating bulge, itself mainly modulated by the seasonal migration in solar declination. They deduce estimates of the various physical momentums in the neutral and plasma motions.
In the case of meridional winds, our results should contribute to the current investigation on the low-latitude circulation due to the midnight temperature maximum (MTM). The recent NCAR simulations (Fes en, 1996) present equinox wind maps under tidal latitude forcings where the meridional wind compres-sion is modulated by relevant semi-diurnal modes. The separate locations of our sightings combined with the asymmetry of our site in geographic and magnetic latitudes will allow empirical comparisons between the various forcings.
2. There still remain the vertical wind motions which combine with equatorial plasma transport of the E ´ B equatorial fountain mechanism. Vertical winds may also couple with global ``breathing'' which generates the nightside convergence, and can possibly drive low-latitude horizontal motions.
With our limited set of comparisons, it is dicult to separate local electric ®eld-induced drift from the various wind drag processes. The most thorough ana-lyses so far performed of night-time equatorial F region variations have emphasised the need for high-resolution measurements. The complex topology of the MTM and winds seems to depend on short period tide-like ampli-®ed modes. The present wind vector variations are self-consistent and are also self-consistent with the simultaneous patterns of F2 peak structure and evolution. However
the determination of ®ne-scale horizontal wind gradient variation would be crucial for physical interpretation, particularly that involving the zonal component. 5 Conclusion
The IFPI wind data presented here are the ®rst observations in Africa, and they greatly help to interpret the complex equatorial dynamics of the F region. The average mesoscale variations observed are typical of magnetically quiet periods. The results of our small-scale network bring evidence of strong latitudinal F2 peak density gradients, consistent with a new type of short-distance variations of the meridional wind. They show meridional summerward velocities continuing the afternoon trend until midnight, with rather abrupt reversals between 00.30 and 02.00 LT. Rapid ¯uctua-tions on the zonal component occur during the post-sunrise phase (1), and in the late night phase (3). These various neutral ¯ows are seen to aect the F2 peak density with very short response times of under 0.5 h, the limit of our time resolution. To describe fully the eects of such rapid changes of thermospheric wind velocity associated on the equatorial F2 plasma struc-turing we need to reduce the acquisition time of the FPI. A main objective of our plans is to upgrade the IFPI at Korhogo.
In order to interpret our data, semi-empirical models (Jenkins et al., 1996) would be very useful as they perform ®ne-scale simulations of time-dependent 2D variations of the fountain and meridional wind drives. They include the variations of photochemical ion production and loss functions, distributed meridian wind, and equatorial upward ion drift. Our thermos-pheric wind observations would permit calibration of the model in the Korhogo area, or could be used as input data for testing new equatorial dynamic models.
Acknowledgements. The funding for the transport of the IFPI from London (UK) to Abidjan (Ivory Coast), the Korhogo Observatory accommodation and the interferometer shelter was given by CNET/SPI at Lannion. The authors thank Prof. Achy Seka, and Mrs Etienne Houngninou, ArseÁne Kobea from the Abidjan Univeristy (Ivory Coast) for their competent support in the setting-up of the project; the dierent CSN French commissioners, F. Jullien, D. Unguran and O. Chiron, who provided the technical support for the experiment. The authors also acknowledge Dr Monique Petitdidier for helpful comments and suggestions.
Topical Editor D. Alcayde thanks J. Meriwether for his help in evaluating this paper.
References
Biondi, M. A., J. W. Meriwether Jr, B. G. Fejer, S. A. Gonzalez, and D. C. Hallenbeck, Equatorial thermospheric wind changes during the solar cycle: measurements at Arequipa, Peru, from 1983 to 1990., J. Geophys. Res., 96, 15 917±15 930, 1991. Colerico, M., M. Mendillo, D. Nottingham, J. Baumgardner, J.
Meriwether, J. Mirick, B. W. Reisnisch, J. L. Scali, C. G. Fesen, and M. A. Biondi, Coordinated measurements of F regions dynamics related to the thermospheric midnight temperature maximum, J. Geophys. Res., 101, A12, 26 783±26 793, 1996.
Fesen, C. G., Simulations of the low-latitude midnight temperature maximum, J. Geophys. Res., 101, A12, 26 863±26 874, 1996. Jenkins, B., B. J. Bailey, M. A. Abdu, I. S. Batista, and N. Balan,
The formation of an additional layer in the equatorial topside ionosphere. To be published in Adv. Space Res., 1996. Kosch, M. J., T. Hagfors, and D. Rees, A new Fabry-Perot
interferometer for atmospheric studies with the EISCAT incoherent radar, Max-Planck- Institute for Aeronomy, Ger-many, Techn. Rep MAPE-010-96-10, 1996.
Hernandez, G., Fabry-Perot interferometers. Cambridge Studies in modern optics, p. 216. Cambridge University Press, 1986. Herrero, F. A., and J. Meriwether, The 630 nm MIG and the
vertical neutral wind in the night-time thermosphere at low latitudes, Geophys. Res. Lett., 21, 97±100, 1994.
Rees, D., I Mc Whirter, A. Aruliah and S. Battern, Upper atmosphere wind and temperature measurements using Fabry-Perot interferometers, WITS Handbook, vol 2, Ed. C.H. Liu, SCOSTEP Secretariat, University of Illinois, pp. 188±223 1989. Sambou E., P. M. Vila, and A. T. Kobea, Non-trough enhance-ments at near-equatorial dip latitudes, Ann. Geophysical, this issue, 1998.
Sipler, D. P., and M. A. Biondi, Equatorial F region neutral winds form nightglow OI 630 nm Doppler shifts, Geophys. Res. Lett., 5, 373±376, 1978.
Spencer, N. W., G. R. Carignan, H. G. Mayr, H. B. Niemann, R. F. Theis, and L. E. Wharton, The midnight temperature maximum in the earth's equatorial thermosphere. Geophys. Res. Lett., 6, 444±446, 1979.