ECONOMIC RISKS OF NUCLEAR POWER REACTOR ACCIDENTS
by
Richard P. Burke
B.S., Massachusetts Institute of Technology 1981
M.S., Massachusetts Institute of Technology 1982
SUBMITTED IN PARTIAL
FULFILLMENT OF THE REQUIREMENTS FOR THE DEGREE OF THE DOCTOR OF PHILOSOPHY
at the
MASSACHUSETTS INSTITUTE OF TECHNOLOGY October 31, 1983
)Massachusetts Institute of Technology, 1983
Signature of Author Certified by_ Thesis Supervisor Certified by ThesM' Supervisor Accepted by
Chairman, Departmental Committee of Graduate Studies
ECONOMIC RISKS OF NUCLEAR POWER REACTOR ACCIDENTS
by
Richard P. Burke
Submitted to the Department of Nuclear Engineering on October
31, 1983 in partial fulfillment of the requirements for the
degree of Doctor of Philosophy.
ABSTRACT
Models to be used for analyses of economic risks from events which occur during U.S. LWR plant operation are
developed in this study. The models include capabilities to estimate both onsite and offsite costs of LWR events ranging
from routine plant forced outages to severe core-melt accidents resulting in large releases of radioactive material to the
environment. The models have been developed for potential use by both the nuclear power industry and regulatory agencies in cost/benefit analyses for decision-making purposes.
The new onsite cost models estimate societal losses from power production cost increases, new plant capital costs, plant decontamination costs, and plant repair costs which may be
incurred after LWR operational events. Early decommissioning costs, plant worker health impact costs, electric utility business costs, nuclear power industry costs, and litigation costs are also addressed.
The newly developed offsite economic consequence models estimate the costs of post-accident population protective measures and public health impacts. The costs of population
evacuation and temporary relocation, agricultural product disposal, land and property decontamination, and land
interdiction are included in the economic models for population protective measures. Costs of health impacts and medical care costs are also included in the models.
The newly developed economic consequence models are applied in an example to estimate the economic risks from operation of the Surry #2 plant. The analyses indicate that economic risks from LWR operation, in contrast %;o public health risks, are dominated by relatively high-frequency forced outage events. The implications of this conclusion for U.S. nuclear power plant operation and regulation are discussed. The
Supervisor: Professor Norman C. Rasmussen Title: Prcfessor of Nuclear Engineering
Supervisor: Dr. David C. Aldrich
Title: Supervisor, Safety and Environmental Studies Sandia National Laboratories
TABLE OF CONTENTS ABSTRACT . . .
*
. . . 2 LIST OF FIGURES .. ... . 9 LIST OF TABLES . ... . . 14 ACKNOWLEDGEMENTS .. .17 BIOGRAPHICAL NOTE ... . . ... 19 CHAPTER 1 INTRODUCTION . . . 20 1.1 BACKGROUND AND SCOPE OF REPORT . . . 201.2 LWR EVENTS AND ECONOMIC CONSEQUENCES . . . 25
1.2.1 CATEGORIZATION OF LWR OPERATIONAL EVENTS . . . 25 1.2.2 DEFINITION OF "OFFSITE" AND "ONSITE" ECONOMIC
CONSEQUENCES . . . 31 1.3 OUTLINE OF REPORT . . . 34
CHAPTER 2 REVIEW OF STUDIES OF LWR ACCIDENT
ECONOMIC RISKS . . . 38 2.1 PREVIOUS STUDIES OF LWR ACCIDENT OFFSITE ECONOMIC
RISKS ... ... 38
2.1.1 THE REACTOR SAFETY STUDY [NU75A,NU75B] . . . 38 2.1.2 ECONO MARC: A METHOD FOR ASSESSING THE COST OF
EMERGENCY COUNTERMEASURES AN ACCIDENT [CL82] . 44 2.1 3 ESTIMATING THE POTENTIAL IMPACTS OF A NUCLEAR
REACTOR ACCIDENT [CA82] . . .. . . 48 2.2 STUDIES WHICH ESTIMATE ONSITE ECONOMIC RISKS . 53 2.2.1 ESTIMATES OF THE FINANCIAL CONSEQUENCES OF
NUCLEAR POWER REACTOR ACCIDENTS [ST82] . 53 2.2.2 "COPING WITH NUCLEAR POWER RISKS: THE ELECTRIC
UTILITY INCENTIVES" [ST81] . . . 57 2.3 SUMMARY OF RESULTS OF PREVIOUS STUDIES . . . . 61
CHAPTER 3 ONSITE ECONOMIC CONSEQUENCES OF LWR EVENTS . . 63 3.1 ONSITE COST COMPONENTS DISCUSSED . . . 63 3.2 DISCOUNT RATE USED IN ESTIMATING SOCIETAL COSTS 64 3.3 REPLACEMENT POWER COSTS . . . . .67
TABLE OF CONTENTS (cont.)
3.3.1 SIMPLIFIED MODEL FOR NUCLEAR PLANT OUTAGE POWER
PRODUCTION COST INCREASES ... 72 3.4 REACTOR PLANT CAPITAL INVESTMENT LOSS AFTER
SEVERE ACCIDENTS ... 82 3.5 PLANT DECONTAMINATION COSTS . . . .86
3.5.1 PLANT DECONTAMINATION COSTS FOR CATEGORY II
EVENTS (MEDIUM CONSEQUENCES) .... 87 3.5.1.1 TMI-2 Accident Experience . . . 87 3.5.1.2 PNL Post-Accident Cleanup Study . . . 98 3.5.2 PLANT DECONTAMINATION COSTS FOR CATEGORY III
(LARGE CONSEQUENCE) EVENTS . . . 100
3.6 PLANT REPAIR COSTS . . . ... 102
3.6.1 REPAIR COSTS FOR CATEGORY I EVENTS . .... 103 3.6.2 REPAIR COSTS FOR CATEGORY II EVENTS . . . 107 3.6.3 REPAIR COSTS FOR CATEGORY III EVENTS . .... 109 3.7 EARLY DECOMMISSIONING COSTS FOR CATEGORY II AND
III EVENTS . . . 110
3.8 WORKER HEALTH EFFECT AND MEDICAL CARE COSTS . 114 3.8.1 HEALTH COSTS FOR CATEGORY I EVENTS . . . 114 3-8.2 HEALTH COSTS FOR CATEGORY II EVENTS . . . 115 3.8.3 HEALTH COSTS FOR CATEGORY III EVENTS . . . 116 3.8.4 CONCLUSION-WORKER HEALTH EFFECTS AND HEALTH
CARE COSTS . . . 117
3.9 ELECTRIC UTILITY "BUSINESS COSTS" AND NUCLEAR
POWER INDUSTRY IMPACTS .
....
... 1183.9.1 ELECTRIC UTILITY "BUSINESS COSTS" ... 118 3.9.2 NUCLEAR POWER INDUSTRY COSTS . . . 122
3.10 ONSITE LITIGATION COSTS . 129
3.11 SUMMARY-ONSITE CONSEQUENCES OF LWR EVENTS . . . . 131 3.11.1 CATEGORY I FORCED OUTAGE EVENTS (SMALL
CONSEQUENCES) . . . 133
3.11.2 CATEGORY II EVENTS (MEDIUM CONSEQUENCES) . . . . 134 3.11.3 CATEGORY III EVENTS (LARGE CONSEQUENCES) . . . . 136 3.11.4 ESTIMATION OF LWR ECONOMIC RISKS . . . 137
CHAPTER 4 OFFSITE ECONOMIC CONSEQUENCES OF LWR EVENTS . 139
4.1 LWR ACCIDENT OFFSITE COSTS DISCUSSED . . . 140
4.1.1 DEFINITION OF TERMS USED IN DISCUSSION . . . . 141 4.2 REVIEW OF POPULATION RADIATION EXPOSURE PATHWAYS
FOLLOWING LWR ACCIDENTS . 142
4.3 MODELING OF STAGED OFFSITE PROTECTIVE MEASURE
TABLE OF CONTENTS (cont.)
4.4 NEW OFFSITE COST MODELS . . . 150
4.4.1 POPULATION EVACUATION COSTS . . . 150
4.4.2 EMERGENCY PHASE RELOCATION . . . 158
4.4.3 INTERMEDIATE
PHASE
RELOCATION..
.. ....
. . 161
4.4.4 AGRICULTURAL PRODUCT DISPOSAL . . . 163
4.4.4.1 Food (Crop) Product Disposal . ... . 163
4.4.4.2 Milk and Dairy Product Disposal . .. . . 165
4.4.5 LONG-TERM
PROTECTIVE
ACTIONS
. . . .
....
. . 166
4.4.5.1 Decontamination Of Land And Property . . . 167
4.4.5.2 Land Area Interdiction . . . 182
4.4.6 HEALTH EFFECTS COSTS . . . 193
4.5 OFFSITE COSTS NOT INCLUDED IN THE NEW ECONOMIC MODELS . . . 199
4.5.1 OFFSITE LITIGATION COSTS . . . .. 199
4.5.2 SECONDARY IMPACTS .. . 199
4.6 COMPARISON OF CRAC2 AND NEW ECONOMIC MODELS . . 203.
4.7 PROTOTYPE ECONOMIC MODEL USED IN THIS STUDY .. . 205
4.8 CONCLUSIONS .. . . . 209
CHAPTER 5 ECONOMIC RISKS FROM SMALL CONSEQUENCE LWR EVENTS . . . 210
5.1 LWR FORCED OUTAGE EVENTS INCLUDED IN CATEGORY I (SMALL CONSEQUENCES) . . . .211
5.2 DATA BASE FOR LWR FORCED OUTAGE EVENTS . . . . .211
5.3 DISTRIBUTION OF LWR FORCED OUTAGE FREQUENCIES . 214 5.4 DISTRIBUTION OF LWR FORCED OUTAGE EVENT DURATIONS 225 5.4.1 FREQUENCY DISTRIBUTION OF FORCED OUTAGE DURATIONS . . .
.
. . .. . . . .2275.5 DISTRIBUTION OF ECONOMIC RISK FROM CATEGORY I FORCED OUTAGES . . . 230
5.6 PRESENT VALUE OF LIFETIME INTEGRATED ECONOMIC RISKS . . . ... . 237
5.7 PREVIOUS ESTIMATES OF FORCED OUTAGE ECONOMIC RISKS . . . 240
5.8 SENSITIVITIES AND UNCERTAINTIES . . . .246
5.9 SUMMARY AND DISCUSSION . . . .249
TABLE OF CONTENTS (cont.)
CHAPTER 6
CONSEQUENCE
ECONOMIC RISKS FROM MEDIUM AND LARGELWR
EVENTS
....
..
257
6.1 INTRODUCTION .
..
....
. . . 2576.2 ESTIMATED SEVERE ACCIDENT ECONOMIC RISKS BASED ON CATEGORY II COSTS . . . 259
6.2.1 PLANT REPAIR AFTER CATEGORY II EVENTS .260 6.2.2 EMERGENCY RESPONSE COSTS FOR CATEGORY II EVENTS 261 6.2.3 PRESENT VALUE OF LIFETIME-INTEGRATED ECONOMIC RISKS FOR SURRY 2 . . . . .. 261
6.3 ESTIMATED SEVERE ACCIDENT ECONOMIC RISKS BASED ON CATEGORY III COSTS ... 265
6.3.1 RSS PWR CORE-MELT ACCIDENT SOURCE TERMS . . . 267
6.3.2 SITE-SPECIFIC DATA USED IN THE OFFSITE ECONOMIC CONSEQUENCE CALCULATIONS ... 269
6.3.3 POPULATION PROTECTIVE MEASURE ASSUMPTIONS . . 274
6.3.4 DISTRIBUTIONS OF CORE-MELT ACCIDENT ECONOMIC CONSEQUENCES AT SURRY 2 ... . .. 275
6.3.5 PRESENT VALUE OF LIFETIME-INTEGRATED CORE-MELT ECONOMIC RISKS FOR SURRY #2 . . . 284
6.4 UNCERTAINTIES IN ECONOMIC RISK ESTIMATES ... 287
6.4.1 RANGE OF RISKS FOR OTHER PLANTS . . . .. 289
6.5 COMPARISON OF CORE-MELT ECONOMIC CONSEQUENCE ESTIMATES WITH RESULTS OF PREVIOUS STUDIES . . . . 293
6.6 SENSITIVITY STUDIES OF CORE-MELT ACCIDENT OFFSITE ECONOMIC CONSEQUENCES . . . 299
6.6.1 SENSITIVITY OF OFFSITE COSTS TO SOURCE TERMS . . 300
6.6.2 SENSITIVITY OF OFFSITE COSTS TO PROTECTIVE MEASURE IMPLEMENTATION CRITERIA . . . 302
6.6.3 COST/BENEFIT ANALYSIS OF POST-ACCIDENT
COUNTERMEASURES
. . . . ....
...
305
6.7 COMPARISON OF ROUTINE OUTAGE AND SEVERE ACCIDENT ECONOMIC RISKS FOR SURRY #2 . . . 309
6.8 SUMMARY AND CONCLUSIONS . . . 313
CHAPTER 7 SUMMARY AND CONCLUSIONS . . . 317
TABLE OF CONTENTS (cont.)
APPENDICES
APPENDIX A U.S. LWR OPERATION EXPERIENCE DATA BASE .
APPENDIX B
APPENDIX C
ANALYSIS OF REGULATORY FORCED OUTAGES FROM 1974-1980 . . . .
BEA ECONOMIC ANALYSIS METHODOLOGY
AND RESULTS . . . .
.
. . 412.
. . 422 BASIC INPUT-OUTPUT METHODOLOGY . . . .ANALYSIS OF BEA RESULTS . . . .
. . 422
*
. . 430 APPENDIX D D.1 D.2 D.3ANALYSIS OF LWR FORCED OUTAGE DATA BASE FORCED OUTAGE FREQUENCY VERSUS REACTOR PLANT POSSIBLE CORRELATIONS BETWEEN FORCED OUTAGE
DURATION, FREQUENCY, AND PLANT AGE . . . . .
CONCLUSIONS . . . . . . . 440 AGE
*
. 441 . . 449 . . . 454 APPENDIX E APPENDIX FDOSE PROJECTIONS IN THE PROTOTYPE
OFFSITE ECONOMIC MODEL . . . 456
LISTING OF PROTOTYPE OFFSITE ECONOMIC
CONSEQUENCE MODEL . . .. . . 462 . . 343
C.1 C.2
LIST OF FIGURES
Figure 1.1 - Example of LWR economic risk distribution . . Figure 1.2 - Event severity categories defined for
estimation of economic risks . . . . Figure 2.1 - RSS estimate of offsite economic risks from
a typical U.S. nuclear power plant [Nu75b] Figure 2.2 Figure 2.3 Figure 2.4 -Figure 3.1 Figure 3.2 Figure 3.3 Figure 3.4 Figure 3.5 Figure 3.6 Figure 3.7
-RSS comparison of economic risks from 100 nuclear power plants and other sources
[Nu75a] . . . .. . .
Temporary nature of GDP loss due to
population protective measure implementation [C182] . . . . Estimated utility and public economic risks for reactor outages and accidents [St81] Relationship between power production cost increase and non-economy power fraction
[Bu82] .. .. . . .
Regional Electric Reliability Councils of the National Electric Reliability Council [Na81] . . . . Replacement power cost increases and new replacement plant capital costs in example problem . . . .
Flowchart of post-accident actions for
LWR event categories . . . . Projected expenditures on TMI-2
decontamination program versus time [GP81] Total projected cost of TMI-2 decontamination program versus discount rate . . . . Total projected cost of TMI-2 decontamination program including escalation and
discounting . . . . 42 47 59 74 76 85 88 91 94 95 26 28 41
LIST OF FIGURES (cont.)
Figure 3.8 - Estimated TMI-2 decontamination program costs for various program durations ... 97
Figure 3.9 - Plant repair cost for LWR forced outage
events from historical data ... . 105 Figure 4.1 - Example of protective action implementation
areas for severe LWR accidents [Nu75b] . . 145 Figure 4.2 - Staged protective action implementation model
used for estimating offsite costs ... 147
Figure 4.3 -
Flowchart
of
new
economic
model.
. . .
.
. 204
Figure 4.4 - Flowchart of CRAC2 economic model . . . 207 Figure 4.5 - Flowchart of prototype offsite economic
consequence model ...
208
Figure 5.1 - Histogram of forced outage frequency data
for all LWRs, 1974-1980 . . . 217
Figure 5.2 - CCDFs of forced outage frequency for BWRs,
PWRs, and all LWRs, 1974-1980 . . . 218
Figure 5.3 - Histogram of plant-average forced outage
frequency data for the years 1974-1980 . . . 222
Figure 5.4 - CCDFs
of plant-average forced outage
frequency
for BWRs, PWRs, and all LWRs,
1974-1980 . . . .223
Figure 5.5 - Histogram of LWR
forced outage event
duration data for the years 1974-1980
.
..
228
Figure 5.6 - CCDF
of forced outage durations conditional
upon event occurrence
for BWRs, PWRs, and
all LWRs, 1974-1980 . . . 229
Figure 5.7 - Complementary cumulative frequency
distributions of forced outage durations for
LIST OF FIGURES (cont.)
Figure 5.8 - Economic risk distribution for category I
outages at an "average" 1000 MWe LWR in 3 NERC regions . . . . Figure 5.9 - Comparison of forced outage duration
distributions with those from EPRI study Figure 5.10 - Comparison of category I economic risk
distribution to electric utility risk
distribution from EPRI study . . . . Figure 5.11 - CCDF of LWR plant availability losses during the 1974-1980 period . . . . Figure 6.1 - Map of counties and consequence calculation
grid within 500 mile radius of Surry site . . Figure 6.2 - Map of counties and consequence calculation
grid within 50 mile radius of Surry site . . Figure 6.3
Figure 6.4
-Distributions of core-melt accident economic risks for remaining lifetime of Surry #2
plant (based on loss of single unit) . . . . Distributions of core-melt accident economic risks for remaining lifetime of Surry 2
plant (based on loss of both units) . . . . Figure 6.5 - Comparison of PRA core-melt frequencies
[Ha83] . . . . 277
280
290
Figure 6.6 - Mean cost/benefit ratios for offsite protective
measures after an SST1 release at the
Surry site ... . 307 Figure B.1 - Total number of commercially operating
U.S. nuclear power plants versus time . . . . 413 Figure B.2 - Average U.S. LWR availability versus time . . 415 Figure B.3 - Total percentage of reactor-years lost in
regulatory outages . . . 417 235 242 245 254 272 273
LIST OF FIGURES (cont.)
Figure B.4 - Total reactor hours involved in regulatory
outages . . . .. . 418 Figure B.5 - Average forced and scheduled outage time of
U.S. LWRs. ... .. . .. . . 420
Figure C.1 - Comparison of BEA affected areas versus
typical Gaussian plume predictions . . . 429
Figure C.2 - Comparison of BEA affected areas versus
widest Gaussian plume predictions . .. . 431 Figure C.3 - Total study area employment for sites
considered in BEA studies . . . 433 Figure C.4 - BEA non-compensated direct job loss
predictions versus interdicted area
population . . . 435 Figure C.5 - BEA partially compensated direct job loss
predictions versus interdicted area
population . . . 436 Figure C.6 - BEA fully compensated direct job loss
predictions versus interdicted area
population
.
. . .437
Figure D.1 - Forced outage frequency versus plant age for plant size groups . . . 442 Figure D.2 - Forced outage frequency versus LWR age for
plant type groups . . . 445 Figure D.3 - Forced outage frequency versus LWR age for
plant NSSS vendor groups . . . 446 Figure D.4 - Mean duration of forced outages versus
number of forced outage events in each
reactor-year . . . 450 Figure D.5 - Mean duration of forced outage events
LIST OF FIGURES (cont.)
Figure D.6 - Total duration of forced outage events
in year versus LWR age ... ... 453 Figure E.1 - Contributions of isotopes to whole-body
groundshine doses for the SST1 release
LIST OF TABLES
Table 1.1 - LWR event costs discussed in this study . . . 35 Table 2.1 - Results of BEA analysis of an SST1 release
with WNW wind direction at the St. Lucie
site [Ca82] . . . .. . . 51 Table 2.2 - Mean financial risk estimates for core-melt
accidents at Surry Unit #2 [St82] . . . 55 Table 2.3 - Expected values of public and utility risks
from LWR outages and accidents [St81] . . . . 60 Table 3.1 - Typical utility operating procedures for
short duration outages [Bu82] .. . . . 69 Table 3.2 - Average fraction of oil-fired and non-economy
replacement energy by NERC region [Bu82] . . . 77 Table 3.3 - Results of PNL study of post-accident cleanup
costs [Mu82b] . . . 99 Table 3.4 - Summary of cost estimates for decommissioning
large LWR facilities . . . .... 111
Table 3.5 - Loads and generating capacities of NERC regions in 1980 and projections for 1990
[Bu82] . . . .. . . . 123 Table 3.6 - Summary of estimates and models for onsite
costs of LWR events . . . 132 Table 4.1 - Symbols used in offsite model discussion . . . 151 Table 4.2 - Costs of evacuation per evacuee-day [Ha74] . . 156 Table 4.3 - Decontamination cost and effectiveness for
farm areas [Os83] ... . . . 170
Table 4.4 - Decontamination cost and effectiveness for
non-farm areas [Os83] . . . 172 Table 4.5 - Estimates of economic costs of
LIST OF TABLES (cont.) Table 5.1 Table 5.2 Table 5.3 Table 5.4 -Table 5.5 Table 6.1 Table 6.2 Table 6.3 Table 6.4 Table 6.5 Table 6.6
-Statistical parameters of data used to
estimate forced outage frequency . . . . Statistical parameters of data used to
estimate plant-average forced outage
frequencies .
...
. . .....
Statistical parameters of data used to estimate forced outage event durations . .
Expected costs of category I forced outage events per reactoryear of operation -"Average" LWR plant, 1000 MWe, MAAC
NERC region . . . . Present value of lifetime integrated
category I forced outage event economic risks for Surry 2, based on generic event
frequency estimates . . . .. Present value of severe accident economic risks based on category II event costs, remaining lifetime of Surry 2 plant . Summary of RSS PWR accident source terms
[Nu75b] . . . . Contribution of PWRlA-PWR7 core-melt accident categories to lifetime-integrated economic risks, Surry 2, single unit loss . . . . .. Lifetime core-melt accident economic risks for Surry 2 based on loss of single generating
unit .. . . . .
Present value of severe accident economic risks based on category III event costs, remaining lifetime of Surry 2 plant . . . .
Comparison of new model predictions and results from NUREG/CR-2723 for the SST1
release, Surry reactor . . . . 216 220 226 236 241 263 268 281 283 285 295
LIST OF TABLES (cont.)
Table 6.7 - Comparison of offsite cost estimates from CRAC2 and new models, conditional on SST1 accident
release, Surry #2 plant . . . 297 Table 6.8 - Sensitivity of offsite economic consequences
to source term definition, Surry #2,
SST1 release category . . . 301 Table 6.9 - Sensitivity of offsite costs to long-term
protective action implementation criterion,
SST1 release, Surry #2 plant . . . 304 Table 6.10- Present value of category I and
category II & III event economic risks for
remaining life of Surry #2 plant . . . . . 310 Table C.1 - Example of a regional transaction table
[Ca82] . . . 424 Table C.2 - Definition of protective measure output
effects in BEA analyses [Ca82] . . . .. 427 Table C.3 - Definition of counties included in BEA
analysis for SST1 release, St. Lucie site,
ACKNOWLEDGEMENTS
This research was performed under appointment to the Nuclear Science and Engineering and Health Physics Fellowship program administered by Oak Ridge Associated Universities for the U.S. Department of Energy. The financial and technical support provided for this study by Sandia National
Laboratories, Albuquerque, New Mexico, under contract to the U.S. Nuclear Regulatory Commission, is also gratefully
acknowledged.
The author feels honored and privileged to have worked under the supervision of Professor Norman C. Rasmussen of M.I.T. and Dr. David C. Aldrich of Sandia National
Laboratories. Both provided invaluable guidance and insights which aided tremendously in the completion of this research and
in the professional development of the author. Professor
Carolyn D. Heising is also gratefully acknowledged for serving as thesis reader.
The author also wishes to express appreciation for the technical assistance and useful advice provided by Dr. Daniel J. Alpert, Robert M. Ostmeyer, Lynn T. Ritchie, and Dr. David R. Strip of Sandia National Laboratories, Wayne D. Holmes of American Nuclear Insurers, and Roger M. Blond of the
The many other individuals who in some way influenced this effort are also gratefully acknowledged.
Lastly, the author wishes to express gratitude for the encouragement of his family, and the spiritual help of Miss Pamela Pries.
BIOGRAPHICAL NOTE
Richard P. Burke was born and raised in Cincinnati, Ohio. He entered the Massachusetts Institute of Technology in 1977 and received the B.S. degree in Nuclear Engineering in 1981, and the M.S. degree in Nuclear Engineering in 1982. While at M.I.T. he worked on research projects concerning BWR
suppression pool fluid dynamics, steam generator
thermal-hydraulic modeling, LWR accident offsite emergency response, and economic risks from commercial LWR operation.
Since 1981 he has undertaken several research projects related to reactor safety in conjunction with Sandia National
Laboratories in Albuquerque, New Mexico. His academic honors include the Nathan Bilgore Scholarship sponsored by the
National Distiller's Distributors Foundation (1977-1981), the Charles T. Chave Scholarship awarded by the American Nuclear
Society (1979), and a Nuclear Science and Engineering and
Health Physics Fellowship sponsored by the U.S. Department of Energy (1982-1983).
CHAPTER 1 INTRODUCTION
1.1 BACKGROUND AND SCOPE OF REPORT
The risk to society posed by potential accidents at commercial nuclear power reactors in the U.S. has been a focus of research for the past decade. Significant efforts have been made to estimate the potential public health
impacts of severe LWR accidents. Another aspect of LWR accident risk involves the societal economic impacts or costs of an accident. Financial risk measures can be defined independently of accident public health risks, or
cost measures can be defined to represent all of the
negative attributes of the consequences of an event. This report develops and employs analytical methods to
LWR accidents.+
Recent developments in the U.S. nuclear power
regulatory process have created a need for analytical tools which provide estimates of the economic risks of reactor accidents. The U.S. Nuclear Regulatory Commission (NRC) has recently proposed safety goals for guidance in the regulatory decision-making process regarding LWR safety. The goals include criteria for public health risks imposed by plant operation, along with a cost/benefit criterion to be used in evaluating plant improvements for potential risk
reduction [Nu80a, Nu82a]. Ideally, the NRC should
incorporate information regarding both costs and benefits (or costs avoided) into decisions regarding LWR accident risk reduction systems. It is necessary to understand the LWR economic risk spectrum to estimate the risk reduction potential of various plant safety system modifications and develop logical decision bases regarding the effectiveness of plant improvements. Also, it is important to identify
+ The terms "economic risk" and "financial risk" are used synonymously in this study to refer to the frequencies and societal costs of LWR events. Costs include the benefits
the range of events for which licensee financial incentives for accident prevention exist so that regulation can be focused appropriately.
Another issue which has recently been under review by the NRC is the insurance requirements for U.S. nuclear power reactors. The requirements for licensee purchase of onsite property damage indemnity insurance have recently been upgraded by the NRC in light of the experience with severe accident costs at Three Mile Island Unit 2 ;Lo82]. Requirements for offsite property damage liability,
currently limited by the Price-Anderson Act, have also been under recent review. It is necessary to combine accident cost and frequency estimates to evaluate the spectrum of LWR economic risk for consideration in decisions regarding nuclear power reactor insurance requirements.
Analysis of LWR economic risks is useful for
decision-making within the U.S. nuclear power industry. The accident at Three Mile Island Unit 2 dramatically demonstrated that plant licensees may incur very
significant costs for events which have negligable offsite costs. After the accident at TMI, nuclear industry
borne by utilities which own shares of nuclear power plants [St81]. The nuclear insurance industry is also very
concerned with the frequencies and costs of nuclear power reactor accidents for rate-making and risk coverage
purposes.
The goal of this report is to develop LWR accident economic risk analysis methods and estimates for use in the
regulatory decision-making process. Therefore, the
estimates and methods developed focus on LWR accident costs from a societal viewpoint. There are many groups or
organizations which may ultimately bear some of the costs of an LWR event. The transfer payments between parties which lead to the ultimate distribution of costs after an accident are addressed in less detail in this report. The potential transfers after accidents are complex because of the many groups with an interest in the nuclear power and electric utility industries. Societal costs are estimated
in this report by accounting for losses which directly affect the plant licensee, the public, the nuclear
industry, or the electric utility industry after LWR
events. Clearly, a particular organization or group may be interested in specific costs and not interested in other costs based on liability for losses incurred. For specific
interest groups it is important to carefully investigate the distributions of losses in addition to the societal cost estimates contained in this report. These issues are addressed in other economic studies, but are not included
in detail in this investigation.
Societal accident costs are calculated in this report within a probabilistic risk framework. One of the most important and difficult aspects of this effort has been in estimating the uncertainties associated with the cost
distributions presented. Estimation of accident costs must necessarily involve information regarding accident physical processes, radionuclide release and behavior in the
environment, methods and costs for accident mitigation measures, costs for losses incurred, and future policy decisions which would be made after severe accident
occurrence. Uncertainties exist in both event frequency and consequence estimates for LWR accidents. Both
subjective and analytical analysis techniques are used to develop rough estimates of the uncertainties in the LWR economic risk values preserted in this report. Clearly, further research is required to accurately estimate the uncertainties in LWR accident frequencies and consequences. As new information regarding LWR accident risks becomes
available, updated uncertainty estimates should be incorporated.
1.2 LWR EVENTS AND ECONOMIC CONSEQUENCES
A wide range of possible events can occur during LWR operation which can have societal economic impacts ranging from benign to severe. Because of the range of economic
consequences of LWR events, it is useful to discuss a
spectrum of LWR economic risk. The spectrum can be represented by a distribution of event frequency versus cost (or event frequency versus severity). An example of the LWR risk spectrum which is discussed in this report is
shown in Figure 1.1. This distribution is a complementary
cumulative frequency distribution of LWR event costs which shows the frequency of events resulting in costs greater than a specified magnitude.
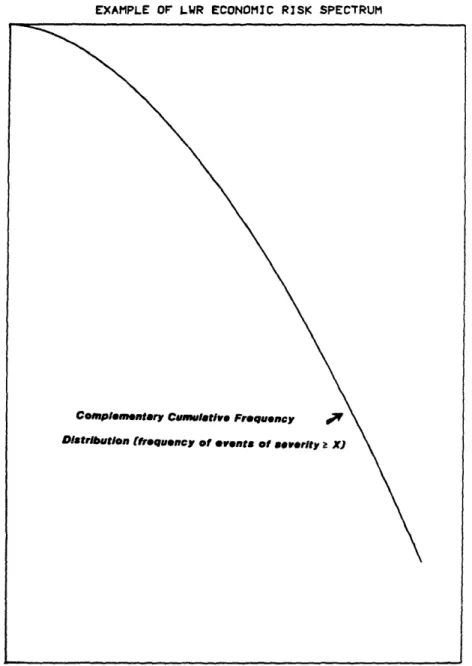
1.2.1 CATEGORIZATION OF LWR OPERATIONAL EVENTS
The events which comprise the LWR economic risk
spectrum are divided for discussion in this study. Three event categories are defined based on the severity of LWR operational events which result in societal costs. This
Figure 1.1 - Example of LWR economic risk distribution.
EXAMPLE OF LWR ECONOMIC RISK SPECTRUM
a i I V) C)xw -JIo
t)
a n Co I-- 1-Li 0 ffdivision of the economic risk spectrum and category
definitions used in this report are shown in Figure 1.2. The discussion of LWR economic risk includes only those events which occur during the operational life of an LWR and not those events which might occur during plant
construction or decommissioning.
Event category I is defined to include all forced outage events at LWR facilities which do not result in core-damage or significant plant contamination (small consequence events). These events, some of which occur routinely during the life of a nuclear power plant, are not scheduled or planned in advance (in contrast to refueling or scheduled maintenance outages). The events result in unplanned plant forced outage time (outage time refers to a time period of zero power production from the plant), and the maximum outage duration included in this category is on the order of a few years. The events in this category may result from spurious plant trips, operator errors,
unscheduled maintenance requirements, external events, or a variety of plant system failures. There are no offsite radiation-induced public health impacts or property damage costs resulting from these events. Plant outages caused explicitly by regulatory orders (i.e., plant shutdowns
Figure 1.2 - Event severity categories defined of economic risks.
for estimation
CATEGORIZAT2ON OF LR EVENTS FOR RISK SPECTRUM FORMATION
CA TEGORY I
(Small Conaequence
Event,)
ROUTINE OPERATIONAL EVENTS, NOT SCHEDULED, NO SIGNIFICANT OFFSITE COSTS, NO SIGNIFICANT PLANT DECONTAMINATION NECESSARY, NO CORE DAMAGE, CATEGORY I fMedlum Consequaene Evento)
LOW FREQUENCY EVENTS, LONG OUTAGE DURATION OR POSSIBLE EARLY DECOMMISSIONING,
CORE-DAMAGE EVENTS WITHOUT
PRESSURE VESSEL MELT-THROUGH, NO SIGNIFICAN1 RELEASE OF RADIOACTIVE
MATERIAL, NO OFFSITE PUBLIC HEALTH IMPACTS
OR PROPERTY DAMAGE.
- h~~~~~
CA TEGORY 111
(Lrge ConJequence
Eventa)
EXTREMELY LOW FREQUENCY
EVENTS, LIKELY EARLY
PLANT DECOMMISSIONING, SIGNIFICANT PLANT DECONTAMINATION REQUIRED, POSSIBLE RELEASE OF RADIOACTIVE MATERIAL RESULTING IN OFFSITE HEALTH IMPACTS AND
PROPERTY DAMAGE.
COST CAUSED BY EVENT (DOLLARS)
CO w 0 v LiJ U.(o .) L z CDz I--J U. -l I . --- - - | -\x
mandated by the NRC for regulatory reasons) are not
included in this category but are discussed separately in Appendix B.
Event category II is defined to nclude LWR accidents resulting in core-damage and possible fuel melting but which do not result in breach of the reactor vessel or any significant release of radioactive material to the
environment (medium consequence events). These accidents result in the need for a plant decontamination effort followed by either repair or decommissioning of the plant after cleanup. LWR events resulting in fuel damage or
core-melt are included in this category only if the reactor vessel is not breached by molten material (i.e., vessel melt-through). There are no significant offsite health and property damage impacts resulting from category II events. Plant forced outages resulting from events in this category are likely to last many years if the plant is repaired, or may be permanent if decommissioning is begun immediately
after plant cleanup.
Event category III is defined to include all LWR accidents which result in severe core-damage and either reactor vessel breach (i.e., vessel melt-through) or a
significant release of radioactive material to the environment (large consequence events). This category
includes severe core-melt accidents which have been
predicted to dominate the public health risks from nuclear plant operation in the U.S. [Nu75a]. Severe accidents which do not result in releases of radioactive material to the environment but do result in reactor vessel
melt-through are included in this category. The accidents in this category may result in offsite public health
impacts and property damage costs. There is a need for a plant decontamination and cleanup program before plant repair or decommissioning. These events have not been experienced in U.S. commercial nuclear power plant
operation to date and are predicted to be extremely rare.
Each of these accident groups is di-cussed in
estimating LWR economic risks in Chapters 5 and 6. The contribution of events of different severities to the overall economic risk from LWR operation is discussed.
1.2.2 DEFINITION OF "OFFSITE" AND "ONSITE" ECONOMIC CONSEQUENCES
The discussion of LWR accident economic consequences in this report is divided based on the location of
occurrence of resulting losses and the organizations
directly impacted by losses. Two groups of accident costs are discussed, one which encompasses mainly those costs which occur at offsite locations, and another which
includes losses which directly affect the plant licensee, the nuclear power industry, the electric utility industry, or occur at onsite locations. This division of accident consequences is not strict in the sense that some costs may
first affect the plant licensee, and ultimately be transferred to consumers at offsite locations.
"Offsite costs" include those costs which directly affect the public or occur at offsite locations. The offsite economic consequences of reactor accidents which are discussed in this report include costs associated with the countermeasures taken to reduce population radIiation exposure after a contaminating event, the offsite property damage or losses which occur as a result of an event, the costs of radiation-induced health effects and health care
costs incurred by the population living at offsite
locations, and indirect or secondary costs which may occur outside of contaminated areas at offsite locations.
Specific offsite cost components include population evacuation and temporary relocation costs, agricultural product disposal costs, property decontamination costs, land area interdiction and permanent relocation costs, population health effect and health care costs, secondary economic effect costs, and offsite litigation costs. These costs are discussed in the development of LWR accident
offsite economic risk models.
"Onsite" ccident economic consequences include those cost components which most directly affect the plant
licensee, electric utilities, the nuclear power industry, or occur at onsite locations. The onsite economic
consequences of reactor accidents which are discussed in this report include replacement electric power costs, plant decontamination and repair costs, plant capital costs,
early decommissioning costs, electric utility "business costs", nuclear industry impacts, plant worker health effect costs, and litigation costs which directly affect the plant licensees as a result of an accident. These cost components are discussed in the development of LWR accident
onsite economic risk models.
The methods chosen for estimating LWR accident economic consequences in this study are based on three anticipated applications of the newly developed models:
1. Estimation of the absolute onsite and offsite
economic risks posed by LWR operation in the U.S.,
2. Site-specific analysis of onsite and offsite economic risks for use in regulatory siting, cost/benefit, or risk reduction decisions,
3. Generic and site-specific analyses of offsite
emergency response costs and consequence reduction benefits for use in decisions regarding emergency planning and post-accident population protective action implementation.
The projected model applications significantly influence the choice of economic consequence models and accident impacts which are examined in this study.
1.3 OUTLINE OF REPORT
Studies have been performed to estimate the economic risks resulting from events in specific portions of the LWR event spectrum. Chapter 2 of this report reviews results and conclusions from previous studies concerning the
economic risks of LWR accidents. Previous and coincident studies of specific topics regarding LWR accident economic risk are discussed. Models previously developed to
estimate the economic consequences of LWR events are also reviewed.
Onsite costs of LWR accidents are discussed in Chapter 3 of this report (see Table 1.1). Onsite cost component models and estimates are developed for all unanticipated
LWR events. Available models are combined with historical data, insurance claim data, and engineering-based cost projections to form estimates of onsite accident costs.
Impacts which are not easily quantified in economic terms are discussed, and uncertainties in event costs are also addressed.
Table 1.1 - LWR Event Costs Discussed in this Study
Chapter 3
Onsite Costs for Small, Medium, and Large Consequence Events Replacement Power Costs
Plant Capital Costs
Plant Decontamination/Cleanup Costs Plant Repair Costs
Early Decommissioning Costs Onsite Litigation Costs
Worker Health Effect Costs Worker Medical Care Costs Electric Utility "Business
Costs"
Nuclear Power Industry Costs
Chapter 4
Offsite Costs for Medium and Large Consequence Events
Evacuation Costs Decontamination Program Costs Temporary Relocation Costs Land Area Interdiction Costs Agricultural Product Disposal Costs Permanent Relocation Costs Secondary Impact Costs Offsite Litigation Costs Public Medical Care Costs Public Health Effect Costs
The offsite economic consequences of severe LWR accidents are discussed in Chapter 4 of this report (see Table 1.1). A new offsite economic consequence model is developed for use in LWR economic risk calculations. The new offsite economic consequence model is compared to
previous models, and data availability and limitations are discussed.
The economic risk of small consequence LWR events is discussed in Chapter 5 of this report. Historical
U.S. nuclear plant operating experience from he years 1974-1980 is used to estimate the frequency of LWR events in this category. The data are used to estimate
distributions of event -frequencies and severities for U.S. LWRs. The frequency estimates are combined with onsite cost models to estimate the expected losses from
small consequence LWR events. Potential risk reduction measures for small consequence LWR events are also
discussed.
The economic risks of medium and large consequence LWR accidents are discussed in Chapter 6. The newly developed onsite and offsite economic impact models are applied to estimate societal risks from the operation of the Surry
reactor plant which was studied in the RSS Nu75a]. Model predictions are compared with the results of previous
studies which employed the CRAC2 economic model to estimate economic risks. The sensitivities of predicted offsite costs to source term definition and post-accident
protective action implementation criteria are examined. The new offsite cost models are used in an example
cost/benefit analysis of offsite protective action
implementation for severe accidents. The expected losses from core-melt accidents are compared with losses from less severe events to estimate the relative importance of low versus high frequency events. The large uncertainties in the probabilities of severe LWR accidents are also
discussed.
Finally, conclusions and recommendations concerning the predicted accident economic risks and the use of models to estimate LWR accident economic risks are outlined in Chapter 7. Recommendations for further model development
and applications of the newly developed models are also discussed.
CHAPTER 2
REVIEW OF STUDIES OF LWR ACCIDENT ECONOMIC RISKS
The results of previous studies of LWR accident economic risks are reviewed in this section. The discussion is divided into two sections which review
studies which focus on "onsite" and "offsite" economic consequences of LWR accidents.
2.1 PREVIOUS STUDIES OF LWR ACCIDENT OFFSITE ECONOMIC RISKS
2.1.1 THE REACTOR SAFETY STUDY [NU75A,NU75B]
Estimates of the offsite economic risks of LWR
accidents are contained in The Reactor Safety Study (RSS) [Nu75a,Nu75b] which was sponsored by the Atomic Energy
public risks which result from the operation of commercial nuclear power plants in the U.S. The study formed realistic estimates of public risks from nuclear power plants and compared these risks with non-nuclear risks in society.
The property damage estimates in the RSS are based on
cost estimates for public protective measures which may be taken after severe LWR accidents. No estimates of onsite damage or possible secondary+ offsite costs from reactor accidents were included in the RSS. The economic risk estimates contained in the RSS are based on results calculated with the CRAC consequence model [Nu75b].
The offsite loss estimates presented in the Reactor Safety Study include the costs of population evacuation, milk and crop disposal, decontamination of contaminated
areas, and interdiction (or the prohibition of the use of) land areas and tangible wealth and resultant population relocation from interdicted areas. The need for
decontamination or interdiction of land areas was
determined primarily by concentrations of surface-deposited
+ Secondary costs refer to potential accident offsite impacts outside of directly contaminated areas.
long-lived isotopes (Cs-134, Cs-137) in the CRAC model. For a very large release of radioactive material,
evacuation and milk and crop disposal costs each contributed approximately 10%, decontamination costs contributed about 20%, and land area interdiction costs
contributed about 60% to the total offsite costs of a
typical severe accident calculated with the CRAC model
[Nu77a].
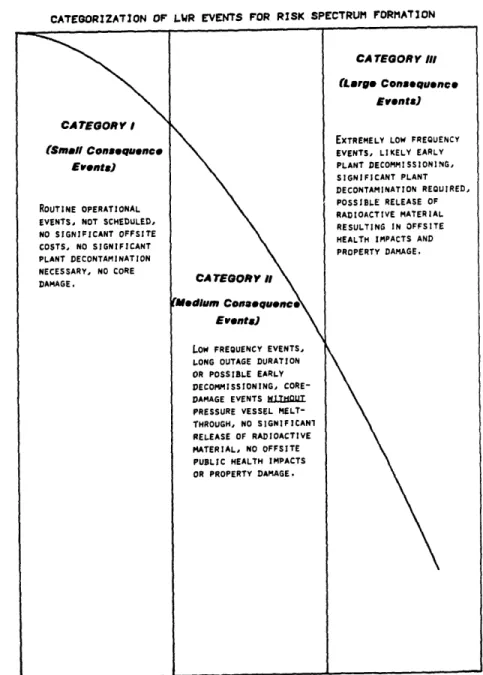
The offsite property damage risk profile estimated for a typical U.S. LWR in the RSS is shown in Figure 2.1. The damage estimates shown are in 1974 dollars. A comparison of property damage risk estimates for an industry of one hundred similar nuclear power plants and for man-caused and natural events in the U.S. is shown in Figure 2.2. The majority of man-caused property damage resulted from fires.
Natural events causing significant property damage included forest fires, hurricanes, and earthquakes. Nuclear plants were estimated to be about one hundred to one thousand
times less likely to cause comparable large dollar value accidents than other sources. All of the property damage estimates for LWR accidents contained in the RSS were based on the accident economic consequence model contained in the CRAC code (Calculation of Reactor Accident Consequences),
Figure 2.1 - RSS estimate of offsite economic risks from a typical U.S. nuclear power plant [Nu75b].
x
Al 14 0 4. U 4i. .94 .Q 0 A4 "-wA-MW
Nm,
dMWW
_.
_
bV cErt of I ond 2 an mmquMe. um i tk ad by
Figure 2.2 - RSS comparison of economic risks from 100 nuclear power plants and other sources [Nu75a].
1/10 1/10 I Natural Caused I Events 1/100---- I I/rooo
----"'---l---II| \ loo Nuhw
Doao --- _
I
i
1/1c 1/1.0 107 10p 109 10T 1011Property Danm (Dollars)
1
111
,o6
which is discussed
and compared to
the
newly developed
economic consequence model in Chapters 4 and 6 of this
report.
The property damage estimates included in the Reactor Safety Study provide important information concerning the offsite economic risks of LWR core-melt accidents.
Core-melt accident atmospheric radioactivity releases with an estimated probability of 1X10 lper reactor-year were
predicted to result in $15 billion (1974 dollars) in
offsite costs. Core-melt accident releases with
probabilities larger than lX10-6 per reactor year were predicted to result in less than $1 billion dollars in offsite costs.
Studies have been performed since the RSS to provide improved estimates of the frequencies of core-melt
accidents for specific LWR plants in the U.S. Because current nuclear plant risk analyses focus on potential public health effects of accidents, no substantial effort has been made to improve offsite cost estimates for severe LWR accidents. An improved model for estimating the
offsite economic consequences of degraded-core and
in Chapter 4 of this report.
2.1.2 ECONO MARC: A METHOD FOR ASSESSING THE COST OF EMERGENCY COUNTERMEASURES AFTER AN ACCIDENT [CL82]
A model has been developed for the purpose of
assessing the cost of emergency countermeasures taken after an accidental release of radionuclides into the environment in the United Kingdom [C181,C182]. The model estimates the lost contribution to Gross Domestic Product (GDP) caused by population protective countermeasures implemented after an accidental release. Cost estimates for the lost GDP
contribution from food bans, temporary evacuation, and long-term interdiction of areas are included in the economic consequence model.
The basic assumption underlying the ECONO-MARC model is that the costs of countermeasures like land area
interdiction will be a function of the area's contribution to Gross Domestic Product prior to the event. Gross
Domestic Product is a measure of economic output which is used in National Income and Product Accounts (NIPA) and
reflects the level of activity in an economy [Sa79]. GDP
estimate the contribution of a specific region to national output. The ECONO-MARC model assesses the impact of
countermeasure implementation on regional contribution to GDP.
The lost contributions to GDP due to population evacuation, agricultural product bans, and permanent population relocation which might result from a
contaminating event were included in the ECONO-MARC model. Two approaches to the estimation of lost GDP were
accommodated in the model; one based on detailed land usage and industrial output analysis, and another based on average GDP per-capita figures. The results of both
methods of analysis using ECONO-MARC are very similar for a rural site. Results calculated using the two methods
differ substantially for a semi-urban site. The difference in estimates is generally large for very small areas and gets smaller as the size of the area increases. The
estimation of GDP losses based on per-capita information is advantageous because of its computational simplicity
relative to the land usage approach which requires tedious manual sampling of data points from detailed land usage
There are two significant
problems in the estimation
of accident impacts using the ECONO-MARC
modeling approach.
Because GDP measures the rate of
output
in an
economy, it
is necessary to integrate GDP losses over time to estimate the total costs of post-accident countermeasures.
Projected GDP losses are likely to be temporary since the
loss of production from a specific region may be
substituted by increased output from a different region, or from new investment in the economy. This adjustment of the economy, demonstrated in Figure 2.3, is frequently observed after natural disasters and wars. The resilience of the U.S. economy to disasters has been demonstrated many times after earthquakes, hurricanes, and floods [ED74,Pe77]. After severe disasters, economies of impacted regions resume previous or even higher rates of growth in
relatively short periods of time. Predictions of GDP loss due to accidents are sensitive to the time history of
economic recovery assumed, which is difficult to specify without very detailed analysis. Another problem with the GDP approach is that the loss of regional tangible wealth
(or assets accumulated prior to the accident) is not properly accounted for, particularly those assets which produce output which is not directly measured in market
Figure 2.3 - Temporary nature of GDP loss due to population
protective measure implementation [C182].
I%
0
toa
0
PO0
%00a
0
0
goS
ILS
S *a0
0
E
0
0
I=b co I ¢ rution
Time (years)
transactions. This is a very significant problem since results from the CRAC2 model predict tangible asset losses are very important.
The ECONO-MARC model provides a broad macroeconomic measure of the offsite impacts of reactor accident
countermeasures for Britain. Model predictions are not directly comparable to CRAC2 economic impact predictions which are based on microeconomic models and assumptions which may be specific to the U.S. Also, the CRAC2 model estimates the direct costs of countermeasures such as
decontamination which are not considered in the ECONO-MARC model. Because of the limitations and accounting problems
in estimating the GDP loss resulting from LWR accidents, this approach is not employed in this study.
2.1.3 ESTIMATING THE POTENTIAL IMPACTS OF A NUCLEAR REACTOR ACCIDENT [CA82]
A study has been performed to deveLop an industrial impact model that can be used to estimate the regional industry-specific economic impacts of severe nuclear
reactor accidents [Ca82]. The impact estimates are based on reactor-specific information for core-melt accidents and
regional economic models derived from the Regional
Input-Output Modeling System (RIMS-II) developed at the Bureau of Economic Analysis (BEA) Ca81]. The ultimate goal of the investigation was to develop models which could be used to evaluate the potential impacts of Class 9 (the most severe) reactor accidents for Environmental Impact Statements.
Estimates of reactor accident impacts were based on the results of interregional, interindustry analyses in the BEA studies. These analyses require large amounts of
economic input data in the form of interindustry transaction tables for each specific region under consideration [Le66]. These transaction tables were
defined in the BEA analyses based on county or SMSA+ level data. The RIMS II economic model was used to predict
changes in regional output resulting from changes in final demand or final payments caused by a reactor accident. The basic input-output methodology used and the results of BEA studies are analyzed in detail in Appendix C.
Results of the BEA analyses for the St. Lucie nuclear
reactor site are shown in Table 2.1. This table shows
predicted private sector employment losses due to emergency countermeasures taken after an SST1 accident at the
St. Lucie site with a WNW wind direction+. The "physically affected" area is defined to include all areas contaminated by the release of radioactive material from the reactor plant. The physically unaffected area ncludes all other areas around the reactor plant. Table 2.1 shows that the SST1 accident with the WNW wind direction is predicted to result in -80,000 annual job losses due to the reactor accident. The effects in the physically unaffected area are predicted to be relatively small compared to annual job losses in the physically affected area.
The BEA estimates of reactor accident industrial impacts were presented in terms of annual jobs lost. The
+ The SST1 accident category was defined for the Sandia Siting Study to represent a severe core-melt accident which results in a rapid, large release of radioactive material to the environment [A182]. Accidents in this category result in release of approximately 100% of the reactor core inventory of noble gases and 50% of the volatile radionuclides in a very short time period.
a 0 0 0 o 0 o i F 0 0 et - 0 "lb a - a u~ a~ (J S - 0 00 C I., qa a 1 w a D P. m 1C.. V. m L, iin _Q O D 0 CO cu3N C ,CUW el r CP C cm ~~ (3mll~~~0 ca C S -c , CX O L 0 U S4 z 41 - 410 41 51~U .D VI L U C - 41 5 a .0 'Il VI o C _ c O C O L m SS S < z 51 ~ a Z O
~
3o E ci _ w01 g-d 2 .eS U. 41SDS .2 9 c .a C C - -_. 41 -. 4 .1 4. _ -ez M 1; ; 4 C . 4# Z- V e1 . VW SC°3 *-~~~~~~~~1U a _ "21
I u O. i .5 4 5 w 41 0. I *0; _ -z e0 a Z. -W 9 1 IA .0 !'I O gl_ dla _ e re *@j I e. i4 @ _ 4Da Li CO rI ce 0 Uo r. V 0 -C -r4: 1-4 E 4J , , o a q U U S -4 0) A C 'U o4 -n to E,·c 41 C c 41 a I.-*1L -a V) V; Tt
.-c F L C 41 0 Cw L 2t
C. .oS L. 41 a. -C 8r?e
_,o Dl I C1 D U t t C uL .5 CO -O 5S a, OI; C -S e GD as S a. Y .5 r! u, .5 c la W I aimpact estimates were intended to account only for the
first year after core-melt accident occurrence.
Also, many
assumptions were required to adapt the LWR accident problem
so that impact estimates can be calculated using the RIMS-II models. In particular, the BEA impact estimates were based on areas defined at the county level. The definitions of areas impacted by post-accident
countermeasures either include or exclude entire counties for estimation of economic impacts. Because this can lead to significant changes in the definition of areas affected by accidents, the BEA accident impact estimates cannot be directly compared to other accident cost estimates,
particularly those from the CRAC or CRAC2 economic models. Also, the usefulness of input-output analysis techniques for modeling non-equilibrium post-accident situations is questionable. The input-output technique is far too costly and data-intensive for consideration in LWR risk analysis applications which require sampling of hundreds of
meteorological conditions for each accident category. A discussion of problems with the BEA post-accident modeling approach and an analysis of the BEA results is contained in Appendix C of this report.
2.2 STUDIES WHICH ESTIMATE ONSITE ECONOMIC RISKS
2.2.1 ESTIMATES OF THE FINANCIAL CONSEQUENCES OF NUCLEAR POWER REACTOR ACCIDENTS ST821
Preliminary estimates of the financial consequences of potential nuclear reactor accidents were developed as part of the current NRC program to develop methods for
estimating reactor accident financial risks. The onsite and offsite financial consequences of LWR core-melt
accidents were estimated based on results of calculations performed with the CRAC2 economic consequence model and estimates of onsite costs for worker health effects, replacement power, and accident cleanup costs. Dollar values were assigned to radiation induced health effects
based on a review of societal expenditures for life-saving safety measures. Health effect values of $1,000,000 per early fatality, $100,000 per early injury, and $100,000 per
latent cancer fatality were used in the analysis.
Site-specific, life-cycle core-melt accident financial risk estimates were developed for reactor-site combinations in the U.S.
The study outlined discounting methods to calculate life-cycle core-melt accident economic risks. These methods were used to calculate isks from core-melt
accidents based on the remaining years in the LWR plant life, which is assumed to be forty years from the plant start-up date. This type of analysis is valuable for estimating the expected cost avoided by installation of a specific accident prevention system in an operating LWR. Equations were presented for calculating the life-cycle risk at a particular LWR based on probability estimates for various classifications of LWR accidents. The assessment or tabulation of site-specific accident probabilities was not addressed in the report.
The mean total predicted risks from this study for the
SST1, SST2, and SST3 core-melt accident release categories
at the Surry plant are shown in Table 2.2+. Discounted economic risks for the remaining productive lifetime of the Surry plant are presented in the table. To calculate the discounted present value core-melt accident risks over the
remaining plant lifetime, estimates of accident frequencies
fl, f2, and f3 (per reactor year) must be multiplied out in Table 2.2. These multiplications yield the total
4. o C % P . 0 C 4) l % rs m
5.0
44
.1 0)W-4 k ato0
'0 rI 0u C0 *
·*
Nc 0 r 0004
04
,4- C4 4i to o1 tos 4) W P -ra -gq r - 0 0 F $4 W -g o0 0 -V.. 0'a $4 r 4- ..I 40 ,
0)4.1 go -4 i oc. 00
s
4
x 0 nj4
w a;l C-; x 0 wU-i nj C-;1 x 0 + x I) X + Xo
X C; X 20 -C n C' xu C-.X :io
CW 0 ra X c, + N I I I co $4 $4 $4'
0 0 0
'- $4 $4 $40
000
C 3 ad .-40
000
0
u0
0 C C4 r-I 0 go t-I 04 A S Ul u4N C 4) rE - 1u 4444W .04):1 to 00 a 3 V 11 M E- E 1 U 44 4 4--were predicted to dominate all other cost components for the smaller releases, and to be comparable to other costs for the SST1 release. The onsite costs were large because it was assumed that the plant would be decommissioned after any core-melt accident. Replacement power costs were
integrated over the remaining life of the reactor plant to estimate the loss of benefit to society provided by plant operation. Assuming a core-melt accident frequency of approximately 10- 4 per reactor-year, the life-cycle
core-melt financial risk at this plant is estimated to be
on the order of 106 to 107 dollars. The estimated risks
+ The SST1-SST3 accident source terms were defined in the Sandia Siting Study [A182] to represent the range of
potential releases of radioactive material resulting from core-melt accidents with containment failure. The SST1 release category includes accidents which result in containment failure due to rapid overpressurization and release of a large fraction of the core inventory to the environment. The SST3 accident category includes
core-melt accidents with slight containment leakage which result in small releases of radioactive material and
did not include costs for any accidents less severe than
core-melt accidents.
The results of this study are useful for estimating
the financial risks of core-melt accidents at specific sites given a core-melt accident severity versus
probability spectrum. The onsite cost estimates were based on rough estimates of onsite societal costs for core-melt accidents (large consequence events). The report
incorporated the replacement power cost model which is discussed and utilized later in this study. Also, the use of present value discounting in calculating life-cycle risk discussed in the study is useful for the utilization of
risk estimates in regulatory decision-making.
2.2.2 "COPING WITH NUCLEAR POWER RISKS: THE ELECTRIC UTILITY INCENTIVES" [ST81]
As a result of the accident at TMI-2 in March 1979, much interest has shifted to the potential onsite economic consequences of LWR accidents. A 1981 study by C. Starr and C. Whipple of EPRI [St81] estimated the financial risks from nuclear plant events by interpolating between
results of the Reactor Safety Study. The study included
rough estimates of both the onsite and offsite consequences
of reactor accidents in estimating LWR
financial risk.
The
results of the analysis are used to suggest that utility
self-interest and the public interest in nuclear reactor accident prevention are coincident.
An estimated event frequency versus forced outage
duration (or time to repair) curve was combined with a cost versus outage duration curve to form the frequency versus
cost curve (shown as cost to the utility before insurance
recovery) in Figure 2.4. Curves were also estimated for utility risks with insurance coverage. The curves for public risk shown in Figure 2.4 are taken from the Reactor Safety Study [Nu75a] and modified by multiplying public health effects by constant dollar values. The values assumed for health effects and the expected values of
public risks are compared to the expected utility risks in Table 2.3. Based on the analysis, it was argued that
utility financial risks dominate public risks.
The need for consideration of both onsite and offsite risks over a broad range of possible events was emphasized in the results of this study. Although the study was
Figure 2.4 - Estimated utility
and public economic risks for
reactor outages and accidents
St8l].
a w S 0 z MO a It A U-w U a Sr S 0-U 'uK C a. Z WU WU DAMAGE (dollarst)
Table 2.3 - Expected values of public and utility
risks from
LWR
outages and accidents
St81].
PUBULIC RISKS-EXPECTED VALUE PER REACTOR-YEAR
Effect Early fatalities Early Illness Latent fatalities Thyroid nodules Genetic effects Poperty damage Expectation' 3X 10⁴
2x
14
7X 10
4 7 X 10 1 X 10⁴ $20,000 Value (5) 106 Twice WAS1400 Twice WASH-1400 Expected Cost (S) 150 20 700 20 10 40,000 *SWc: WASH1400. Table 4.UTIUTY RISKS-EXPECTED VALUE PER REACTOR-YEAR
Dollars
With $450 million insurance 2.1 X 10 With $300 million insurance 29 X 106
No insurance (includes accidents
causing 10 days outage or longer) 24 X 106
_ _
-I
performed using coping-type estimates of event frequencies
and costs, the conclusion that utility risk dominates
public risk was determined to be insensitive
to
uncertainties
in parameters.
2.3 SUMMARY OF RESULTS OF PREVIOUS STUDIES
Previous studies have estimated the risks from the
offsite economic consequences of severe LWR
accidents.
Three separate models have been developed to estimate
the
offsite economic impacts of severe accidents, each of which
employs a fundamentally different
economic methodology
for
estimation of accident costs. The three models, CRAC (orCRAC2), ECONO-MARC, and 'RIMS-II, estimate different attributes of the impacts of severe LWR accidents, and therefore their results cannot be directly compared. The results of previous studies of offsite economic
consequences and risks indicate a potential for significant offsite economic impacts for very low probability accident sequences.
In light of the accident at TMI-2, interest has focused in large part on the potential onsite losses
EPRI and Sandia National Laboratories have attempted to include onsite costs in examinations of LWR economic risks. Both studies concluded that onsite accident costs are
likely to dominate offsite accident costs except in the case of very low probability core-melt accidents
accompanied by large atmospheric radionuclide releases. This conclusion is supported by the TMI-2 accident
experience, where offsite costs (of evacuation only) were
very small compared to the costs of onsite property damage and replacement power. To maintain proper perspective it is important to examine both onsite and offsite costs of LWR accidents, particularly in performing cost-benefit or risk-reduction calculations.
CHAPTER 3
ONSITE ECONOMIC CONSEQUENCES OF LWR EVENTS
LWR event economic consequences which most directly affect the plant licensee or occur at onsite locations are discussed in this section. Models used in estimating the onsite economic consequences of LWR events are developed. Onsite cost components are estimated for each category of LWR operational events.
3.1 ONSITE COST COMPONENTS DISCUSSED
The onsite economic consequences which are important in estimating the societal benefits foregone or costs
caused by an LWR outage or accident depend on the severity of the event which causes the loss. The cost components discussed in this section include power production cost


![Figure 2.1 - RSS estimate of offsite economic risks from a typical U.S. nuclear power plant [Nu75b].](https://thumb-eu.123doks.com/thumbv2/123doknet/14756055.582570/41.918.218.696.309.833/figure-estimate-offsite-economic-risks-typical-nuclear-power.webp)
![Figure 2.2 - RSS comparison of economic risks from 100 nuclear power plants and other sources [Nu75a].](https://thumb-eu.123doks.com/thumbv2/123doknet/14756055.582570/42.918.258.625.345.755/figure-comparison-economic-risks-nuclear-power-plants-sources.webp)
![Figure 2.3 - Temporary nature of GDP loss due to population protective measure implementation [C182].](https://thumb-eu.123doks.com/thumbv2/123doknet/14756055.582570/47.918.194.768.325.996/figure-temporary-nature-gdp-population-protective-measure-implementation.webp)
![Figure 2.4 - Estimated utility and public economic risks for reactor outages and accidents St8l].](https://thumb-eu.123doks.com/thumbv2/123doknet/14756055.582570/59.918.289.622.336.824/figure-estimated-utility-public-economic-reactor-outages-accidents.webp)
![Table 2.3 - Expected values of public and utility risks from LWR outages and accidents St81].](https://thumb-eu.123doks.com/thumbv2/123doknet/14756055.582570/60.918.195.757.414.642/table-expected-values-public-utility-risks-outages-accidents.webp)