Dynamics, Stability and Scaling of Turbulent
Methane Oxy-Combustion
by
Nadim Walid Chakroun
B.S., Mechanical Engineering,
Purdue University (2012)
S.M., Mechanical Engineering,
MASSACHUgSTS INSTITUTE OF TECHNOLOGYFEB
09
Z018
LIBRARIES
ARCHIVES
Massachusetts Institute of Technology (2014)
Submitted to the Department of Mechanical Engineering
in partial fulfillment of the requirements for the degree of
Doctor of Philosophy in Mechanical Engineering
at the
MASSACHUSETTS INSTITUTE OF TECHNOLOGY
February 2018
@
Massachusetts Institute of Technology 2018. All rights reserved.
Signature redacted
Author ...
Department of Mech 4cal Engineering
11A
Jnuary 12, 2018
C ertified by ...
Signature redacted
~'
V
Ahmed F. Ghoniem
Ronald C. Crane Professor, Department of Mechanical Engineering
Thesis Supervisor
Accepted by ...
Signature redacted
'dohan Abeyaratne
Chairman, Department Committee on Graduate Students
Dynamics, Stability and Scaling of Turbulent Methane
Oxy-Combustion
by
Nadim Walid Chakroun
Submitted to the Department of Mechanical Engineering on January 12, 2018, in partial fulfillment of the
requirements for the degree of
Doctor of Philosophy in Mechanical Engineering
Abstract
Carbon capture and storage (CCS) is an important strategy for reducing CO2
emis-sions, with oxy-fuel combustion being one of the most promising technologies because of it is high efficiency and low cost. In oxy-combustion, CH4/02/CO 2 mixtures burn
at low temperatures (~1700 K), high pressures (~40 bar), where laminar burning ve-locities are about 7 times lower than in traditional CH4/Air mixtures. Thus oxy-fuel
combustors are more prone to blowoff and dynamic instabilities. In this thesis we examine turbulent oxy-combustion flame stabilization physics at the large and small scales using experimental studies and numerical simulations.
Experimental measurements are used to establish the stability characteristics of flame macrostructures in a swirl stabilized combustor. We show that the transition in the flame macrostructure to a flame stabilized along both the inner and outer shear layers (Flame IV), scales according to the extinction strain rate, similar to air flames. To achieve accurate scaling, extinction strain rates must be computed at the thermal conditions of the outer shear layer, emphasizing the role of heat interactions with the wall boundary layer. Care must be exercised while modeling the chemical structure of oxy-flames. We show that the kinetics of CO2 (used as a diluent in
oxy-combustion) is important in determining the consumption speed and flame extinction strain rate. Specifically, the extinction strain rate was found to be heavily impacted
by the reaction C02+ H - CO + OH.
Large Eddy Simulations (LES) models, first validated for various combustor ge-ometries, fuels and oxidizers, are used to examine the stabilization mechanisms of these flames. First, we demonstrate the importance of choosing the correct global chemical kinetics mechanism in predicting the flow structures in multi-dimensional simulations and develop a priori criterion of selecting a reduced mechanism based on the extinction strain rate. Besides flame macrostructures, recirculation zone lengths are found to linearly scale with extinction strain rates. This scaling holds regardless of fuel or oxidizer type, Reynold's number, inlet temperature, or combustor geometry. It is thus very important that a chemical mechanism is able to correctly predict ex-tinction strain rates if it is to be used in CFD simulations. We use the validated LES
framework to model the transition to Flame IV in the swirl combustor for methane oxy-combustion mixtures. The 3D turbulent flame structure strongly resembles a
ID strained adiabatic laminar flame structure in the combustor interior, and
non-adiabatic flames near the combustor wall. The results support the earlier conclusions regarding the use of the extinction strain rate and the wall thermal boundary condi-tion in scaling and modeling turbulent combuscondi-tion dynamics.
Thesis Supervisor: Ahmed F. Ghoniem
Acknowledgments
I begin by thanking Prof. Ghoniem, my thesis supervisor, for all of his support and guidance during the two years of my Masters work and the three and a half years of my PhD. On top of being a great advisor, he is also a mentor and a friend.
I am also grateful to Santosh Shanbhogue, Soufien Taamallah, Dan Michaels, Gaurav Kewlani, Yuval Dagan, Georgios Dimitrakopoulos, XiaoYu Wu and Akhilesh Bakshi for all their valuable support and helpful discussions which helped improve the quality of the work in this thesis.
I also would like to thank my PhD committee members: Prof. Green, Prof. Ler-musiaux and Prof. Marzouk for their graciousness and feedback during our meetings. I have had the pleasure of working alongside very distinguished colleagues and lab-mates in the Reacting Gas Dynamics group over the past five and a half years which also made for a friendly and rewarding atmosphere.
A big thanks to the sponsors and funders of this work, KFUPM and KAUST.
This thesis was mostly written at the Jaho and Explorateur cafes in Downtown Boston and it was also a delight meeting and interacting with so many different people there.
Outside work, I am lucky to have a lot of caring and fun friends which made my time in Boston very enjoyable and I cherish all the experiences we had together. I am definitely going to miss all the parties and clubs we went to, all the trips to NYC and DC, "studying" at coffee shops together, playing tennis, soccer and basketball, and exploring the city, just to name a few. They were also essentially my family away from home.
Most importantly I could not have been able to accomplish this incredible feat without the love and support of my family. It has definitely been tough being away from home for over 9 years during this long academic journey. But their unwavering support and encouragement helped me through it. To my parents, Walid and May, my brother, Rami, and sister Leah, this thesis is for all of you as well. We are incredibly grateful to have such loving and inspiring parents who never stop reminding us that
we have no limits and no reason why we could not study at the top universities in the world. My life accomplishments will never be complete until I see my brother and sister also reach the pinnacle of their fields. This thesis is also dedicated to my late grandmother who passed away just a few months before I was able to finish. She always used to keep asking how long I had left so I could move back home and see her more often. I am disheartened that she won't be around to witness her vision finally become a reality, but I know that she is currently looking down from heaven very proud and bragging about me to everyone just as she did while she was here.
A final thanks to God for giving me the strength and peace of mind that I can
always rely on.
"Education is the most powerful weapon which you can use to change the world."
Contents
1 Introduction
1.1 Swirl Combustion Stability and Scaling . . . . . 1.2 Scaling in Other Geometries . . . .
1.3 Methane Oxy-Combustion Modeling . . . .
1.3.1 Numerical Modeling . . . . 1.3.2 Experimental Investigations . . . . 1.4 Thesis Overview . . . . 1.4.1 Objectives . . . . 1.4.2 O utline . . . . 2 Experimental and Numerical Setups
2.1 Experimental . . . . 2.1.1 Combustor Description . . . . 2.1.2 Diagnostics Tools . . . . 2.2 Num erical . . . . 2.2.1 Large Eddy Simulations . . . . 2.2.2 Chem kin . . . .
3 Scaling Flame Stabilization Modes in the Swirl 3.1 Introduction . . . .
3.1.1 Literature Review . . . . 3.1.2 Objectives . . . . 3.2 Results and Discussion . . . .. . .
Combustor 27 31 35 37 39 45 50 50 51 53 53 53 55 57 57 63 67 67 67 70 70
3.2.1 Flow Fields . . . .
3.2.2 ORZ Flow Dynamics . . . .
3.2.3 Flame III to IV Transition . . . . 3.2.4 Flame III to IV Scaling . . . . 3.3 Conclusions . . . .
4 Response of Flames to Strain; Role of Chemistry and Transport
4.1 Introduction . . . .. . . . . 4.1.1 Literature Review . . . . 4.1.2 Objectives . . . . 4.1.3 Cases Investigated . . . . 4.2 Transport Properties . . . . 4.2.1 Flame Temperature . . . . 4.2.2 Lewis Number . . . . 4.3 Consumption Speed . . . . 4.3.1 Chemical Effect of CO2 . . . . 4.3.2 Effect of Inlet Temperature . . . . 4.4 Extinction Strain Rate . . . .
4.4.1 Effect of Radiation . . . .
4.4.2 Effect of Inlet Temperature . . . .
4.4.3 Effect of Reactions . . . . 4.5 Product Composition . . . .
4.5.1 Air versus Oxy . . . . 4.5.2 Chemical Effect of CO2 . . . . 4.6 Conclusions . . . .
5 The Role of Chemical Kinetics Modeling Combustors
5.1 Introduction . . . .
5.1.1 Literature Review . . . .
5.1.2 Objectives ...
in the LES of Premixed 119 119 120 122 73 73 75 77 83 85 85 86 88 89 91 91 93 96 100 102 103 107 108 111 112 113 114 116 . . . . . . . . . . . .
5.2 Simulation Setups . . . .
5.2.1 Bluff Body . . . .
5.2.2 Backward Facing Step . . . .
5.2.3 Sw irl . . . .
5.3 Propane-Air Combustion Results . . . . 5.3.1 Chemical Kinetics Modeling . . .
5.3.2 Bluff Body Combustor Results . .
5.3.3 Backward Facing Step Combustor
5.4 Methane Oxy-Combustion Results . . . . 5.4.1 Chemical Kinetics Modeling . . . 5.4.2 Swirl Combustor Results . . . . .
5.5 RZ Scaling . . . .
5.6 Conclusions . . . .
6 Flame Macrostructure Transitions in ing
LES; Mechanism and
Model-6.1 Introduction . . . .. . . .
6.2 Flame III to IV Stabilization Mechanism . . . .
6.3 Flame III vs Flame IV: Flamelet Structures . . . . 6.4 Flame III vs Flame IV: Flame-Flow Interactions . . . . 6.4.1 Strain Rates . . . . 6.4.2 Recirculation Zones . . . . 6.4.3 Vorticity Fields . . . . 6.5 Conclusions . . . . 7 Conclusions 7.1 Summary . . . . 7.2 List of Publications . . . . Bibliography Results 122 124 125 127 128 128 131 143 146 147 150 156 163 165 165 168 169 182 182 185 186 195 197 197 200 202
List of Figures
1-1 Global energy related CO2 reductions by technology area (data from [1]) 28
1-2 Operational space for oxy-combustion (adapted from [2]) . . . . 30 1-3 Correspondence between the flame macrostructures and thermo-acoustic
modes in the long combustor for 100% CH4. (a) Flame macrostructures (I to IV, V not shown). (b) Pressure fluctuations. (c ) Spectrogram.
[3]
331-4 Characteristic ORZ flow time versus characteristic flame time for CH4/Oxy,
CH4/Air and CH4/H2/Air flames. The flame times were all computed
at 400 K, reflecting the actual conditions in the ORZ [4]. . . . . 34
1-5 (Left) Measured data showing recirculation zone length as a function of equivalence ratio for different fuel compositions. (Right) Same data as is the left plot, but now plotted as a function of extinction strain rate. The y-axis is the inlet velocity divided by recirculation zone length and has the same units as the x-axis, which is a chemical time scale. Using this representation, the slope of the graph is the Karlovitz number (a chemical time/flow-time). Data reproduced from Ref. [5] . . . . 35 1-6 Temperature contours for reactive mixtures, with overlaid contour of
10% from the maximum heat release (black line), streamlines (white
lines), and a + mark for identifying the downstream stagnation point. The bluff body is plotted as a white square. (reproduced from [6]). . 36
1-7 Flow vs chemical time scales for different fuels and inlet temperatures
from DNS simulations of premixed laminar CH4/H 2/Air mixtures in
a bluff body stabilized combustor. The flow time scale is associated with a recirculation zone length while the chemical time scale is either represented by the flame speed (top) or extinction strain rate (bottom) of the chemical mechanism. Figures were generated using data from M ichaels et al. [6]. . . . . 38 1-8 The modeling results (lines) are shown along with the experimental
data (symbols) of Halter et al. [7] (o) and Kishore et al. [8] (A) for the reduction of the laminar burning velocity of stoichiometric CH4-air
flames with CO2 addition (T = 300 K, p = 1 atm) (reproduced from
[9]). . . . . 4 0
1-9 The modeling results (lines) are shown along with the experimental
data (symbols) of Albin et al. [10] (A,7 ), Mazas et al. [11] (D), and
Babkin and V'yun [12] (o) for the reduction of the laminar burning velocity of stoichiometric CH4-air flames with H20 addition at
atmo-spheric pressure (reproduced from [9]). . . . . 41
1-10 Comparison between modeling results (lines) and experimental data
(symbols) from the atmospheric CH4/02/CO2/N2 flow reactor of
Glar-borg and Bentzen [13] on CO formation in CH4 oxidation in the
pres-ence of CO2. The modeling was done assuming a residence time of T ~ 960/T s and constant temperature. Inlet conditions: XCO ~ 1000 ppm, XC0 2 = 77-95%, balance N2. (reproduced from [9]). . . . . 42
1-11 Calculated temperature and CO2 mole fraction profiles showing the
comparison between detailed and global kinetic mechanisms (10% N2
in oxidizer stream) for a laminar diffusion flame (reproduced from [14]). 44 1-12 CO concentrations in plug flow calculations. Comparison between the
DCKM (detailed kinetic model by Glarborg & Bentzen [13], WD, JL, and modified mechanisms at 1600 K and A = 1.2 under oxy-firing conditions (28% 02 and 72% CO2) (reproduced from [15]). . . . . 44
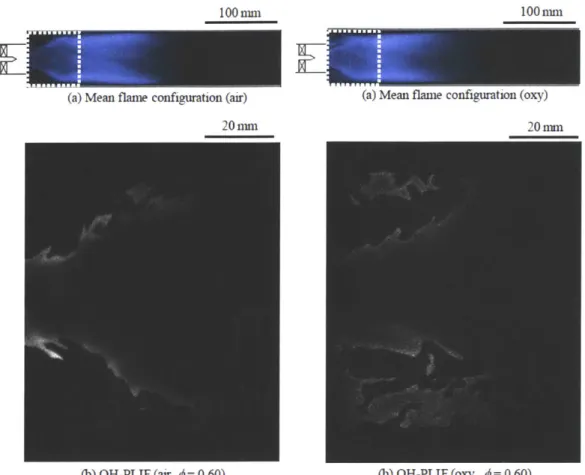
1-13 Mean flame configuration and OH-PLIF images of air and oxy-flames
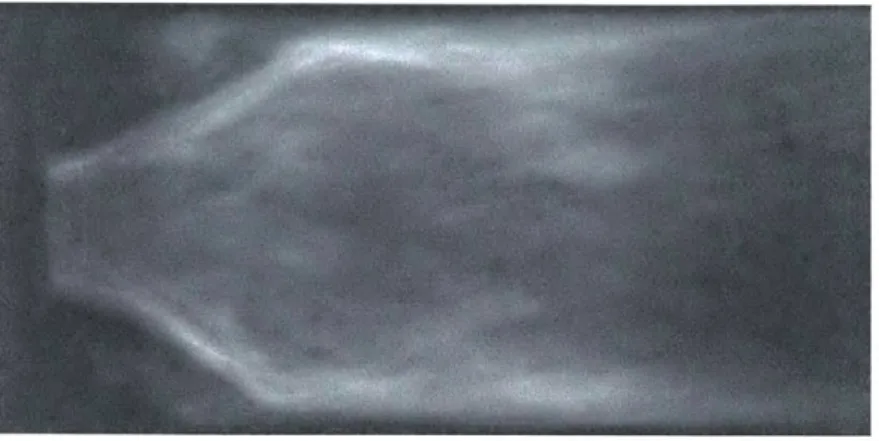
at q = 0.60 [16] . . . . 48 1-14 Chemiluminescence images of air and oxy-flames [16] . . . . 48
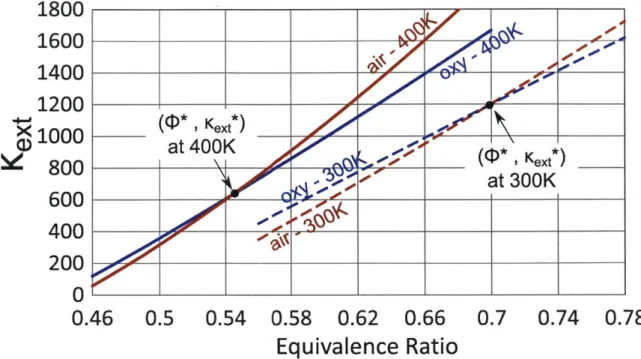
1-15 Extinction strain rates of premixed twin air and oxy-flames (CH4/02/N 2
vs. CH4/02/C0 2) [16] . . . . 49
2-1 Overview of the swirl combustor experimental setup. . . . . 53
2-2 The axial eight-vane swirler with 450 vane angle used in the experiment
[17]. . . . . 5 5 2-3 Example of a flame macrostructure captured using the digital camera
without a filter for methane oxy-combustion at
#=0.65
and Re=20,000. 55 2-4 Example of a flame chemiluminescence image with an IR filter formethane oxy-combustion at
#=0.65
and Re=20,000 (flow is from left to right). . . . . 56 2-5 Example of PIV results for methane oxy-combustion at#=0.65
andRe=20,000 (flow is from left to right). . . . . 57 2-6 Numerical premixed laminar twin flame configuration setup . . . . 63 3-1 Time-averaged PIV data for air (left) and oxy (right) at Re=20,000
and
#=0.65.
The zero axial velocity contours are indicated by the black lines . . . . 71 3-2 Mean axial velocity profiles at Re=20,000 and 0=0.65 comparing airand oxy mixtures at several axial (x/R) locations in the swirl combustor. 72
3-3 Mean transverse velocity profiles at Re=20,000 and 0=0.65 compar-ing air and oxy mixtures at several axial (x/R) locations in the swirl com bustor. . . . . 72
3-4 Left : A sample of oxy-flame chemiluminescence image (at Uin=9.9 m/s and
#=0.67)
showing the field of view and two different choices for the area used to integrate the ORZ flame signal. Right : FFT obtained using two areas covering the ORZ. . . . . 743-6 Strouhal number's (St - fO~z Di,) dependence on the inlet Reynolds num ber. . . . . 77 3-7 Effect of (a) Rejs and (b) Ui, on the critical equivalence ratio. Each
measurement is repeated three times and subsequent error bars are displayed. . . . . 78 3-8 Characteristic flame time versus characteristic ORZ flow time for Oxy
and air flames. Flame time computed at 300 K and 400 K. (Figure adapted from Ref. [18]) . . . . 79 3-9 Calculated extinction strain rates for air and oxy flames at 300 K and
400 K inlet temperatures. . . . . 81 3-10 Characteristic flame time versus characteristic ORZ flow time for air
and oxy flames. Flame time is computed at 300 K and 400 K. .... 82
3-11 ORZ scaling curve for CH4/H2/Air and CH4/02/C0 2 flames at
differ-ent Reynolds numbers and Swirl numbers. Flame times are all com-puted at 400 K . . . . 83
4-1 The heat release rate of elementary reactions versus the mixture 02 mole fraction [19]. The circled data corresponds to results from the reaction CO2
+
H ; CO + OH . . . . 874-2 Numerical premixed laminar twin flame configuration setup . . . . 90
4-3 Equilibrium flame temperatures for air and oxy-combustion mixtures calculated at 300 and 400 K . . . . 92
4-4 Effect of stretch on the consumption speed for fuel with Le < 1 [20] 94 4-5 Effect of stretch on the consumption speed for fuel with Le > 1 [20] 95
4-6 Lewis numbers of lean methane-air and stoichiometric methane-oxy flam es . . . . 96
4-7 Diffusion coefficients of important radicals into the two air and oxy mixtures as a function of inlet temperature . . . . 97
4-8 Consumption speeds at Tad=1800 K for inlet reactants at 400 K.. . 98
4-10 Consumption speeds at Tad=2100 K showing the additional stoichio-metric air case (brown line). . . . . 101
4-11 Consumption speeds at Tad=2100 K showing the chemical effect of CO2.102 4-12 Consumption speeds at Tad=2100 K showing the effect of reactant inlet
tem perature.. . . . . 4-13 Forward, reverse, and net reaction rates for reaction CO + OH ,
CO2 + H as a function of inlet temperature. . . . .
4-14 Extinction strain rates for inlet reactants at 400 K and radiation is considered for the oxy cases. . . . . 4-15 Extinction strain rate comparison showing the effect of chemistry ver-sus transport for Tad=1800 K . . . . 4-16 Extinction strain rates showing the additional stoichiometric air case (brow n line) .. . . . . 4-17 Extinction strain rates for inlet reactants at 400 K and radiation is not considered for the oxy cases. . . . . 4-18 Extinction strain rate comparison showing the effect of including radi-ation for Tad=1800 K . . . . 4-19 Extinction strain rates showing effect of reactant inlet temperature: 400 K (-), 300 K (- -). . . . .
4-20 Extinction strain rates for a stoichiometric oxy flame looking at the effect of certain reactions. . . . . 4-21 Profiles of C02, 02, CO, H and OH mole fractions for (a) Tad = 1800 K and (b) Tad = 2100 K. . . . . 104 104 105 106 107 109 109 110 112 115
5-1 Mean streamlines (blue) and instantaneous heat release contours (red) for three combustor geometries: Bluff Body, Backward-Step, and Swirl. 120
5-2 Flow vs chemical time scales for different fuels and inlet temperatures from DNS simulations of premixed laminar CH4/H 2/Air mixtures in
a bluff body stabilized combustor. The flow time scale is associated with a recirculation zone length while the chemical time scale is either represented by the flame speed (top) or extinction strain rate (bottom) of the chemical mechanism. Figures were generated using data from M ichaels et al. [6]. . . . . 123 5-3 Computational domain dimensions for the bluff body case studied in
this work (reproduced from [21]). . . . . 125
5-4 Computational domain dimensions for the backward-facing step case studied in this work (reproduced from [5]). . . . . 126 5-5 Computational domain dimensions for the swirl case studied in this
w ork . . . . 128 5-6 Extinction strain rates for C3Hs/Air mixtures at atmospheric
condi-tions calculated by the three mechanisms and measured in experiments [22]. . . . . 129 5-7 Calculated consumption speeds for C3Hs/Air at equivalence ratio of
0.65 at atmospheric conditions for the three mechanisms. . . . . 130 5-8 Normalized mean axial velocity profiles for the two grids at several
axial (x/D) locations for the non-reacting bluff body case. . . . . 132 5-9 Normalized rms axial velocity profiles for the two grids at several axial
(x/D) locations for the non-reacting bluff body case. . . . . 132 5-10 Centerline profiles of normalized mean axial velocity for the two grids
for the non-reacting bluff body case. . . . . 133 5-11 Centerline profiles of turbulence intensity for the two grids for the
non-reacting bluff body case. . . . . 133 5-12 Mean axial velocity contours (m/s) for the two propane kinetic models
for the reacting bluff body case at 0=0.65. a) Ghani mechanism, b) Ghani-mod mechanism . . . . 135
5-13 Normalized mean axial velocity profiles for two reduced kinetic models
at several axial (x/D) locations in the reacting bluff body case for the propane-air mixture at 0=0.65. . . . . 135
5-14 Centerline profiles of the normalized mean axial velocity for two re-duced kinetic models in the reacting bluff body case for the propane-air m ixture at
#=0.65.
. . . . 136 5-15 Instantaneous temperature contours (K) and mean streamlines usingtwo reduced kinetic models in the reacting bluff body case for the propane-air mixture at
#=0.65.
a) Ghani mechanism, b) Ghani-mod m echanism . . . . 137 5-16 Mean temperature profiles for the two propane kinetic models at severalaxial (x/D) locations for the bluff body case at 0=0.65. . . . . 139 5-17 Normalized mean axial velocity profiles using the Ghani mechanism at
several axial (x/D) locations for the reacting bluff body case at 0=0.65.139
5-18 Normalized rms axial velocity profiles using the Ghani mechanism at
several axial (x/D) locations for the reacting bluff body case at 0=0.65.140
5-19 Normalized mean transverse velocity profiles using the Ghani
mecha-nism at several axial (x/D) locations for the reacting bluff body case at
#=
0.65. . . . . 1405-20 Normalized rms transverse velocity profiles using the Ghani mechanism
at several axial (x/D) locations for the reacting bluff body case at 0=0.65.141
5-21 Centerline profiles of the normalized mean axial velocity using the
Ghani mechanism for the reacting bluff body case at
#=0.65.
. . . . . 1415-22 Centerline profiles of turbulence intensity using the Ghani mechanism
for the reacting bluff body case at 0=0.65. . . . . 142
5-23 Mean temperature profiles using the Ghani mechanism at several axial
(x/D) locations for the reacting bluff body case at 0=0.65. . . . . 142 5-24 Experimental (PIV) mean streamlines for two propane-air equivalence
5-25 Instantaneous temperature contours (K) and mean streamlines for the
Ghani and modified Ghani mechanisms and propane-air equivalence ratios in the step combustor: a)
#=0.63,
Ghani mechanism, b)#=0.63,
Ghani-mod mechanism, c)#=0.85,
Ghani mechanism, d)#=0.85,
Ghani-mod m echanism . . . . . 1445-26 Normalized mean axial velocity profiles for two reduced kinetic models
at several axial (x/H) locations in the step case for the propane-air m ixture at
#=0.63.
. . . . 1465-27 Normalized mean axial velocity profiles for two reduced kinetic models
at several axial (x/H) locations in the step case for the propane-air m ixture at
#=0.85.
. . . . 1475-28 Laminar burning velocities for CH4/02/CO 2 mixtures calculated by
the three mechanisms. . . . . 149
5-29 Extinction strain rates for CH4/02/CO 2 mixtures calculated by the
three m echanism s. . . . . 150 5-30 Main flow features of the swirling flow studied in this work. IRZ: Inner
Recirculation Zone, ORZ: Outer Recirculation Zone (adapted from
[17]).151
5-31 Mean flame structures of methane-oxy flames at
#=0.65
from experi-ments and LES using the two chemical mechanisms. . . . . 152 5-32 Mean flow fields of methane-oxy flames at#=0.65
from experimentsand LES using the two chemical mechanisms. The solid black line represents the zero-velocity contour to show the recirculation zones. . 154
5-33 Normalized mean axial velocity profiles using the Frassoldati and
An-dersen mechanisms at several axial (x/R) locations in the swirl com-bustor for the methane-oxy mixture at q=0.65. . . . . 155
5-34 CO mass fraction profiles using the Frassoldati and Andersen mecha-nisms at several axial (x/R) locations in the swirl combustor for the methane-oxy mixture at -=0.65 . . . . 156
5-35 Mean temperature profiles using the Frassoldati and Andersen
mech-anisms at several axial (x/R) locations in the swirl combustor for the methane-oxy mixture at 0=0.65 . . . . 157 5-36 Mean temperature distribution of the gases near the wall using the
Frassoldati and Andersen mechanisms in the swirl combustor for the methane-oxy mixture at 0=0.65 . . . . 158 5-37 Normalized mean axial velocity profiles using the Frassoldati
mecha-nism at several axial (x/R) locations in the swirl combustor for the methane-oxy mixture at
#=0.65
. . . . 159 5-38 Normalized rms transverse velocity profiles using the Frassoldatimech-anism at several axial (x/R) locations in the swirl combustor for the methane-oxy mixture at
#=0.65
. . . . 159 5-39 Normalized mean transverse velocity profiles using the Frassoldatimech-anism at several axial (x/R) locations in the swirl combustor for the methane-oxy mixture at
#=0.65
. . . . 1605-40 Normalized rms transverse velocity profiles using the Frassoldati mech-anism at several axial (x/R) locations in the swirl combustor for the methane-oxy mixture at 0=0.65 . . . . 160
5-41 Mean axial velocity contours showing positive (red) and negative veloc-ities (blue) in order to visualize recirculation zones for various methane-oxy mixture equivalence ratios using the Frassoldati mechanism. The instantaneous progress variable contour (c=0.8) is also plotted (white line) as a way to locate the flame front. . . . . 161
5-42 Relation between the flow time scale, Uif/LRZ, and chemical time scale,
Kext, in the swirl combustor for LES of methane-oxy mixtures using
the Frassoldati mechanism at different inlet temperatures. . . . . 162
5-43 Relation between the flow time scale, Uifl/LRZ, and chemical time scale,
Kext, in the backward facing step combustor for propane-air
experi-ments (red) and in the swirl combustor for methane-oxy LES using the Frassoldati mechanism (blue). . . . . 163
6-1 Consecutive binarized chemiluminescence images showing the ignition of the ORZ recirculating reactants (CH4/Air at
q=0.62).
Adaptedfrom R ef. [4]. . . . 167
6-2 Normalized vorticity maps of different reactant mixture compositions
(CH4/Air), with lines marking the iso-surface of wd/Ui, = -5, the
flame heat release zone (contour of 10% of the maximum heat release) and the stagnation stream line. These results are from DNS in a bluff body combustor. Adapted from Ref. [6]. . . . 167
6-3 Consecutive 2D flame images from LES of the methane-oxy mixture in the swirl combustor during the flame transition. The time instances shown are for a mixture equivalence ratio of 0.625 and Tad=1710 K.
The different images represent the temperature contour plotted on a gray scale. . . . 169 6-4 2D flame images from LES of the methane-oxy mixture in the swirl
combustor during the flame transition at x/R=0.2. The time instances shown are for a mixture equivalence ratio of 0.625 and Tadl1710 K.
The cross-sectional images represent the fuel (CH4) mass fractions at
various points during the transition. . . . . 170 6-5 3D flame images from LES of the methane-oxy mixture in the swirl
combustor during the flame transition. The time instances shown are for a mixture equivalence ratio of 0.625 and Tad=1710 K. The side images represent the 3D heat release contours colored by temperature
at various non-consecutive points during the transition. . . . . 171 6-6 Flamelet structure of Flame III (q=0.56) with heat loss. . . . . 172 6-7 Flamelet structure of Flame IV (0=0.7) with heat loss. . . . . 173 6-8 Flamelet structure of Flame III (0=0.56) with adiabatic boundary
con-ditions, and symmetric laminar flame profiles. . . . . 174
6-9 Flamelet structure of Flame IV (0=0.7) with adiabatic boundary
6-10 Mean temperature contours of Flame III
(#=0.56)
with two different thermal boundary conditions. . . . . 175 6-11 Mean temperature contours of Flame IV (0=0.7) with two differentthermal boundary conditions. . . . . 176 6-12 The instantaneous progress variable contour (c=0.8) is plotted (black
line) as a way to locate the flame front along with the mean axial velocity contours of Flame III (0=0.56) with two different thermal boundary conditions. . . . . 177 6-13 The instantaneous progress variable contour (c=0.8) is plotted (black
line) as a way to locate the flame front along with the mean axial veloc-ity contours of Flame IV (0=0.7) with two different thermal boundary conditions. . . . . 178
6-14 Flamelet structure of Flame III (#=0.56) with heat loss, and laminar flame profiles constructed using the asymmetric laminar setup...180
6-15 Instantaneous normalized temperature
(E
= (T - Tu)/(Teq - Tu))con-tours for Flame III with heat loss. . . . . 181 6-16 Flamelet structure of Flame IV (0=0.7) with heat loss, and symmetric
lam inar flame profiles. . . . . 181 6-17 XY strain rate contours along with the flame edge at the instant right
before a flame kernel enters the ORZ. The strain rate analysis is per-formed on the area highlighted. . . . . 183 6-18 Instantaneous temperature profiles at several axial locations for (a)
Flame III (0=0.58) and (b) Right before the transition to Flame IV
(0= 0.625). . . . . 184
6-19 Normalized strain rate terms plotted during the flame III to flame IV
transition. The strain rates are normalized by the extinction strain rate calculated at 450 K. . . . . 186 6-20 Mean temperature contours and streamlines of methane-oxy flames
6-21 Normalized mean axial velocity profiles comparing the two flame
macrostruc-tures at two axial locations (x/R) in the swirl combustor for the methane-oxy m ixture. . . . . 188 6-22 Instantaneous out-of-plane vorticity contours along with the stagnation
velocity line (black line) to locate the recirculation zones of methane-oxy flames from LES at the two flame macrostructures. 1 ms separates each fram e. . . . . 189 6-23 Instantaneous out-of-plane vorticity contours along with the progress
variable contour c=0.8 (black line) to locate the flame front of methane-oxy flames from LES at the two flame macrostructures. 1 ms separates each fram e. . . . . 190
6-24 Mean out-of-plane vorticity contours of methane-oxy flames from LES at the two flame macrostructures. . . . . 191 6-25 Mean dilatation vorticity source term profiles comparing the two flame
macrostructures at x/R=0.75 in the swirl combustor for the methane-oxy m ixture. . . . . 192 6-26 Mean dilatation vorticity source term contours comparing the two
flame macrostructures in the swirl combustor for the methane-oxy mix-ture. .. ... ... ... .. ... 193 6-27 Mean out-of-plane vorticity (left) and volumetric heat release (right)
profiles comparing the two flame macrostructures at x/R=0.75 in the swirl combustor for the methane-oxy mixture. . . . 194
List of Tables
1.1 Detailed mechanisms for methane oxy-combustion . . . . 40
3.1 Experimental testing conditions in the swirl combustor . . . . 71 3.2 Measured TORZ for air and oxy flames just before the appearance of
an O R Z flam e. . . . . 80
4.1 The main cases tested in this chapter . . . . 89
4.2 Some important transport properties for air and oxy-combustion mix-tures at 300 K and 1 atm (source: Cantera [23]) . . . . 95
4.3 Differences in the mass diffusivities of radicals into the mixtures be-tween air and oxy versus inlet temperature . . . . 96
4.4 Top elementary reactions with the highest maximum reaction rate in oxy-com bustion . . . . 111 5.1 Operating conditions simulated in the three combustors . . . . 124
5.2 Comparison between the experimental recirculation zone lengths and
LES using the two reduced mechanisms in the step combustor . . . . 146
5.3 Andersen mechanism with kinetic rate data, units are: cm, s, cal, mol 148 5.4 Frassoldati mechanism with kinetic rate data, units are: cm, s, cal, mol 148
Chapter 1
Introduction
Greenhouse gas (GHG) emissions are the leading contributers to climate change. Combustion of fossil fuels results in the formation of significant amounts of carbon dioxide (C02), the primary GHG released into the atmosphere. At the global scale,
CO2 emissions accounted for approximately 65% of all GHG emissions in 2014 [24].
According to the Environmental Protection Agency (EPA), about 26% of all global
GHG emissions were produced by the electricity generation sector. It is also estimated
that the world CO2 emissions from electricity production will increase by
approxi-mately 43% by 2035, from 30.2 billion metric tons in 2008 to 43.2 billion metric tons
[25]. Much of this growth in emissions is attributed to the developing non-OECD
countries which continue to rely on fossil fuels to meet their growing energy demand.
By 2040 these non-OECD countries are expected to contribute as much as 69% of
the world's total emissions, whereas the OECD emissions, totaling about 14 billion metric tons, represent the balance [25].
The agreement reached in Paris in late 2015 at the 21st Conference of the Parties
(COP21) was a pivotal moment in the fight against global warming and decarbonizing
our energy systems. Its main aims were to peak global emissions as soon as possible and reach net-zero emissions in the second half of this century, as well as to keep the global temperature rise well below 2'C while pursuing efforts to limit it to 1.5 C. The International Energy Agency (IEA) developed different policy scenarios to model this shift towards reducing emissions from the energy sector. Two of these scenarios are
60 6DS 50 --- - - ---- Renewables 32% 40 - ... CCS 12% 0 End-use fuel 4- switching 10% 0 End-use efficiency 20 - - - - -38% 10 - .-....-...~. .... ... ... 2DS 3 Nuclear 7% 0 2013 2020 2030 2040 2050
Figure 1-1: Global energy related CO2 reductions by technology area (data from [1])
shown in Figure 1-1 along with strategies to achieve these emissions reductions. One of these scenarios is a business-as-usual case and is referred to as 6DS. This largely assumes an extension of current trends, and so primary energy demand and and process-related CO2 emissions would grow by about 60% from 2013 to 2050. Since there is no effort to stabilize atmospheric concentrations of GHGs, average global temperature rise above pre-industrial levels would be projected to reach 40C by the
end of the century and 5.5'C in the long-term.
The most stringent scenario is the 2DS. As shown in the figure, the 2DS sets the target of cutting emissions by almost 60% by 2050 in order to limit the average global temperature increase to 2'C. It lays out an energy system deployment pathway and emissions trajectory consistent with these targets with carbon emissions from fuel combustion and industrial processes projected to decline after 2050 until carbon neutrality is reached. The 2DS identifies changes that help ensure a secure and affordable energy system in the long run.
A portfolio of low-carbon technologies is needed to reach the 2DS cost-effectively
[1]. One of these promising technologies is Carbon Capture and Storage (CCS). In this technology, CO2 released from power plants is separated, liquefied, compressed and transported to a site for underground injection in secure geological formations,
including natural underground reservoirs, or depleted oil and gas fields. The integra-tion of these CCS technologies with the power generaintegra-tion plants has not yet been fully demonstrated commercially [27, 28]. Oxy-fuel combustion is one of the promising CCS options [29], the other ones being post-combustion CO2 capture and pre-combustion CO2 capture [30]. The main difference between these technologies is the location at which the CO2 is removed in the cycle. In oxy-fuel combustion, the fuel is burned in oxygen diluted with CO2 or water or a mixture of both, at stoichiometric conditions
so that the products consist of only carbon dioxide and water. Water can then be easily separated from the carbon dioxide by condensation. A diluent is added to the fuel and oxidizer to moderate the temperatures of combustion and the resulting products. Due to the simplicity of the carbon capture system in oxy-fuel combustion, the CO2 capture rate is very high (~98%) [30].
Oxy-combustion efforts in both research and implementation has often been asso-ciated with coal since coal power plants produce about two times as much CO2 per
MWh than natural gas power plants [31]. On the other hand, natural gas' share of the world's electricity generation is expected to grow from 22% in 2010 to 24% in 2040 [25] and applying the same concept to this fuel has been suggested. Estimated cost of electricity by source [32], suggest that natural gas power plants with CCS are competitive with other zero carbon energy sources.
Methane oxy-combustion cycles require combustors that can burn fuel and an oxygen stream along with some diluent, so that the CO2 in the flue gases can easily
be captured by condensing out the water. In order to control the flame temperature in these combustors, the oxidizer is diluted with either H20 or CO2 depending on
the cycle layout. In the Semi-Closed Oxy-fuel Combustion Combined Cycles
(SCOC-CC), CO2 is used as the dilution medium [33, 34, 35, 36, 37]. Using CO2 as the
diluent is our main focus in this thesis since these types of cycles have the highest efficiency and lower costs [38]. The air separation unit (ASU) needed to produce the oxygen stream for the combustor consumes a significant fraction of the plant power and is a cost intensive process [38], therefore these oxy-fuel cycles typically operate at stoichiometric conditions (equivalence ratio = 1).
CO Ihnited
Blow-off Operational
9 $ 1 -limited space
0 titited
Flame Temperature
Figure 1-2: Operational space for oxy-combustion (adapted from [2])
Flame speed calculations have shown that the oxy-flame has a laminar burning velocity about 7 times lower than the air-equivalent mixture. The lower burning velocity of the oxy-flame negatively impacts the stability of these flames by increasing their propensity to blowoff and increasing flame length. Figure 1-2 shows the issues associated with oxy-combustion in the equivalence ratioflame temperature coordinates [2]. High flame temperatures and equivalence ratios result in excessive CO emissions. High flame temperatures and low equivalence ratios, meanwhile, are associated with high 02 emissions. On the other hand, too low flame temperatures causes blowoff. Therefore there is a limited range of equivalence ratios and flame temperatures which minimizes the operational issues associated with oxy-combustion.
Premixed and non-premixed methane oxy-combustion were both examined exper-imentally in our swirl combustor [39]. However it was reported that the non-premixed case resulted in long flames with bright and sooty tips whereas the premixed case had a more compact flame. These observations of the non-premixed oxy-flame can also be seen in another recent study [40]. 1-D flame calculations have also shown that dif-fusion flames result higher CO and lower CO2 in the products compared to premixed
more uniform outlet temperature profiles
[41],
have led us to focus solely on studying premixed oxy-combustion flames in this thesis.1.1
Swirl Combustion Stability and Scaling
A number of important and critical issues face the operation and design of combustors,
all of which are impacted by the fuel and oxidizer properties. These are: blowout, flashback, combustion instability, autoignition, emissions and flame compactness. A number of studies have looked at blowout both experimentally
[39]
and numerically [2] for methane oxy-combustion. Both agree that CO2 diluted oxy-combustion flames blowoff at higher temperatures for a given Reynolds number than air combustion flames. This was explained by the fact that CH4/02/CO 2 flames have slower kineticsmaking them easier to blowoff [42]. Premixed combustion, especially, is susceptible to combustion instabilities [43], which result from the acoustic coupling of heat release rate fluctuations that accompany unsteady flow oscillations (ex. vortex shedding) or equivalence ratio oscillations, causing extinction, flashback, excessive structural vibrations and even system damage and failure [44, 45].
These combustion instabilities in oxy-fuel combustors is not a well understood topic but it has been gaining interest in the literature recently [46, 47, 48]. In oxy-fuel cycles with CO2 recycle, combustor inlet temperatures are on the order of 700 K
while the outlet temperatures are set to 1600 K due to materials limitations [38]. In a study by Altay et al. [49], it was found that, in a backward-step combustor, thermoa-coustic instabilities (associated with increase in pressure oscillations) shift to lower equivalence ratios (or lower adiabatic flame temperatures) as the inlet temperature is raised. Results of Shroll et al. show that the sound pressure levels in an oxy-fuel swirl combustor start to rise for mixtures whose adiabatic flame temperatures are around
1850 K at 300 K inlet temperature [46]. Therefore we expect that during the practical
operation of high inlet temperature oxy-combustors, combustion instabilities will be a major issue.
characterization in gas turbine combustors. Previously, in pour lab the onset of thermo-acoustic instabilities and their link to the mean flame configurations were investigated in a swirl combustor for an CH4/H 2/Air mixture [3]. Four different
flame configurations were observed:
(I)
columnar flame,(II)
bubble-columnar flame, (III) single conical flame, and (IV) double conical flame. These configurations are shown in Figure 1-3 along with the sound pressure levels and frequencies. Transitions II to III, III to IV and IV to V (not shown) do show strong changes in the acoustic signature. When these results were compared to those of the uncoupled case of the short combustor, the same configurations as those observed in Figure 1-3 were still seen [3]. However in the transition from III to IV in the short combustor, unlike that of the long combustor, occurred without the onset of instability. But during this transition, the flame starts to appear intermittently in the outer recirculation zone (ORZ), also known as ORZ flame flickering. This observed flame flickering occurs in a same range of equivalence ratios at which the long combustor exhibits its first unstable mode, highlighting the importance of this flame transition. Modeling and understanding this flame transition for oxy-combustion is a main focal point of this thesis as will be shown in the forthcoming chapters.In the multiple studies performed for various fuels (methane, hydrogen, syngas, propane) and oxidizers (air, oxy) looking at their stability in the swirl combustor [46, 50, 51], there was a noticeable similarity in the pressure level data as a function of equivalence ratio or flame temperature between all of these different operating conditions. This implied that some form of a universal scaling parameter might exist which would collapse this data regardless of fuel concentration. Indeed it was reported first by Speth et al. [50], then Altay et al. [49], then Hong et al. [5] and most recently
by Shanbhogue et al. [51], that a strained consumption speed or extinction strain rate
could collapse these pressure data for the multiple fuels and combustor geometries. Shanbhogue et al. [51] conducted experiments with CH4/H 2 mixtures on the swirl
combustor using PIV and chemiluminescence measurements, and they successfully scaled the flame shape, flow structure and combustor stability according to the extinc-tion strain rate. This scaling indicates that the flame response to stretch dominates
(a) 1 11 1000 0 -500 -1
U0
0 -300 200 -100 0.III IV.un ) IV V(un..s)
(b) 45 0 .5 0.55 0.6 0.65 0.7 0.75 0.1 1w~
I
- (C) I f po 45 0.5 0.55 0.6 0.65 0 7 0.75 0. Equivalence Ratio (+) 0 50Sound Pressure Level (dB) 100 150
Figure 1-3: Correspondence between the flame macrostructures and thermo-acoustic modes in the long combustor for 100% CH4. (a) Flame macrostructures (I to IV, V
not shown). (b) Pressure fluctuations. (c
)
Spectrogram.[3]
the flame location as it can stabilize in regions with high strain rate. This observation was also seen in simulations by Michaels et al. [6] on a bluff body combustor as will be explained in the next section.
3.5
T flame= 0.19 TORZ flow+ 0. 66
R2= 0.979 3.0 -F0meII E 2.5 Flame IIIA00 X A, II 1.5 1.0 0.5 n f 0.0 2.0 4.0 6.0 8.0 10.0 12.0 14.0
T ORZ flow 1/(271 f ORZ ) (is)
Figure 1-4: Characteristic ORZ flow time versus characteristic flame time for CH4/Oxy, CH4/Air and CH4/H 2/Air flames. The flame times were all computed
at 400 K, reflecting the actual conditions in the ORZ [4].
Taamallah et al. [4] also studied the physical mechanism leading to a flame transi-tioning to the ORZ in air combustion (Flame III to IV). For each operating condition, there was a critical qonet at which the flame appears in the ORZ and ultimately
sta-bilizes along the OSL. They found that the appearance of the flame in the ORZ starts intermittently and is associated with a flame spinning along with the predom-inately azimuthal ORZ flow at a clearly defined frequency foRz. The survival of a flame in the ORZ was represented as a balance between a characteristic flame time
Tf lame (taken as the inverse of the extinction strain rate Kext) and the ORZ flow time
TORZ flow (taken as the inverse of the ORZ spinning frequency foRz), as can be seen
in Figure 1-4. Flame IV A CH4 -0% H2 -Sw. 30.0 deg. CH,- H, blends -- 0C ss Ho --% 0CH4-0% H2 -Sw. 4S.0 deg. Sw = 2Seg. 'CH4 -0% H2 -Sw. 58.5 deg. Re H= 20,d _ _0 CH4 -0% H2 -Sw. 60.0 deg. CHC H2 bends
-____-(0% to 40% H) *10% to SO% H2 -Sw. 45 dog. -Re20,000 Sw = 60 deg.
1.2
Scaling in Other Geometries
Next, we show that the extinction strain rate scaling observed in the literature for the swirl combustor, is also seen in other geometries such as the backward-facing step
and bluff body combustors.
0.12 120 - -0.12 100% W .1 - - 100 C3H 110 70% CGhrouff* I.10 70 C3H7 O%H2 0.10 _ 3 80%H 2 100 0.09 0.08 4 0.07 0.06 0.05 -_ ----
47f
-i0 e --90 - 04-- I - T 70K 601 ~eJ=. 0.04 - --0.55 0.60 0.65 0.70 0.75 0.80 0.85 0.90 4 400 600 800 1000 1200 1400 1600 1800 2000 200t (s'1)Figure 1-5: (Left) Measured data showing recirculation zone length as a function of equivalence ratio for different fuel compositions. (Right) Same data as is the left plot, but now plotted as a function of extinction strain rate. The y-axis is the inlet velocity divided by recirculation zone length and has the same units as the x-axis, which is a chemical time scale. Using this representation, the slope of the graph is the Karlovitz number (a chemical time/flow-time). Data reproduced from Ref. [5]
Wake flows are the preferred mode of flame stabilization in lean premixed com-bustion because they create recirculation zones that can anchor flames. However coupling between the flow dynamics and system acoustics can result in combustion instabilities [45]. The combustor geometry also determines the size and structure of the recirculation zone and these recirculating flows in the wake of a bluff body, behind a sudden expansion or downstream of a swirler, are pivotal for anchoring the flame and expanding the stability range. Hong et al. [5] investigated the impact of fuel composition on the recirculation zone structure for C3H8/H2/Air mixtures in a
backward-facing step combustor. The results in Figure 1-5 show the spread in the re-circulation zone length data when plotted as a function of equivalence ratio, whereas the scatter is significantly reduced when the data are plotted versus the extinction strain rate.
Cocks et al. [52] questioned the ability of LES to predict the large scale dynamics in reacting flows, e.g. the recirculation zone features. They used the same combustor geometry which is also tested in our work, triangular bluff body combustor, as will be explained later. It has been recently demonstrated that in CFD simulations, predicting the extinction strain rate is an important indicator that a multi dimensional simulation can be expected to reproduce for accurate flow and combustion features.
4 () =0.5. 8000 (H4 - 200'o H T=300 K 4(b) # =0.5,60% CH. + 40% H2, Ti=300 K
311
1
12
1 2 3 4 5 6 7 1 2 3 4 u 7 x/d x/d 4(C) a# =0.5. 800 o CH4 200o H. T =500 K 4(d) 4 =0.6, 6000 CH4 +40 0 c H. T 11=300 K UI 3 .5 5 s 3. 2.525 2 2 1 2 3 4 5 6 7 1 2 3 1 5 6 7 x/d x/dFigure 1-6: Temperature contours for reactive mixtures, with overlaid contour of 10% from the maximum heat release
(black
line), streamlines(white
lines), and a+
mark for identifying the downstream stagnation point. The bluff body is plotted as a white square.(reproduced
from[6]).
In Michaels et al. [6], DNS of laminar premixed bluff body stabilized CH4/H2/Air
flames at various temperature ratios were conducted. Results shown in Figure 1-6 il-lustrate that the higher the extinction strain rate of the mixture
(either
by increasing equivalence ratio or H2 percentage), the shorter the recirculation zone and the flameleading edge moves further upstream. The next question to ask is, since these recir-culation zone lengths appear to change with Kext, can Kexi be used as a surrogate to scale these lengths? The answer is shown in the plots in Figure 1-7. When the laminar burning velocity was considered in defining the chemical time scale, the recirculation zone length data is widely scattered and no clear trend is observed. However when
the data is plotted using the extinction strain rate to define the chemical time scale, there is a clear trend revealing that the recirculation zone length correlates well with a chemical time scale based on the flame extinction strain rate of the inlet mixture
[6].
These scaling results observed, suggest that regardless of combustor geometry, flow regime, fuel or oxidizer, and inlet temperature, recirculation zone lengths might be correlated with the extinction strain rate. This will be studied in greater detail in Chapter 5 and how this can be applied to oxy-combustion mixtures. Next we review the work that has specifically focused on modeling methane oxy-combustion mixtures both experimentally and numerically.
1.3
Methane Oxy-Combustion Modeling
To retrofit or re-design existing natural gas based power generation plants, thorough understanding of the fundamental differences in the flame characteristics associated with the substitution of N2 with CO2 as the diluent is needed. Unlike N2, CO2 is not
inert but impacts the kinetics primarily through the reaction CO2
+
H = CO+ OH[9, 2]. Due to the high concentrations of CO2 under oxy-fuel conditions, the forward
reaction is primary responsible for the chemical effect of CO2 at medium to high
temperatures [13].
The oxy-fuel combustor requires significant modeling and experimental investiga-tions due to the increased instability of CO2 recycled oxy-fuel flames [53]. Most of
the modeling so far on oxy-fuel combustion has been focused on coal. More work is needed especially for modeling and simulating premixed methane oxy-combustion in a gas turbine combustor. CFD modeling is also an important industrial tool for ac-quisition of in-depth knowledge, as well as design and optimization. It can effectively provide details on the velocity, temperature and concentration variations that are not easily obtained through experimental measurements. In this section, we review the literature on methane oxy-combustion starting from chemical kinetics modeling and then presenting results from a selection of CFD and experimental studies.
200 180 -160 140 120 , @0 * 100 0 0 _j 80 *,* 60 a D 40 20 0 500 1000 1500 2000 2500 3000 S12 / ath Is-' 200 180 160 Ka =0.048 140 120 100 80 60 5 40 20 0 H-VH Hi -+-+-0 500 1000 1500 2000 2500 3000 Kext [s1]
Figure 1-7: Flow vs chemical time scales for different fuels and inlet temperatures from DNS simulations of premixed laminar CH4/H 2/Air mixtures in a bluff body
stabilized combustor. The flow time scale is associated with a recirculation zone length while the chemical time scale is either represented by the flame speed (top) or extinction strain rate (bottom) of the chemical mechanism. Figures were generated using data from Michaels et al. [6].
1.3.1
Numerical Modeling
The choice of reaction mechanism plays an important role in modeling oxy-combustion flames. In a highly CO2 rich environment, reaction rates are much different than
from conventional methane air-combustion due to the chemical effect of C02; mainly
influencing the reaction: CO + OH + C02 + H. Until now there is no clear consensus on which reaction mechanism should be used for oxy-combustion whether it is which detailed mechanism for simpler calculations or which reduced/global mechanisms for
CFD modeling of oxy-combustion.
Detailed Mechanisms
Detailed reaction mechanisms for oxy-combustion are not very plentiful and there are so far only a few mechanisms that have been tested under these conditions. There are also not many comprehensive comparative studies analyzing which mechanism best captures effects in these high-C02, and close to stoichiometric environments.
The three detailed mechanisms which are commonly used in the literature for oxy-combustion of methane are, the GRI-Mech 3.0 [54], the mechanism developed by Glarborg et al. [13, 55, 56], and the recently developed AramcoMech 1.3 mechanism
by Metcalfe et al. [57]. This new mechanism has recently started to appear in
literature studies on methane oxy-combustion mixtures [9, 58]. Unlike the other two mechanisms, the AramcoMech 1.3 is based on a recent O-H model [59] and includes an improved rate constant for the reaction H
+
02= OH+ 0 [60]. However it doesn't include a model for nitrogen oxides (NO,) formation but as has been shown, these compounds are negligible for realistic 02 purities [61], therefore it should not be a problem when using the AramcoMech 1.3. Table 1.1 compares the number of species and reactions of these three detailed mechanisms for oxy-fuel combustion.Recently, Bongartz et al. [9] performed a comparison of these mechanisms by looking at burning velocities, ignition delay times and CO concentrations. Figures
1-8 to 1-10 show some of these results. All three mechanisms correctly capture the
Mechanism No. of Species No. of Reactions
GRI-Mech 3.0 53 325
Glarborg et al. 49 350
AramcoMech 1.3 124 766
Table 1.1: Detailed mechanisms for methane oxy-combustion
1.L --- AramcoMech 1.3 - - GRI-Mech 3.0 Glarborg et al. 0.5 C 0 0 0.1 0.2 CO2 Mole Fraction [-]
Figure 1-8: The modeling results (lines) are shown along with the experimental data (symbols) of Halter et al. [7] (o) and Kishore et al. [8] (A) for the reduction of the laminar burning velocity of stoichiometric CH4-air flames with CO2 addition (T
300 K, p = 1 atm) (reproduced from [9]).
Figure 1-8) This trend is well established in the literature and it has been shown that both thermal and chemical effects are responsible for the reduction in laminar burning velocity when adding CO2 to CH4-air flames [62, 7, 8].
With H20 dilution of CH4-air flames, the impact on the burning velocity of CH4
has also been looked at in a number of studies [10, 11, 12, 63]. Figure 1-9 shows this effect on the burning velocity at two pressures comparing the mechanisms' results with the experimental data. All three mechanisms agree with the data equally well at atmospheric pressure but the AramcoMech 1.3 appears to perform better at the higher pressure.
Bongartz et al. [9] also showed that all of the mechanisms were able to reproduce the inhibiting effect of large CO2concentrations on CO oxidation observed by Abin et
p=latm p=15atm AramcoMech 1.3 1 -rGRI-Mech 3.0 Glarborg et al. 0.5 0.5 00 0 0 0 0.1 0.2 0 0.1 0.2
H20 Mole Fraction [-] H2 0 Mole Fraction [-]
Figure 1-9: The modeling results (lines) are shown along with the experimental data (symbols) of Albin et al. [10] (A,7), Mazas et al. [11] (0), and Babkin and V'yun [12] (o) for the reduction of the laminar burning velocity of stoichiometric CH4-air
flames with H20 addition at atmospheric pressure (reproduced from [9]).
al. [64] both for lean and rich conditions. Moreover the mechanisms also captured the inhibiting effect of larger concentrations of H20 on CO oxidation, at the extremely
lean conditions (0 ~ 0.04) observed by Glarborg et al. [65].
Looking now at CO formation for CH4 oxidation in the atmospheric reactor of
Glarborg and Bentzen [13], all of the mechanisms predict the effect of CO2 on CO concentrations (see Figure 1-10). At the more practical stoichiometric condition, the AramcoMech 1.3 appears to have a better agreement with the experimental data compared to the other mechanisms.
The GRI and Glarborg mechanisms were also compared by calculating their lami-nar burning velocities and extinction strain rates in a counterflow non-premixed flame configuration in a study by Watanabe et al. [18]. The calculations were compared to experimental data by Maruta et al. [66] in a similar flame configuration and inflow conditions. The results of the extinction strain rate calculations will be shown later in Figure 3-8. But the calculations showed that the Glarborg mechanism with radiation seems to have the best agreement with the experimental data for the oxy flame. This

![Figure 1-11: Calculated temperature and CO 2 mole fraction profiles showing the com- com-parison between detailed and global kinetic mechanisms (10% N 2 in oxidizer stream) for a laminar diffusion flame (reproduced from [14]).](https://thumb-eu.123doks.com/thumbv2/123doknet/14755286.582201/44.917.126.747.156.362/calculated-temperature-fraction-profiles-detailed-mechanisms-diffusion-reproduced.webp)