DIVERSION SCENARIOS IN AN AQUEOUS REPROCESSING FACILITY By
ARCHIVES
Lindsay Lorraine Calder6n
SUBMITTED TO THE DEPARTMENT OF NUCLEAR SCIENCE AND ENGINEERING
IN PARTIAL FULFILLMENT OF THE REQUIREMENTS FOR THE DEGREES OF BACHELOR OF SCIENCE IN NUCLEAR SCIENCE AND ENGINEERING
AND
MASTER OF SCIENCE IN NUCLEAR SCIENCE AND ENGINEER
AT THE MASSACHU'
OF TE
MASSACHUSETTS INSTITUTE OF TECHNOLOGY
A
AUG
JUNE 2009
02009 Massachusetts Institute of Technology. All rights reserved.
SETS INSTf
1
1
9
2009
--,I
'
Signature of Autho
Lindsay Lorraine Calder6n Department of Nuclear Science and Engineering May 21, 2009
Certified by:
Certified by:
/2
/
" Michael W. GolayProfesZ. Nuclear Science and Engineering Thesis Supervisor
John A. Bernard, Jr.
SDirector
of Reactor OperationsA
'9
Thesis ReaderAccepted by:
S-/
- Jacquelyn C. Yanch
Professor of Nuclear Science and Engineering Chair, Department Committee on Graduate Students
Diversion Scenarios in an Aqueous Reprocessing Facility By
Lindsay Lorraine Calder6n
Submitted to the Department of Nuclear Science and Engineering on May 21, 2009 in Partial Fulfillment of the Requirements for the degrees of Bachelor of Science in Nuclear Science and
Engineering and Master of Science in Nuclear Science and Engineering
Abstract
The International Atomic Energy Agency requires nuclear facilities around the world to abide by heavily enforced safeguards to prevent proliferation. Nuclear fuel reprocessing facilities are designed to be proliferation-resistant and to use surveillance systems. While experience with small-scale reprocessing facilities has allowed for well understood safeguards, large-scale reprocessing facilities pose a new difficulty because of the larger error margins involved with the large volumes of spent fuel that is being processed. First, a hypothetical spent nuclear fuel reprocessing facility is described along with proliferation resistance methods typically used in actual facilities. This model establishes a foundation for studying diversion scenarios using a success tree method.
Thesis Supervisor: Michael W. Golay
Title: Professor of Nuclear Science and Engineering Thesis Reader: John A. Bernard, Jr.
Acknowledgments
First, and foremost, I thank God for providing me with this opportunity to complete my studies here at MIT. God gave me the strength necessary to stay on top of tasks throughout my education.
I am sincerely grateful to Professor Golay for his financial support during the first term of this project as well as for his patience, understanding, and advice in the production of my thesis. I thank Dr. Bernard for being the reader of this thesis and providing feedback and valuable comments. I also thank Monica Regalbuto for her clear explanations and the useful references for developing this thesis. I am also thankful to Edoardo Cavalieri d'Oro for his guidance in developing the analysis.
I am very grateful to the Nuclear Science and Engineering Department faculty and staff for their support. I especially would like to thank Peter Brenton for providing accommodations to continue working on my thesis when I developed repetitive stress injuries in my wrists. I also thank my officemate at the MIT Reactor, Frank Warmsley, for all his help including helping me improve the setup of my workstation.
I would also like to acknowledge my friends who increased my enjoyment of my time here at MIT. David Carpenter I thank for his explanations of various class material even when he was not the teaching assistant. Kerry Cheung also frequently reminded me to eat dinner during times I was really busy and had forgotten. Robert Schuman also invited me to many cups of tea to take breaks from long days of school.
Finally, I thank my parents, Adan and Ada Linda Calder6n, for providing their support throughout my life and my education, as well as my older brother, Adan Calder6n Jr., for his guidance and support when I needed him.
Also, thanks to everyone else not mentioned here who have helped me reach this point in life.
Table of Contents
Abstract ... 3 Acknowledgments... ... 5 Table of Contents ... 6 List of Figures ... ... 7 List of Tables ... 9 Abbreviations ... ... 10 Introduction... ... 131 Reprocessing Facility General Description ... 15
1.1 General Description... 15
1.2 Entering and Exiting Procedures... ... 16
1.3 External Surveillance ... ... 19
1.4 Inside the Facility ... ... 20
1.5 Fuel Shipments... 21
1.6 Conclusion... 22
2 Chemical Process and M echanical System s ... 23
2.1 Fuel Chopping and Decladding... ... 23
2.2 Aqueous Reprocessing ... ... 23
2.3 Contactors... 26
3 Safeguards, Surveillance, and Detection ... 29
3.1 Determ ining Safeguards Requirements... 30
3.2 IAEA Surveillance and Detection System s... ... 31
3.2.1 MBA-i: Spent Fuel Receipt and Storage Head-End Area... 32
3.2.2 M BA-2: M ain Process Area... 33
3.2.3 M BA-3: W aste Treatment and Storage Area... ... .. 34
3.2.4 M BA-4: M OX Conversion Area ... 35
3.2.5 M BA-5: Product Storage Area... 36
3.3 M aterial-Accountancy Challenges ... 36
3.4 Conclusion... ... 37
4 Obtaining W UM within the Facility ... 39
4.1 Diversion M ethods ... ... 39
4.2 Conclusion ... 43
5 Diversion Scenario Success Tree Analysis... 45
5.1 Success Tree M ethodology ... ... 45
5.1.1 Obtaining M aterial within the Facility... ... 45
5.1.2 Taking M aterial out of the Facility ... . .. 49
5.2 Other Considerations... 55
6 Conclusion ... 57
7 References ... ... 59
Appendix A - Sample Diversion Scenario Data... 61
List of Figures
Figure 1-1. Reprocessing facility above shows the reprocessing building that is accessible via underground tunnels from either the shipment building or the administrative building. This facility is also enclosed with gates and monitored with cameras (not shown)... 16 Figure 1-2. Man is entering the reprocessing building. Camera records the man entering while
the turnstile has a weight that records his entering mass. RFID sensor grants access after successfully verifying identity via RFID. ... ... 18 Figure 1-3 .Spent fuel pool drawn to scale with crane moving across the pool. Camera
surveillance located above columns... 20 Figure 1-4. The hot cells shown here are representative of those found in the laboratory for
sampling material. These hot cells have external arm manipulators to handle material inside. Image based on on-site laboratory photo of the Rokkasho facility (Matsuo, 2008, p. 15) ... ... ... 21 Figure 2-1. The aqueous process here describes the flow and separation of material through the
various stages. This figure was based on another figure developed by Argonne National Laboratory (2006, p. 8)... 24 Figure 2-2. Pulse column above shows organic entering at the bottom, feed at the center, and
aqueous at the top. Streams produce a mixture flowing through a torturous path. Fluid then separates into aqueous at the bottom and loaded organic at the top. Image based on image produced by Law (2008)... .. 27 Figure 2-3. Mixer-Settler above has two main compartments. In the first section, aqueous and
organic are mixed. The second section allows for material to separate by gravity. Image based on image produced by Law (2008) ... ... 28
Figure 2-4. Centrifugal contactor showing the inlet of the organic phase on the lower left and the aqueous phase and feed in the lower right. Materials are mixed and then separated using centrifugal force. Loaded organic phase exits through the center toward upper right and aqueous phase exits from the outside toward the upper left. Image based on image
produced by L aw (2008) ... 28 Figure 3-1. MBA structure for material accountancy at RRP as shown by Iwamoto et al. (2006)
... 3 2
Figure 5-1. Success tree structure shows strategies to divert WUM ... 46 Figure 5-2. Tree branch shows available paths to obtain WUM as a trace contaminant from
either the spent solvent or product streams by varying the chemistry in the process... 47 Figure 5-3. Tree branch shows available paths to obtain WUM by collecting the material within
the system by varying the chemistry in the process... ... 48 Figure 5-4. Tree branch shows available paths to obtain WUM by taking it directly from the
raffinate stream . ... 49 Figure 5-5. Tree branch shows potential strategies to defeat detector systems ... 51 Figure 5-6. Tree branch shows potential strategies to defeat surveillance systems... 54
List of Tables
Table 1. Volumetric Flow Rates of Streams in Nominal Scenario... 40
Table 2. Volumetric Flow Rates of Streams in the First Diversion Scenario... 41
Table 3. Volumetric Flow Rates of Streams in the Second Diversion Scenario ... 41
Table 4. Volumetric Flow Rates of Streams in the Third Diversion Scenario ... 42
Table 5. Nominal Scenario for UREX Fuel Reprocessing ... 61
Table 6. First Diversion Scenario for UREX Fuel Reprocessing ... 62
Table 7. Second Diversion Scenario for UREX Fuel Reprocessing... ... 63
Abbreviations
ARBI Adjusted Running Book Inventory
ASAS Automatic Sampling Authenticated System
Ba Barium
CCTV Closed Circuit Television CRD Camera/Radiation Detector
Cm Curium
C/S Containment and Surveillance
Fe+2 Ferrous Ion
Fe+3 Ferric Ion
FKMP Flow Key Measurement Point GPS Global Positioning System
HAW High Active Waste
HALW High Active Liquid Waste HKED Hybrid K-Edge Densitometry HMS Hulls Monitoring System
IAEA International Atomic Energy Agency ICVD Improved Cerenkov Viewing Device IDMS Isotope Dilution Mass Spectroscopy IHVS Integrated Head-End Verification System IIV Interim Inventory Verifications
IKMP Inventory Key Measurement Point
JNFL KMP LASCAR LASW MBA MOX MUF NDA NH2SO3 NO2- NO3-NRTA OOC OSL OSP PCAS PIMS PIV Pu PuN PuO2(NO3)2 -PUREX RBI
Japan Nuclear Fuel Limited Key Measurement Points
Large Scale Reprocessing Plant Safeguards Low Active Solid Waste
Material Balance Area Mixed Oxide
Material Unaccounted For Non-Destructive Assay Sulfamate Ion Nitrite Ion Nitrate Ion Near-Real-Time Accountancy Out of Commission On-site Laboratory Other Strategic Point
Plutonium Canister Assay System
Plutonium Inventory Measurement System Physical Inventory Verification
Plutonium
Plutonium Nitride Plutonyl Nitrate
Plutonium Uranium Extraction Running Book Inventory
RFID RRP SMMS SQ SRD TBP THORP U UBVS UN UO 2(NO 3 )2-UREX VCAS WCAS WDAS WUM
Radio Frequency Identification Rokkasho Reprocessing Plant
Solution Measurement and Monitoring System Significant Quantity
Shipper/Receiver Differences Tri-n-butyl Phosphate
Thermal Oxide Reprocessing Plant Uranium
Uranium Bottle Verification System Uranium Nitride
Uranyl Nitrate Uranium Extraction
Vitrified Canister Assay System Waste Crate Assay System Waste Drum Assay System Weapons Usable Material
Introduction
A nuclear reprocessing facility may be an excellent idea in terms of reducing waste entering the environment, but there is one major concern that keeps fuel reprocessing from becoming widely accepted. Public fear of proliferation has stunted the growth of interest in reprocessing. In developing and running a large-scale reprocessing facility, the complication is whether or not it can be built such that weapons-usable material (WUM) is properly accounted for at all stages from arrival to delivery. Despite all the current technology and safeguarding, determination of the limitations within reprocessing facilities in order to understand the risks involved is still a challenge.
This thesis explores such possible weaknesses by focusing on an aqueous reprocessing facility as the site for WUM diversion. The following sections describe the layout of a hypothetical aqueous reprocessing facility, safeguards requirements, surveillance systems, detection systems, chemical processes and their associated mechanical systems, and some potential methods for diversion. Given that the focus is on aqueous reprocessing, the main question is, "What is the facility's proliferation success tree structure?" This thesis analyzes attractive diversion scenarios for an aqueous fuel reprocessing facility using a success tree format.
This study focuses on the various approaches and the ease of proliferation from the facility operator's point of view. In other words, the facility operators themselves are the proliferators trying to defeat safeguards imposed by external organizations. The success of diversion is dependent on the probability of successfully defeating the various preventive measures considering that there may be multiple attempts or pathways taken without getting caught. For the purpose of this study, a success tree is used to compare different diversion
approaches. The overall study of attractive diversion scenarios for aqueous reprocessing facilities will determine the feasibility to divert material and hopefully prompts design reconsiderations that can target any current weaknesses.
1 Reprocessing Facility General Description
The focus of this study involves analyzing key information relevant to diverting material from a nuclear reprocessing facility. Because this information is sensitive material, reprocessing facilities do not make available complete and detailed descriptions of the facility. However, there is a general trend for how nuclear facilities are laid out and procedures for entering and exiting the facility. In the following sections, a fictitious reprocessing facility is crafted based on various sources describing real nuclear facilities. Referenced sources include published literature, pictures, videos, and personal tours of existing nuclear facilities. The crafting of such kind of fictional reprocessing facility is done in order to study potential diversion scenarios, which are discussed in later chapters.
1.1 General Description
The reprocessing facility consists of three major buildings (see Figure 1-1). The first is the main administrative building. The second is the reprocessing building where the actual fuel handling takes place. The last building is the shipment building. Entering the reprocessing building requires going either through the administrative building or the shipment building via underground tunnels. The reprocessing building is built as a containment building for the fuel. When the reprocessing building was first built, the construction was overseen by IAEA inspectors to verify that it was according to the schematics. Any changes made since the construction were also reviewed by IAEA inspectors.
The reprocessing facility has about 10,000 employees who ensure the continual reprocessing operation (Sellafield Ltd). This group of people handles not only the fuel reprocessing, but everything necessary to maintain a semi-independent reprocessing facility such as repairs, maintenance, and radiation protection. External to the facility's employees are police
who visit throughout the day and are on call for any emergencies. Resident IAEA inspectors are
also on-site 24 hours a day and perform random inspections of the facility using their own equipment and their own laboratory (Iwamoto, Ebata, Fujimaki, & Ai, 2006).
Reprocessing Administrative Building Building Underground Shipment Tunnels Building Parking Lot
Figure 1-1. Reprocessing facility above shows the reprocessing building that is accessible via underground
tunnels from either the shipment building or the administrative building. This facility is also enclosed with
gates and monitored with cameras (not shown).
Personnel verification and logs are done via RFID name badges when entering secured areas. In addition, keys to enter certain restricted areas are distributed based on training and clearance levels. There is a key cabinet with keys to all areas accessible to the person in charge in the main operations room.
The reprocessing facility also continuously operates 24 hours a day, 7 days a week with few maintenance and major holiday shutdowns. During evening and night shifts, only minimum staff is on-site to verify processes are functioning normally. Other personnel remain on call for any emergencies.
1.2 Entering and Exiting Procedures
To enter the main building, an RFID name badge is required. This type of badge is distributed to everyone from administrators to maintenance staff. After entering the building,
there are several administrative offices. The fuel reprocessing occurs in a separate building that branches off from the main building.
The primary entrance to the reprocessing facility is from within the main building, although there are other exits such as those for the shipment building and emergencies that are not attached to the main building. Nonetheless, these exits are still confined within a fenced boundary under constant video surveillance. In order to enter the restricted area, an RFID name badge is required. This badge is obtained by undergoing radiation training and a thorough background check. The name badge is only used to enter the restricted area, and keys must be used to enter any further restricted areas within the reprocessing facility.
There is a video documenting a tour of the Thermal Oxide Reprocessing Plant (THORP) that goes through the entering process. The tour first enters a locker room where one removes shoes and socks and proceeds to put on special socks. Then, each individual passes through a turnstile and enters a shoe room. The setup of the facility entrance is similar to that shown in Figure 1-2. Everyone puts on a clean lab coat upon entering the shoe room and proceeds to a bench as directed. The shoe room is divided by a bench that cuts through the room to separate the clean area from the potentially contaminated area. Under the bench facing the unclean area are cubbyholes for storing shoes used in the potentially contaminated area. Shoes are put on by taking shoes out of the cubbyhole and swinging over the bench into them while avoiding stepping on the clean side of the bench. Everyone then signs in to enter the facility. To exit the facility, the entry procedure is reversed with a few additions such as frisking for contamination prior to exiting (sinema7, 2007). Detectors for this can include whole body detectors integrated into a turnstile like mechanism that allows only one person through at a time.
Figure 1-2. Man is entering the reprocessing building. Camera records the man entering while the turnstile
has a weight that records his entering mass. RFID sensor grants access after successfully verifying identity via RFID.
In a personal tour of a power plant in Japan, a nearly full set of clothing was provided. This included a full body suit and a hardhat in addition to the socks and shoes, all of which were nearly identical to those worn by personnel except for the visitor tags and color coding. These were all returned to the facility at the end of the tour after frisking for contamination in a whole body detector and changing back into normal clothes. Personnel are required to wear working clothes inside the restricted area, and the employee uniform in the main building. When entering and exiting the restricted area, they undergo similar procedures as those described for visitors. The main difference would be the use of RFID badges to enter rather than signing in. With the level of security for entering and exiting, taking WUM out of the restricted area in one's person through the primary entrance is not a simple task.
In addition to the entering and exiting measures described above, other facilities are also known to use additional procedures and strategies for personnel entering or exiting accountability. For example, some facilities keep weight records prior to entering and compare
them to exiting weight (M. Golay, personal communication, February 18, 2009). Facilities that use this strategy prohibit eating and drinking in the facility because of the hazards related to fuel reprocessing. There are also no bathrooms within the facility, and personnel must use bathroom facilities in the main building. Because of this, weight should in principle not change, although bringing in tools and equipment for maintenance are likely handled differently in the entrance procedures.
1.3 External Surveillance
There are cameras outside the facility that feed to a recording system that stores information for about three months prior to being written over. There is a receptionist at the entrance during regular business hours. The front door is locked at all times and requires either an RFID badge or keys to enter. There are no metal detectors at the entrance to the main building although visitors may be required to walk under one prior to a tour. During non-business hours, only minimum staff is on site, and only cameras watch the entrance.
Every day, there are various routine security inspections done throughout the day to verify that the facility has not been breached. These are done by personnel on site and by police who visit every few hours. Personnel performing these security inspections verify that emergency exits and fences have not been tampered with. A more rigorous security inspection is done on a weekly basis to make sure that fuel-containing areas within the facility have not been compromised. Cameras and the associated monitors and recording system are also checked for signs of physical damage, while surveillance monitors are verified to be still capable of alarming should there be any signs of tampering in the area. Police inspections consist of verifying that any alarming condition related to a security breech does in fact send the proper signal to the police department.
1.4 Inside the Facility
According to information regarding the Rokkasho Reprocessing Plant (RRP) as described
by Iwamoto et al. (2006), the inside of the facility is divided into five sections where all relevant
processes occur. The first section is where material is received and stored. This area contains a large pool specifically designed to hold fuel in a particular configuration such that it prevents criticality. Fuel in the pool is very radioactive and requires a well-shielded and heavy transfer cask attached to a crane for movement. Also, there are various cameras and detectors around the pool to guard the spent fuel as shown in Figure 1-3.
Figure 1-3. Spent fuel pool drawn to scale with crane moving across the pool. Camera surveillance
located above columns.
Iwamoto et al. (2006) describes the next section as the area where all the main processes take place including the uranium conversion area. Processes in this area include fuel chopping, dissolving, and aqueous separation. There is also an On-Site Laboratory (OSL) for inspections that has the necessary equipment to perform tests on any stage of the reprocessing. Figure 1-4 shows the hot cells present in the OSL used by the IAEA inspectors. Wastes from the Main Process Area end up in the Waste Treatment and Storage Area, while uranium and plutonium go to the Mixed Oxide (MOX) Conversion Area. The final product ultimately goes to the Product
Storage Area. In terms of surveillance, there are over 50 monitoring systems and 70 cameras throughout the facility. These are primarily used by the IAEA and State inspectors, but can also
occasionally be used by facility operators (Iwamoto, Ebata, Fujimaki, & Ai, 2006).
Figure 1-4. The hot cells shown here are representative of those found in the laboratory for sampling
material. These hot cells have external arm manipulators to handle material inside. Image based on on-site laboratory photo of the Rokkasho facility (Matsuo, 2008, p. 15)
1.5 Fuel Shipments
The reprocessing facility is designed to handle fuel from power plants around the country. Nuclear fuel is received and dispatched in the form of fuel elements every two weeks. The fuel is transported in an ordinary looking shipping truck with a few markings indicating that special material is being handled. Additionally, the truck is accompanied by police vehicles while being continuously monitored via a global positioning system (GPS) using satellites to verify its
location at all times. The truck driver is specially trained to deal with any problems that may
arise during the fuel shipment.
The arrival site is a truck lock leading to the shipment building. Here, a team of trained employees verify the shipment by checking for the double seal on it as well as comparing its
contents to the shipment papers. The fuel is kept underwater in the transport cask until it is moved into the spent fuel pool. The fuel is identified during the movement. The entire process of receiving and moving the fuel is done by a qualified team following written procedures.
When new fuel is being dispatched, the fuel is placed in a shipping cask by the qualified team. The reprocessing facility is responsible for the fuel accountability and shipment until the shipment truck delivers it. The truck is again tracked using real-time GPS technology and escorted by police until it reaches its destination. Additionally, the reprocessing facility personnel monitor the shipment by contacting the delivery service provider. The shipper is not trained to handle nuclear material and thus is not responsible for verifying the shipping cask contents prior to departure from the reprocessing facility. The shipper is only accountable for transporting the cask while leaving the contents intact. The actual fuel content is then verified upon arriving at its new destination.
1.6 Conclusion
The reprocessing facility crafted above is intended as a representation of a real reprocessing facility. The use of the various assembled sources to create a fictional reprocessing facility is done as an example to determine weaknesses that a proliferator could potentially exploit. The resulting description of the facility and its use is carefully conceived and believed sufficiently accurate so that any exploitable weaknesses are minimized as would be the case in a real reprocessing facility.
2 Chemical Process and Mechanical Systems
Fuel separation is done to extract useful material from spent fuel. One method known as the aqueous process uses counter-current flow of two immiscible liquids, one aqueous and one organic, to extract "tagged" material from the solution. The following explains the mechanical process for decladding, the aqueous extraction process, and the components used in the extraction.
2.1 Fuel Chopping and Decladding
Spent fuel comes in complex forms of various element shapes and sizes held together by structural materials like zircaloy and aluminum. To take advantage of the aqueous process, spent fuel needs to be presented in liquid form. This is achieved by chopping the fuel elements and dissolving them in nitric acid. The nitric acid solution separates the fuel from the cladding material and prepares the fuel for the aqueous extraction process as will be discussed in the following section.
2.2 Aqueous Reprocessing
The extraction of materials is done through the careful manipulation of the wanted element's oxidation state such that it travels through various stages while sequentially being extracted from one liquid to the other through the use of contactors and immiscible liquids (Long,
1967, p. 163).
Figure 2-1 shows the main idea behind aqueous reprocessing. The decladding process previously explained also changes the valence states of plutonium and uranium to ones that will adequately interact with the aqueous process. This change of valence state acts as a tag for the material to be extracted.
/
For the The add this stat (Long, forming II
+
TLExtraction Scrub Strip
Figure 2-1. The aqueous process here describes the flow and separation of material through the various stages. This figure was based on another figure developed by Argonne National Laboratory (2006, p. 8). Plutonium-Uranium Extraction (PUREX) process, the (IV) and (VI) states are preferable. ition of the nitrite ion both reduces Pu(VI) and oxidizes Pu(mI) to Pu(IV) as follows:
PuO2+2 + NO2- + 2H --+ Pu + NO3- + H20 (2.1) 6Pu+3 + 2NO2" + 8H+ -- 6Pu+4 + N2 + 4H120 (2.2) Uranium also undergoes a similar reaction to convert to its preferential valence state. In
:e, the plutonium will be extracted using a solvent such as tri-n-butyl phosphate (TBP)
1967, p. 172). The TBP behaves such that it "extracts uranyl and plutonyl nitrates by disolvated complexes" as shown below (Long, 1967, p. 187):
UO2+2 + 2NO3- + 2TBPorg + UO2(NO3)2-" 2TBPorg (2.3)
PuO+2+ 2NO3- + 2TBPorg + PuO2(NO3)2-- 2TBPorg (2.4)
According to Benedict and Pigford (1957), in the PUREX process, fresh solvent along with the dissolved fuel first enters the extraction stage. The TBP preferentially selects the U and Pu because of the valence state while leaving behind a raffinate containing fission products. This U and Pu stream then proceeds to the scrubbing stage where lingering fission products are scrubbed off with a nitric acid solution and complexant and are then deposited into the raffinate. Next, the "raffinate is evaporated to recover nitric acid" and reduce the volume of the waste (p.
320).
Long (1967) then explains that the next step involves stripping the plutonium from the organic solvent. However, prior to stripping, it is necessary to destroy the nitrite ion so that it will not interact with the process. The addition of sulfamate ion does this as shown below:
NH2SO3- + NO2- -- N2 + H20 + SO4-2 (2.5)
Ferrous sulfamate is used because the ferrous ion reduces plutonium to the (III) valence state so that it can properly interact. As the plutonium gets reduced, the ferrous ion gets oxidizes as follows (p. 172):
Pu+4 + Fe+2--_ PU+3 + Fe+3 (2.6)
Continuing the flow of the U and Pu stream, the organic loaded solvent is contacted with an aqueous nitric acid aqueous strip where U remains in the organic phase while the Pu enters the product (Benedict & Pigford, 1957, p. 320).
The UREX process is similar to the PUREX process except for a few minor modifications. The important difference is that the ultimate goal of the UREX process is to retrieve U while containing the Pu within the raffinate, thus making it more proliferation-resistant. Meanwhile, the PUREX process is primarily used to obtain Pu (M. Regalbuto,
personal communication, November 2008). The main modification to the PUREX process for U extraction is the addition of a complexing agent to the scrub phase. This complexant prevents Pu as well as Np from being extracted into the product (Thompson, Norato, Kessinger, Pierce, Rudisill, & Johnson, 2002, p. 2)
2.3 Contactors
Contactors are used to separate the organic solvent from the aqueous solution by first mixing the two phases and then allowing them to separate. This is done so that the two phases interact thereby allowing the organic solvent to extract the appropriate species from the aqueous solution. Three major types of contactors are typically used: pulse columns, mixer settlers, and centrifugal contactors. These contactors fundamentally produce the same result, although the method by which it is achieved is different.
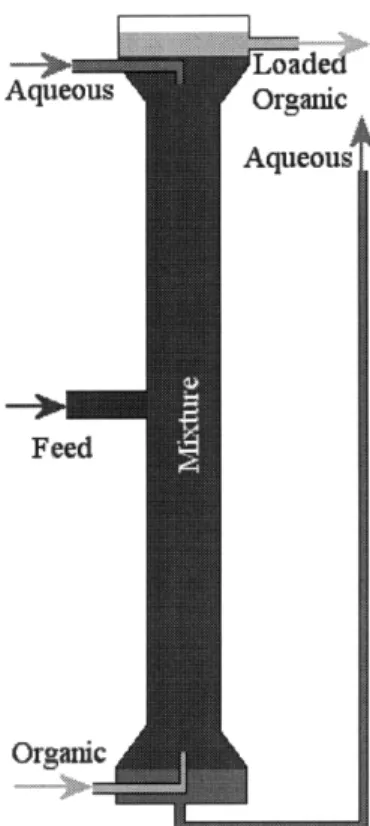
A pulse column (See Figure 2-2) behaves very much like the liquid timer toys in which, when turned upside down, colorful water flows downward as oil floats upward because of density differences. In this application, however, the difference would be that oil and water are not being used and the contactor is not turned over. Rather an organic solvent and aqueous solution interact such that only certain materials are exchanged. According to Flagg, the column contains materials such as sieves to provide a torturous path for the fluids that are flowing through the column. The aqueous solution flows from the top down interacting with the feed which enters from the center and the solvent which enters from the bottom. The liquids are mixed and then separated as they flow through the pulsed column. Resulting is an organic stream that flows out of the top of the column and an aqueous stream that is removed from the bottom (Flagg, 1961).
I -Aqueous Feed Organic Aqueoust Organic
Figure 2-2. Pulse column above shows organic entering at the bottom, feed at the center, and aqueous at
the top. Streams produce a mixture flowing through a torturous path. Fluid then separates into aqueous at the bottom and loaded organic at the top. Image based on image produced by Law (2008).
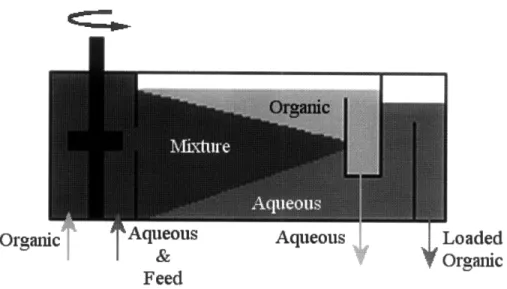
A mixer settler consists of two sections (See Figure 2-3). In the first section, the aqueous
and feed solution and the organic solvent are thoroughly mixed with an impeller. The mixture then flows into another compartment where the solutions are allowed to separate by gravity. The aqueous and the loaded organic phases are separated and streamed out from their separate compartments (Law, 2008).
Centrifugal contactors work by insertion of aqueous solution, feed, and organic solvent from outside the contactor. The streams are mixed with mixing paddles that force the flow into a centrifugal bowl. The mixture then separates into a light phase of loaded organics drawn from the center and the heavy phase of aqueous solution drawn from the outside. See Figure 2-4.
Organic
Aqueous
Aqueous
Aqueous
Feed
Loaded
Organic
Figure 2-3. Mixer-Settler above has two main compartments. In the first section, aqueous and organic are
mixed. The second section allows for material to separate by gravity. Image based on image produced by Law (2008). Aqueous Organic Loaded Organic Aqueous & Feed
Figure 2-4. Centrifugal contactor showing the inlet of the organic phase on the lower left and the aqueous
phase and feed in the lower right. Materials are mixed and then separated using centrifugal force. Loaded organic phase exits through the center toward upper right and aqueous phase exits from the outside toward the upper left. Image based on image produced by Law (2008).
3 Safeguards, Surveillance, and Detection
In many nuclear facilities, safeguards for protecting nuclear materials are imposed by the IAEA. These safeguards provide strict material handling requirements as well as material accounting regulations. Furthermore, the IAEA enforces these safeguards by conducting random inspections of the facilities. These may include visiting the sites in addition to collecting records of the facility's fuel shipments and operating history for later study offsite. Additionally, the IAEA uses their own equipment such as cameras, recorders, and detectors for inspecting these sites so as to prevent any unauthorized use of equipment.
For a reprocessing facility, the IAEA also attempts to impose safeguards that would quickly detect the diversion of a significant quantity (SQ). By doing so, the ability for a reprocessing facility to smuggle WUM is greatly reduced.
This concept works fine for small-scale reprocessing facilities because the IAEA does not have much trouble ensuring the safe and in-spec operation. Because of the small volumes of fuel being reprocessed, the IAEA does not face much difficulty in confirming that a SQ of WUM does not go unaccounted for simply because an SQ is far greater than the allowed accountability error margin.
On the other hand, for a large-scale reprocessing facility, the accountability error margin would be greater than several SQs because of the large volumes of spent fuel being processed. Thus, the proper accountability of WUM becomes resource-intensive requiring high precision, high accuracy, and constant surveillance in order to be proliferation resistant. Until now, the IAEA still has not been able to develop credible safeguards because of lack of experience and understanding (Iwamoto, Ebata, Fujimaki, & Ai, 2006, p. 1). With this in mind, this chapter
discusses proposed safeguards guidelines and potential requirements as well as surveillance and detection systems.
3.1 Determining Safeguards Requirements
Iwamoto et al. discusses methods developed with the help of IAEA and JNFL and used to create their own safeguards requirements for the RRP. Between the years of 1988 and 1992, LASCAR (Large Scale Reprocessing Plant Safeguards) was developed as a multinational forum that showed that "an effective safeguards approach could be implemented to a large scale reprocessing plant while maintaining an efficient use of resources." The following is a list of the LASCAR recommendations as described by Iwamoto et al.:
* High accurate measurement systems for the nuclear material accountancy * Timeliness of verification by advanced nuclear material accountancy techniques * Redundant and independent containment and surveillance systems
* Early consultations on facility characteristics especially early and continuing design information verification
* Authentication of equipment and systems made available by operator * On-site verification capabilities
* Data acquisition and transmission
* The on-going or needed research and development tasks (Iwamoto, Ebata, Fujimaki, & Ai, 2006, p. 1).
Additionally, Appendix A in Nuclear Safeguards and the International Atomic Energy Agency (1995) describes the use of material balance areas (MBAs) to section of the facility into
areas where inventories of items and amounts can be reliably taken. Key Measurement Points (KMPs) are also useful for measuring flow at strategic locations throughout the facility. Both
Near-Real-Time Accountancy (NRTA) of material along with Containment and Surveillance (C/S) of the material as it travels through the facility are necessary for maintaining safeguards (U.S. Congress, Office of Technology Assesment, 1995, pp. 114-115).
3.2 IAEA Surveillance and Detection Systems
Iwamoto et al. (2006) states that inspectors mostly use independent equipment, although occasionally they must share facility equipment that is used by operators because of limitations such as space and resources. Even though some sharing is unavoidable, great measures are taken to prevent tampering with the data or systems. For example, operators require approval prior to using shared equipment, signals are measured against reference standards, and C/S methods are used. Inspectors obtain samples for safeguards purposes through the Automatic Sampling Authenticated System (ASAS) using the Pneumatic Transfer Network (PTN) that connects sampling stations throughout the facility to the OSL. The OSL is particularly useful to both the IAEA and the State because it allows for timely and on-demand analysis by providing an area where questionable results can be identified and more carefully studied (pp. 2-3).
To meet the proposed safeguards requirements from the previous section, the RRP is divided into five major areas as described in section 1.3. These areas are where material accountability is performed and they correspond to the MBAs as shown in Figure 3-1.
Johnson et al. (2001) further describes the Inventory Key Measurement Points (IKMPs) within the MBAs as being defined according to the materials measured as well as the method with which they are measured. Within MBA-1, there are two IKMPs, which are the spent fuel receipt and storage area and the head-end area. MBA-2 consists of three IKMPs: nuclear material in the main process area, nuclear material in the analytical area, and nuclear material in the uranium conversion area. MBA-3 only has one IKMP being the nuclear material in the waste treatment
and storage area. MBA-4 also has only one being the nuclear material in the MOX conversion area. MBA-5 has two IKMPs separately accounting for U03 and MOX product material in the storage area. Additionally, Flow Key Measurement Points (FKMPs) and Other Strategic Points (OSPs) are determined to verify flow between and within boundaries respectively (p. 3). The following sections show the application of safeguards for the various MBAs shown as described by Johnson et al. (2001).
MBA - 2
Main Process Area Including U Conversion and
MBA - Analytical Laboratory MBA - 5
4 a Spent
Fuel-Product Storage
Receipt and Storage
Head-End Area MBA-3 MBA- 4 Area
MOX Conversion Waste Treatment and Storage Area
Area
Figure 3-1. MBA structure for material accountancy at RRP as shown by Iwamoto et al. (2006)
3.2.1 MBA-I: Spent Fuel Receipt and Storage Head-End Area
The spent fuel surveillance in MBA-1 begins after its arrival at the facility. The fuel is transported in a cask to the spent fuel pool. In this process, the actual receipt of the fuel is verified using the Integrated Spent Fuel Verification System (ISVS), which consists of "time synchronized CCTV cameras and radiation detectors". The volume of dissolved fuel batches, or Input Batches, that are to be transferred to the MBA-2 is determined with the Solution Measurement and Monitoring System (SMMS). The uranium and plutonium are sampled using the ASAS or Hybrid K-Edge Densitometry (HKED). Left over solid waste such as the hulls and cladding material are checked for traces of uranium and plutonium using the Hulls Monitoring
System (HMS), which then correlates the ratios of uranium and plutonium to those of 244Cm in both the hulls and dissolver solutions. A Shipper/Receiver Differences (SRD) evaluation is then performed on the nuclear material by balancing the Input Batches and the Head-End waste produced against the shipping reactor's declarations.
While the ISVS continuously monitors the spent fuel pool, the Head-End Process is checked on a monthly basis through Interim Inventory Verifications (IIV). SMMS, density correlations, and ASAS samples are used during the IIV.
Flow within MBA-1, which encompasses the transferring of fuel elements to the fuel chopper and subsequently the hulls to the storage, is monitored via the Integrated Head-End Verification System (IHVS), which "consists of a number of Camera/Radiation Detectors (CRDs) mounted in the cell walls, with additional CCTV units installed in the shear cell." The IHVS both confirms and records the spent fuel assembly and hull drum IDs. As for the dissolved fuel, it is monitored in the Head-End Process using SMMS.
Additionally, a Physical Inventory Verification (PIV) is performed yearly to verify spent fuel "using an Improved Cerenkov Viewing Device (ICVD)." Both samples and SMMS are used to confirm when the Head-End Process is cleaned-out (Johnson, et al., 2001, pp. 4-5).
3.2.2 MBA-2: Main Process Area
In the processes in MBA-2, Input Batches transferred over from MBA-1 are once again verified using SMMS for changes in inventory. The plutonium nitride batches that are to be sent to MBA-4 undergo volume verification via SMMS as well as HKED analysis using an ASAS sample. The uranyl nitrate that gets transferred to the conversion area within MBA-2 does not become verified, although U03 does undergo Non-Destructive Assay (NDA) for verification using the Uranium Bottle Verification System (UBVS) and C/S measures. High Active Liquid
Waste (HALW) batches being sent to MBA-3 also undergo SMMS and ASAS sample verification. For this verification, plutonium is analyzed via a Pu-VI spectrophotometric method and uranium via Isotope Dilution Mass Spectroscopy (IDMS). On the other end of the spectrum, Low Active Solid Waste (LASW) also being sent to MBA-3 gets verified by the Waste Crate Assay System (WCAS), a passive neutron counting system that measures Pu content.
IIV is also done on a monthly basis for MBA-2 in which all vessel volumes undergo SMMS verification as well as random sampling. Estimates are determined for inventories that cannot be measured using "established process design algorithms." NRTA methods are used to perform interim evaluations of Material Unaccounted For (MUF).
As for flow within MBA-2, the facility's proper operation is ensured through solution monitoring. The SMMS in this area consists of sensors to detect temperature and pressures, with which solution levels and density can be determined, as well as "neutron sensors on the extraction systems." Random samples are also taken and analyzed in the OSL throughout the month. Additionally, NRTA methods are used to perform MUF evaluations every one or two weeks.
The MBA-2 PIV is also done on a yearly basis consisting of SMMS analysis on remaining solutions after clean-out. Additional random samples are also taken and studied at the OSL (Johnson, et al., 2001, p. 5)
3.2.3 MBA-3: Waste Treatment and Storage Area
In terms of waste treatment within MBA-3, vitrified High Active Waste (HAW) must be analyzed using the Vitrified Canister Assay System (VCAS) prior to its being released from safeguards. VCAS functions much in the same way as the HMS in MBA-1 by using 2 4 4
Cm neutron emission detection to determine its content and then using the Pu:U:24 4Cm ratio found
through samples from the feed material and meltor to determine indirectly the nuclear material content. The neutron radiation data are then paired with cameras monitoring the measurement
station and verifying canister IDs.
The monthly IIV involves SMMS and ASAS sample verification of the liquid waste inventories. Pu-VI spectrophotometric analyses are also done in the OSL. Solution monitoring also confirms the flow within MBA-using SMMS verification of the HALW feed rate to the meltor. Random HAWL samples are also taken to be studied using the VCAS. The yearly PIV done during clean-out involves verifying the inventory in MBA-3 using SMMS and random sample analyses (Johnson, et al., 2001, p. 6).
3.2.4 MBA-4: MOX Conversion Area
After PuN batches are transferred over from MBA-2, the material balance is again verified using SMMS. Before Mixed Oxide (MOX) powder canisters can be sent to the MBA-5 storage areas, content verification must be done using a Plutonium Canister Assay System (PCAS), which is "based on high level neutron coincidence counting and high resolution gamma spectroscopy." Additionally, a PCAS camera records canister IDs while MOX powder samples are taken for IDMS based destructive analysis. Waste being sent to MBA-3 undergoes Waste Drum Assay System (WDAS) verification, "which is based on passive neutron multiplicity counting and high resolution gamma spectroscopy."
The monthly IIV calls for SMMS verification and random sample HKED analysis of all solutions with Pu. The Plutonium Inventory Measurement System (PIMS) verifies the plutonium going into the MOX conversion lines by using a total neutron counting technique. NRTA methods also check for MUF regularly. SMMS is again used to verify flow within MBA-4, while PIMS monitors MOX powder flow in the conversion lines. During the yearly PIV
clean-out, PIMS is used to ensure the clean-out was properly done as well as to measure residual material. SMMS and samples are used to study any leftover solution (Johnson, et al., 2001, pp. 6-7)
3.2.5
MBA-5: Product Storage Area
Neutron detectors and surveillance cameras ensure the arrival of MOX canisters in MBA-5. The combination of cameras and detectors allow for the tracking of both filled and unfilled MOX canisters moving from the PCAS station in MBA-4 to MBA-5. IIV strategies have not been finalized although C/S, random sampling and measurements have been considered. PIV is done yearly by comparing stored values to expected values based on previous counts and C/S accounting methods (Johnson, et al., 2001, p. 7).
3.3 Material-Accountancy Challenges
Appendix A in Nuclear Safeguards and the International Atomic Energy Agency (1995) describes some of the difficulties in material-accountancy faced even after all the safeguards are in place. This issue makes both detecting the existence or absence of a diversion a non-trivial matter. The accurate accountancy of vast dissolved plutonium quantities is a particular concern.
One of the major difficulties involves error margins. The requirement is that MUF should not exceed 8 kg (1 SQ) or 3.3 percent of the annual throughput, whichever is larger. This requirement, thus, allows for several SQs of MUF in the error margins each year. To address this limitation, the Running Book Inventory (RBI) method can be used. However, this method works by subtracting the output Pu from the input Pu without considering the material in the system. If the value is far less than a SQ, diversion is not considered. However, this could lead to problems over a term longer than that for which the RBI method accounts. This then leads to
the use of NRTA paired with Adjusted Running Book Inventory (ARBI) using direct inventories of material in the system. The use of NRTA and ARBI on a frequent basis leads to a reduced uncertainty, allowing for the quicker detection of a diversion. However, to set up the NRTA system appropriately, it needs to be calibrated using long term real data that has not been affected by a diversion. Additionally, the NRTA system faces detection threshold limitations that are in excess of a SQ. In other words, a sudden diversion of a SQ may not be detected by NRTA (U.S. Congress, Office of Technology Assesment, 1995, pp. 117-120).
3.4 Conclusion
Although the use of safeguards helps reduce the risk of diversion, resource and technological limitations inhibit the existence of fully diversion-proof large reprocessing facilities. Nevertheless, safeguards do complicate any possible diversion of material.
4 Obtaining WUM within the Facility
One may wonder how sufficient material can be collected illicitly given safeguards, detection systems, and other preventive obstacles. This chapter analyzes methods for collecting WUM within the facility.
4.1 Diversion Methods
Data were obtained from a reprocessing facility performance simulation by examining the elemental concentrations that would be present in flow streams of material reprocessed at a typical aqueous reprocessing facility(Argonne National Laboratory, 2008). These data included a nominal scenario with the normally expected concentrations in addition to three facility misuse scenarios (see Appendix A - Sample Diversion Scenario Data). These simulated data consisted of the different materials present at the end of the reprocessing streams and their concentration without disclosure of how the facility's processes were altered. The study of these three diversion scenarios describes the results that might be potentially achieved given conceivable methods to divert WUM from a reprocessing facility.
Specific information such as the type of process used and the volumetric flow rates of the streams were not given. Thus, several assumptions were made in this respect. The product and raffinate stream concentrations indicate that a UREX process was used. In order to determine the total mass processed for the various materials, the ratios of the flow rates for the different streams were assumed to be those described by Thompson et al. (2002, p. 18) as shown in
The mass rate outputs were found for the nominal case using the concentrations, flow rate ratios, and the molar masses. The feed and the scrub flow rates together account for the material in the raffinate stream. The solvent flow rate determines the spent solvent stream mass rate,
while the strip flow rate correlates to the product stream mass rate. Table 5 in Appendix A
-Sample Diversion Scenario Data provides the results from these calculations.
Table 1.
Volumetric Flow Rates of Streams in Nominal Scenario Stream Flow Rate [IJmin]
Solvent 0.0171 Scrub 0.00315 Feed 0.00459 Strip 0.00859
Note. Values describe flow rates through the various streams in the nominal scenario. Obtained from Thompson et al. (2002, p. 18)
In order to calculate the mass output for the diversion cases, mass conservation equations relating the fission products were used. Because the diversion scenarios are each unique, they were independently analyzed in order to determine what adjustments had been made.
For the first diversion scenario, mass balance was achieved by comparing the UO2 and the Pu4 mass rates. These were chosen because the total mass rate should be conserved if neither UO2 nor Pu4 is being accumulated elsewhere. Only the raffinate and product stream concentrations were considered because the spent solvent stream concentrations were over twenty orders of magnitude smaller and thus not useful in solving a system of equations for three unknowns. Thus, the spent solvent flow rate was considered to remain the same as in the nominal case. In order to determine the new flow rates, the product and raffinate streams were balanced independently using UO2 and Pu4 respectively because they have negligible impact on
each other. Table 2 shows the flow rate results from this calculation.
Use of these flow rates to determine the fission product mass rates indicated that they were being conserved. Nonetheless, this scenario showed that there was more complexing agent being added. It was also noted that the amount of Pu4 in the product and spent solvent are marginally increased. It is important to recognize that an increase this small may be difficult to
detect. Table 6 in Appendix A - Sample Diversion Scenario Data provides the results from these calculations.
Table 2.
Volumetric Flow Rates of Streams in the First Diversion Scenario
Stream Flow Rate [ILmin]
Solvent 0.0171
Feed and Scrub 0.00837
Strip 1 0.0107
Note. Values describe flow rates through the various streams in the first diversion scenario. Values were calculated using mass balance.
For the second diversion scenario, the same combination of U02 and Pu4 could not be used for the mass balance because the Pu4 appeared to be removed from the streams. After attempting to balance the Pu4 to determine the flow rates, the resulting mass rate outputs of the other fission products were very different from the nominal case. Thus, Ba and UO2 were chosen to be independently balanced because they were mainly concentrated in different streams. Again, the spent solvent flow rate was considered to remain the same as in the nominal case because of the negligible concentrations present. Table 3 shows the flow rate results from this
calculation.
Table 3.
Volumetric Flow Rates of Streams in the Second Diversion Scenario
Stream Flow Rate [L/min]
Solvent 0.0171
Feed and Scrub 0.00774
Strip 0.00859
Note. Values describe flow rates through the various streams in the second diversion scenario. Values were calculated using mass balance.
The flow rates determined from this calculation showed that most fission products did indeed balance. However, the major change is that most of the Pu4 is removed from the raffinate stream, and there is a noticeable increase of Pu4 in the product stream together with the U02.
This appears to be the result of greatly reducing the amount of the complexing agent. Neither the Pu4 nor the other fission products balanced. It is possible that in this scenario, Pu4 is being accumulated in the system itself waiting for the proliferator to collect it during the next maintenance shutdown. Table 7 in Appendix A - Sample Diversion Scenario Data provides the results from these calculations.
For the third scenario, the solvent concentrations are large enough to be incorporated in the mass balance, and thus U0 2, Pu4, and TcO4 concentrations are used to determine the flow rates. The U0 2 and Pu4, concentrations were chosen for the same reasons as the mass balance in the first diversion scenario, and the TcO4 concentration was chosen because it was largely present in spent solvent stream. The raffinate flow rate was determined by independently balancing the Pu4 against the nominal case. As for the product and spent solvent streams, there is sufficient U0 2 and TcO4 in both that a system of equations for two unknown needed to be solved to determine their respective flow rates. Table 4 shows the flow rate results from this calculation.
Table 4.
Volumetric Flow Rates of Streams in the Third Diversion Scenario
Stream Flow Rate [L/min]
Solvent 0.00266
Feed and Scrub 0.00774
Strip 0.00216
Note. Values describe flow rates through the various streams in the third diversion scenario. Values were calculated using mass balance.
In this scenario, part of the U02 is being removed in the spent solvent stream and less is going into the product stream. There is also a significant TcO4 and Pu4 increase in the spent solvent. Perhaps the plot here is to remove the Pu4 in trace quantities from the spent solvent
stream during the solvent cleaning step. Table 8 in Appendix A - Sample Diversion Scenario Data provides the results from these calculations.
4.2 Conclusion
The diversion methods described above are the main methods in which WUM can be diverted. In the UREX process, WUM can be diverted to the product stream and taken with the product, diverted to the spent solvent stream and collected during the solvent wash, accumulated within the system until it is collected during the cleanout, or it can even be taken directly from the raffinate stream. These methods of diversion, however, only address the issue of gathering the material within the facility. Another part of the problem is to determine how to retrieve and remove it from the facility successfully.
5
Diversion Scenario Success Tree Analysis
In order for a reprocessing facility to divert WUM while evading IAEA inspectors, a careful plan must be devised that includes various methods that lead to success. This chapter focuses on the development of diversion strategies for a UREX reprocessing facility and organizes them into a success tree structure. The study is not intended to be an all encompassing analysis, but rather to provide strategy examples and to lay grounds for further development.
5.1 Success Tree Methodology
In order to succeed at diverting material, there are two challenges that the facility needs to overcome. The first is that material must be obtained within the facility. The second is that it must be taken out of the facility. These two events can be further analyzed by studying the various possible diversion paths. This systematic approach of studying the necessary events leads to the success tree structure shown in Figure 5-1. Within the two main required events in the success tree, the various paths available are cut off to be shown in following figures. The following sections discuss the conceivable strategies to obtain material within the facility and the various measures that need to be overcome in order to take the material out of the facility.
5.1.1 Obtaining Material within the Facility
There are three main routes for obtaining WUM within the facility: material may be obtained as a trace contaminant of a different stream, sequestered in a control volume, or taken directly from the raffinate stream.
Figure 5-1. Success tree structure shows strategies to divert WUM.
5.1.1.1 Obtaining Material as a Trace Contaminant
In order to obtain WUM as a trace contaminant as was discussed in the first and third diversion scenarios in section 4.1, material needs to be rerouted to a different stream and then collected (see Figure 5-2). The rerouting of plutonium can be achieved by varying the process chemistry. The addition of extra complexant to the scrub leads to marginal increases of Pu4 content in the spent solvent and product streams. The agent can also be substituted by one that behaves similarly to that used, except for pulling more Pu4 into the other streams. The organic can also be changed or varied to produce a similar effect. The chemical process is described in section 2.2 and by Figure 2-1.
The material then needs to be collected after being redirected to a different stream. If the material is collected from the spent solvent stream, the spent solvent can be taken directly or the Pu4can be taken during the solvent washing step. If the material is taken from the product, it can
be collected as fuel bundles at the end of the process or it can be taken from the liquid product directly.
Figure 5-2. Tree branch shows available paths to obtain WUM as a trace contaminant from either the spent
solvent or product streams by varying the chemistry in the process.
5.1.1.2 Sequestering Material within the Control Volume
In order to sequester Pu4 within the system as was described by the second diversion scenario in section 4.1, the chemistry again needs to be altered (see Figure 5-3). In this case, however, the complexant needs to reduced, withheld, or replaced by a different complexant to force the Pu4 to remain in the contactors (see chemistry flow in Figure 2-1). It is also possible to change the organic solvent to one that will not interact with Pu4 and thus leave it behind in the system.
For material collection, the diverter must ensure that maintenance cleanouts are performed before the material achieves a critical mass and collect it during the cleanouts.
Because cleanouts are normally scheduled to occur before much material would accumulate under nominal conditions, the change in chemistry must be properly done such that the material still does not accumulate at a rate faster than can be compensated for by the maintenance cleanouts. Furthermore, IIV and other inventories are typically performed on a monthly basis (see section 3.2). Methods to evade detection of these systems are discussed in future sections.
Figure 5-3. Tree branch shows available paths to obtain WUM by collecting the material within the system
by varying the chemistry in the process.
5.1.1.3 Obtaining Material Directly from the Raffinate Stream
Plutonium can be taken from the raffinate stream right after the extraction step (see Figure 5-4). Nonetheless, this strategy is difficult because of the UREX process. The UREX
fission products. Special arrangements are necessary to transport this highly radioactive material. One possible tactic is to install extra piping during the facility's construction or during maintenance. This external piping can lead to a hidden room built during construction for the storage of diverted material. Either installed illicit piping or process piping can also be used to fill drums with WUM directly. The material can also be taken from the batches as they travel from MBA-2 to MBA-3, although this requires substituting with dummy batches in order to not be discovered immediately. Any dummy batches used in this strategy must necessarily behave as
Take directly from raffinate
Take during
Use external MBA-2 to Take from piping tMBA-3 transfer processpiping
Take
from
Replace
batch with dummy transfers batch
Figure 5-4. Tree branch shows available paths to obtain WUM by taking it directly from the raffinate
stream.
5.1.2 Taking Material out of the Facility
After WUM is collected within the facility, there is still another problem to solve. Both the detector and surveillance systems need to be defeated in order to take WUM successfully out of the facility. This can be achieved by creating a distracting incident such as a fire or a