Massachusetts Institute of Technology
Engineering Systems Division
Working Paper Series
ESD-WP-2002-04
D
O
-I
T
-R
IGHT
-F
IRST
-T
IME
(DRFT)
A
PPROACH TO
DSM R
ESTRUCTURING
Ali A. Yassine & Daniel E. Whitney
Massachusetts Institute of Technology
Center for Technology, Policy, and Industrial Development
Jerry Lavine & Tony Zambito
Ford Motor Company
Dearborn, MI 48126
Proceedings of DETC ’00: ASME 2000 International Design Engineering Technical Conferences September 10-13, 2000, Baltimore, Maryland
DETC2000/DTM-14547
DO-IT-RIGHT-FIRST-TIME (DRFT) APPROACH TO DSM
RESTRUCTURING
Ali A. Yassine* & Daniel E. Whitney Jerry Lavine & Tony Zambito
Massachusetts Institute of Technology Center for Technology, Policy and Industrial
Development Cambridge, MA 02139
y
a s s i n e @ M I T . E D U & dw h it n e y @ M I T . E D U
Ford Motor Company Dearborn, MI 48126
jlavine1@ford.com & Tzambito@ford.com
*
Corresponding author: MIT, CTPID, Rm. E40-252, Cambridge, MA. 02139. Tel. (617)258-7734, Fax (617)253-7140, E-mail: yassine@mit.edu
ABSTRACT
In this paper, we argue, using two real-world applications from the automotive industry, that the biggest benefit of a Design Structure Matrix (DSM) model may come not from re-sequencing and partitioning, but rather from “rewiring” the process/blocks. By “rewiring” we mean redefining relationships among elements and/or inserting new elements into the matrix. This requires intimate understanding of the process and cannot be done with application of context-free partitioning algorithms.
The Do-it-Right-First-Time (DRFT) approach to DSM restructuring is another way to look at a DSM by inspecting the sources of iteration within a block and reversing it through inserting a DRFT activity at the beginning of the block. In other words, we reverse the traditional Design-Build-Test “Cycle” into a DRFT-Design-Build “Sequence”. That is, the "wiring diagram" of a process or system overpowers the behavior of the individual nodes, so changing the system requires changing the wiring.
(Keywords: Design Structure Matrix, Product development, Process Re-engineering.)
INTRODUCTION
The ability of firms to quickly respond to fast changing customer needs and requirements is essential for their survival. Firms that do not have a structured product development process will have difficulty responding to their customers. A structured process can be developed through a clear understanding of the process and how the different parts (of the
development process) interact and influence each other. The Design Structure Matrix (DSM) provides a promising approach that facilitates this understanding by mapping the information flows and interdependencies among constituent development activities (Steward, 1982).
The (DSM) applications in the literature (Eppinger et al. 1994) have emphasized the importance of reordering the elements within the matrix to establish an improved process flow. That is, re-sequencing and partitioning were the focal point in any DSM analysis.
In this paper, we argue that the biggest benefit of a DSM model may come not from re-sequencing and partitioning, but rather from “rewiring” the process/blocks. By “rewiring” we mean redefining relationships among elements and/or inserting new elements into the matrix. This requires intimate understanding of the process and cannot be done with application of context-free partitioning algorithms.
The Do-it-Right-First-Time (DRFT) approach to DSM restructuring is another way to look at a DSM by inspecting the sources of iteration within a block and reversing it through inserting a DRFT activity at the beginning of the block. In other words, we reverse the traditional Design-Build-Test “Cycle” into a DRFT-Design-Build “Sequence”. That is, the "wiring diagram" of a process or system overpowers the behavior of the individual nodes, so changing the system requires changing the wiring.
In one of the applications described in this paper, iteration in the as-is process was caused by several parallel processes using inconsistent data. DRFT was achieved by setting up an electronic catalog of validated starting points and ensuring that
all parallel activities used the same starting point. In the other application, a long series of steps in the as-is process iterated around a finite element evaluation. An expert system was introduced to create an approximate model quickly for use by the FEM. Each iteration was greatly shortened, and detailed design was done once knowing that it would pass FEM. The rest of the paper proceeds as follows. In the next Section we briefly review the traditional DSM analysis techniques. In Section 3, we present the DRFT approach to DSM analysis. Two automotive applications are reported in Section 4 to demonstrate the proposed approach. Finally, we summarize the major points of the paper and present our concluding remarks in Section 5.
2. A REVIEW OF THE DSM METHODOLOGY
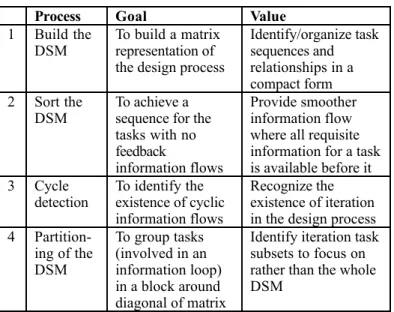
The DSM is a compact representation of the information structure of a design process. It is a design plan showing the order in which the design tasks are performed, where assumptions should be made, and what tasks need to be verified. Sequencing and partitioning algorithms allow for the reorganization of elements in the matrix to provide an improved sequence. This new sequence increases the efficiency of the design process and reduces the product development time. A summary of the traditional DSM approach is provided in Table 1.
Process Goal Value
1 Build the
DSM
To build a matrix representation of the design process
Identify/organize task sequences and relationships in a compact form 2 Sort the DSM To achieve a sequence for the tasks with no feedback
information flows
Provide smoother information flow where all requisite information for a task is available before it 3 Cycle detection To identify the existence of cyclic information flows Recognize the existence of iteration in the design process
4 Partition-ing of the DSM To group tasks (involved in an information loop) in a block around diagonal of matrix
Identify iteration task subsets to focus on rather than the whole DSM
Table 1: Traditional analysis of the design structure matrix
Even without any analysis, the DSM can provide a powerful visual model of the development process by merely inspecting the flow of information in the modeled process several important characteristics about the process, product, or organization can be learned. Several types of DSM models can be built to capture different views of the product development process: process view, product view and an organizational view. 1. Process: information dependencies and requirements, cross-functional interactions, sources of iteration (Yassine et al., 1999).
2. Product view: decomposition and integration (Pimmler and Eppinger, 1994).
3. Organization view: product development teams formation (McCord and Eppinger, 1993) and knowledge capture (Whitney et al., 1999).
More recently DSM models have been used as knowledge capture method (Whitney et al., 1999). In this approach the DSM is used as a roadmap of knowledge needed to populate an expert system as well as to link that system to other sources of knowledge outside its knowledge base.
It has been observed in several DSM applications that sequencing and partitioning did not help in improving the process (i.e. the new DSM sequence did not change much from the old sequence) due to the iterative nature of the blocks. That is, For these applications, altering the order of events did not create opportunities for improvement due to the interdependent relationships of the tasks. To improve the process a different look at the DSM and a different approach is needed. The process DSM can identify clusters of information or ways to rearrange a product development organization so that people with relevant information are linked to each other.
3. THE DRFT APPROACH
The goal of the DRFT approach is to break iterative loops by identifying their cause and eliminating it. Iteration often happens because the as-is process has the structure of "generate and test." The idea is to create a process that starts out with enough accurate information that the chance of rework is reduced or eliminated, or the time consumed by rework is reduced. To implement this approach, an expert (or a team of experts) is required to study each iterative block separately and identify reasons for iteration. This is an important intermediate step requiring domain expertise and intimate understanding of the process; unlike partitioning algorithms that provide context-free analysis of the DSM.
The DRFT approach to DSM restructuring starts with a partitioned base matrix. The base matrix represents the “as-is” process. Improvement to the as-is process is first attempted by means of step 4 of the traditional process. This step is important since it will provide the baseline for improvement after the process is modified.
In order to rewire the DSM and modify the tasks’ relationships, the experts might recommend a subset (or all) of the following rewiring strategies:
1. Redefining existing tasks
2. Splitting existing tasks into two or more pieces 3. Creating completely new tasks
4. Deleting old tasks
The power of rewiring comes from changing the behavior of the process. While earlier DSM-based improvement techniques concentrated on the task (i.e. speed up the execution of individual tasks to improve process) or its location relative to
other tasks (partitioning) as the main vehicle for improvement, DRFT takes a different approach: systems approach for restructuring the DSM.
The generic DRFT approach to DSM restructuring is comprises the following steps:
a. Create a base (“as-is”) DSM. This allows the determination of iteration loops and an understanding of the reasons behind their existence.
b. Partition base DSM to identify potential improvements by simply resequencing the activities of the process.
c. Inspect iteration blocks for “design-and test” cycles. d. For each “design-and test” cycle, inserting a DRFT activity
at the beginning of the block. The DRFT activity is similar to an expert system that converts the process so that it starts out with correct or near correct information. e. Build a DSM of the re-engineered process and measure
improvements compared to baseline process.
4. APPLICATION
This section will present two examples from the automotive industry demonstrating the utility of the DRFT approach in DSM restructuring. In the first application, we verified the process improvements through simulation of the before and after DSMs. In the second application, we verified process improvements by implementing the new process and comparing the before and after process characteristics.
Note that the data used in both examples are scaled to protect confidentiality, but preserve its characteristics.
4.1 Hood Development Process (Zambito, 2000)
A high-level description of the process is as follows:
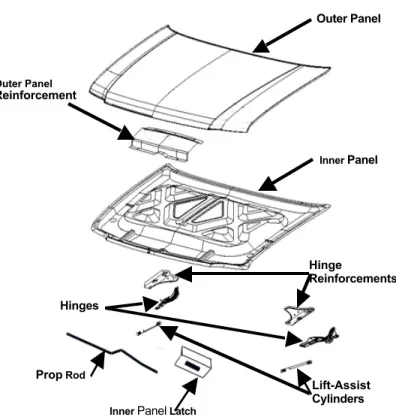
Marketing acquires and aggregates consumer needs data and supplies them to product development. Product design then generates product concepts, which are evaluated for manufacturing feasibility by manufacturing and for consumer acceptance by marketing. After iterating through this phase to gain marketing, product development, and manufacturing concurrence on a set of feasible concepts, they are developed further until concept selection is made on a single concept. The concept, manufacturing tooling, and marketing strategy evolve to completion through an iterative process between marketing, product development, and manufacturing that ensures the latest consumer needs data will be met while manufacturing feasibility is maintained. An illustration of a generic hood subsystem is provided in Figure 1.
The DSM for the original hood development process is shown in Figure 2. The figure shows the existence of five iterative loops. The first, and biggest, loop is called “The Concept Generation, Development, and Preliminary Verification Loop”. It is mainly a result of the coupling of two design activities shown in Figure 3.
Task 24 describes the activity of analyzing the hood subsystem’s structural performance. This standardized analysis involves testing torsion, cantilevered bending, dent resistance,
and a host of other similar structural attributes associated with hood performance using analytical (computer aided) methods. Inspecting the DSM in Figure 2, we see that the testing occurs well after the preliminary CAD model has been developed (task 7). The preliminary CAD model consists of early design
Figure 1: The components of a generic hood subsystem
Figure 2: DSM for the original hood development process
concepts for the outer panel, inner panel, attachment scheme and reinforcements. However, these tests provide the first indication of the structural performance of the hood subsystem. If the subsystem clearly passes the initial tests, it is optimized
Hinges Hinge Reinforcements Outer Panel Inner Panel Outer Panel Reinforcement Lift-Assist Cylinders Inner Panel Latch
Reinforcement Prop Rod
to reduce weight and cost (typically by decreasing material gauge, which is a direct feedback to task 2; “Select Materials for all System Components”). If the subsystem fails any of these tests, the structural components (inner panel and reinforcements) are revised in an effort to resolve these issues. This may include increasing the size or adjusting the location of the inner panel’s structural beams, increasing material gauge and/or material type of various components, or a combination of these actions. The preliminary CAD model (developed in task 7) is then reworked to reflect the changes. The finite element analysis (FEA) analyst then updates the structural model based on the revised CAD model and reruns the tests. If the subsystem fails, the entire process is reiterated until the subsystem passes the suite of tests. As illustrated in Figure 3, the analysis process is in a build, then test sequence, which allows the potential for significant rework.
24
:
Evaluate
functional
performance
(analytically)
24
:
Evaluate
functional
performance
(analytically)
7:Develop initial
design
concept (prelim CAD
model)
7:Develop initial
design
concept (prelim CAD
model)
24
:
Evaluate
functional
performance
(analytically)
24: Evaluatefunctional performance (analytically)7:Develop initial
design
concept (prelim CAD
model)
7: Develop initial design concept (prelim CAD model)
Figure 3: The build-test cycle associated with verifying hood subsystem performance
4.1.A Process Reengineering: DRFT approach
Our approach is to explore alternate ways of conducting the development activities in loop 1 using an improved process. The new process uses the minimum amount of data needed to evaluate the hood functional performance early in the process (i.e. early in loop 1). To demonstrate a realistic reengineering effort we use only known-feasible strategies and technologies to restructure this phase.
Figure 4 describes how the original tasks map to those associated with the new process. From this mapping, we see that task 7 is decomposed into two tasks. Task 9 is conducted by using the hood generator (an expert system that can quickly create an approximate geometric model suitable for FEM). Task 8 is the activity of developing the design intent CAD model (it is no longer the preliminary CAD model because it is requirements driven). Task 24 is redefined to include two additional tasks: Develop structural requirements (through topology optimization) and develop conceptual design strategy (with the output of the topology optimization. Task 24 maps almost directly to task 10. However, we have replaced the term
evaluate with verify, since this analysis is a verification rather
than an evaluation. The new tasks are inserted into loop 1 of the original development process in the sequence given by their new task numbers, and all interdependencies are verified. Figure 5 shows the new hood development process.
7: Generate structural requirements (analytically) 7: Generate structural requirements (analytically) 10: Verify functional performance (analytically) 10: Verify functional performance (analytically) 24: Evaluate functional performance (analytically) 24: Evaluate functional performance (analytically)
7: Develop initial design
concept (prelim CAD model) 7: Develop initial design
concept (prelim CAD model)
8: Develop conceptual
design strategy 8: Develop conceptual
design strategy
9: Develop structural CAD
models
9: Develop structural CAD
models
11: Develop preliminary
design intent CAD model 11: Develop preliminary
design intent CAD model
Figure 4: The mapping of tasks from the baseline process to the new process.
Figure 5: DSM for re-engineered hood process 4.1.B Results
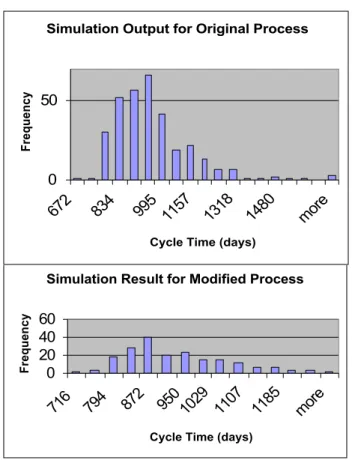
Both the original and the reengineered DSMs were simulated using the Monte Carlo simulation technique described in Browning and Eppinger (1998). While the initial duration (first time through) of 53 days is similar for both processes, the significant difference between them is the reduction in rework duration. The new process can be iterated in only 8 days, whereas the baseline process requires 27.5 days. Because the variability1 of tasks 10 and 11 in the new process are lower than their predecessors’ in the baseline process (tasks 24 and 7, respectively), these tasks are less likely to incur rework.
A
summary of the simulation results comparing both processes is shown in Figure 6.
1
Within the context of our model, the variability of a task is defined as the likelihood that its output information, utilized by other tasks, would change after being intially released.
4.2 Seat Belt Development Process (Lavine, 2000)
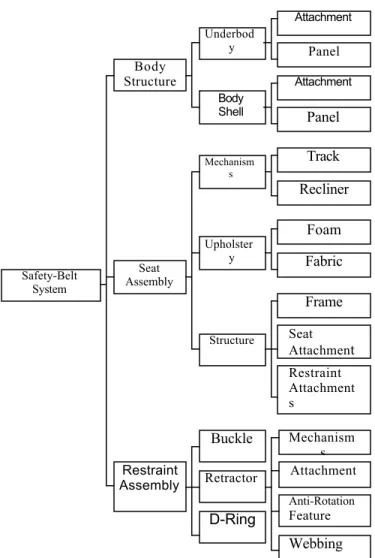
Safety belt sub-system design and development combine available components from full service restraint suppliers who provide sub-systems to multiple manufacturers in the auto industry. Vehicle specific components (e.g. mounting brackets and webbing length) are unique to the end item provided for that vehicle and are dependent on both individual program metrics and interfacing sub-systems. The metrics used to evaluate a safety belt sub-system are: performance, quality, comfort, cost and complexity. Figure 7 shows the physical decomposition of the safety belt system. Note that although the figure shows the break down of the safety belt system into three different sub-systems, it does not show the information interdependencies between these subsystems, which will be evident in the DSM model later in the paper.
The as-is development process required interactions between multiple sub-systems, with the goal of optimizing the system based on the above system metrics. Design activities must satisfy their unique requirements based on the evaluation criteria presented in Table 2.
Figure 6: Simulation results comparing the before and after DSMs. Before mean = 929 days, σ = 143. After mean = 772,
σ = 43.
As a part of this process, a dedicated team integrated product information from the responsible full service suppliers, in-house design activities and regulatory requirements to create and archive drawings demonstrating compliance to the applicable requirements.
Study of the as-is process revealed that this group did not create any part geometry and its primary responsibilities involved
coordination and monitoring to insure that affected
organizations had the required information to complete their designs and communicated with each other. The team also facilitated the interpretation of the regulations between engineering and the safety office to verify that requirements were accurately defined and adhered to. The team required the
information presented in Table 3 to complete its
responsibilities.
Sub-System
Requirements Evaluation Criteria
Sheet Metal 1. Packaging
2. Attachment points 1. Manufacturing feasibility 2. Structural performance Safety 1. Performanc e 1. System level performance Seating 1. Packaging 2. Attachment point 1. Comfort 2. Structural performance Interior Trim 1. Clearance 1. Appearance
Table 2 - Sub-System interactions
Simulation Result for Modified Process
0 20 40 60
716 794 872 950 1029 1107 1185 more
Cycle Time (days)
Frequency
Simulation Output for Original Process
0 50
672 834 995 1157 1318 1480 more
Cycle Time (days)
Organization Information Provided
Seat supplier Seat surface
Safety belt attachments, if applicable Restraints
supplier
Safety belt retractors and buckles in vehicle Position
Child seat anchors in vehicle position Attachment types
Sheet metal design
Attachment points and type Vehicle
package
Seat package information
Safety office Applicable regulations
Regulatory interpretations
Engineering Product market offerings
Compliance concurrence
Table 3: Information requirements CAD compliance activity
Information was shared between organizations and tasks throughout the process. The process was evaluated using a DSM model that identified who creates, provides, and requires information. The DSM model (Figure 8) shows that the as-is process was highly iterative and culminated in a two-dimensional drawing that showed the necessary components and regulations so that compliance could be verified visually. Information was exchanged on an “as requested” basis through an informal communication network. Iteration occurred partially because groups worked with outdated information. When the information was coordinated and updated, many systems and their mating parts had to be changed.
A B C D E F G H I J K L M N O P Q
Define Seating Hardpoints A X
Determine Seat Travel B X
Safety Belt Product Assumptions C X X X X X X X X X X
Specify Market Availability for Program D X X
Determine Applicable Belt Regulations E X X X X X
Interpret Regulations F X X X X
Style and Develop Exterior of Seat G X X X X X
Determine Anchorage Points H X X X X X X X X X X X X X
Package Safety Belt Sub-System I X X X X X X
Comfort Considerations/Evaluations J X X X X X X X
Determine Assembly Process K X X X X
CAE Performance Evaluations L X X X X X X
Safety System Development M X X X X X X
Prototype Build Evaluations N X X X X X X X X
Verify Compliance (upper anchorages) O X X X X X X X
Verify Compliance (lower anchorages) P X X X X X X X
Verify Compliance (child seat anchorageQ X X X X X X X X
Figure 8: Original safety belt development process
Errors interpreting regulations also caused iteration. Regulatory requirements are often difficult to interpret and require extensive knowledge of and experience with the regulations, as well as seat and restraint systems. With the original process, a designer could be dedicated to a program for up to a year. If that program did not contain a certain market, the designer’s knowledge of the market’s requirements was typically lost; either because the regulation has changed or it has been forgotten. Also, no formal means existed for training the design staff in this process .
4.2.A Process Reengineering: DRFT Approach
The re-engineered process is documented in a DSM model (Figure 10) that does not require all of the tasks of original process, but does contain a task unique to the new process. Since re-sequencing the tasks did not reduce the potential iterations for this application, strategic actions were initiated to address the tasks with the greatest iterative impact and resource requirements.
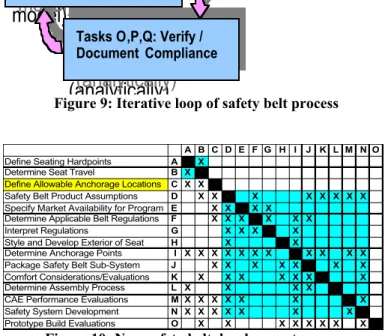
Inspection of the original process revealed that there are nine instances of interaction between the full service suppliers and design activities that can create iterations. This major iterative loop is represented in Figure 9. The verification and documentation tasks (rows O, P and Q in Figure 8) can also be seen to have high information requirements because they require information from eight preceding tasks as well as being coupled with three tasks. These tasks also require significant interaction between all of the organizations, as represented in the DSM. For these reasons, the process re-engineering focused primarily
Seat Assembly Track Recliner Foam Fabric Body Structure Body Shell Underbod y Panel Attachment Panel Attachment Frame Seat Attachment Restraint Attachment s Upholster y Mechanism s Structure Safety-Belt System
Figure 7 – Physical system decomposition Restraint Assembly Buckle D-Ring Retractor Mechanism s Attachment Anti-Rotation Feature Webbing
on these tasks. In addition the tasks of determining the applicable regulations and interpreting the regulations (rows E and F in Figure 8) were found to cause potentially significant re-work because they are coupled with nine tasks. Figure 10 is the new re-engineered process DSM.
24
:
Evaluate
functional
performance
(analytically)
24
:
Evaluate
functional
performance
(analytically)
7:Develop initial
design
concept (prelim CAD
model)
7:Develop initial
design
concept (prelim CAD
model)
24
:
Evaluate
functional
performance
(analytically)
Tasks O,P,Q: Verify / Document Compliance
7:Develop initial
design
concept (prelim CAD
model)
Task C: Safety Belt Product Assumptions
Figure 9: Iterative loop of safety belt process
A B C D E F G H I J K L M N O
Define Seating Hardpoints A X
Determine Seat Travel B X
Define Allowable Anchorage Locations C X X
Safety Belt Product Assumptions D X X X X X X X X
Specify Market Availability for Program E X X X X
Determine Applicable Belt Regulations F X X X X X X
Interpret Regulations G X X X X
Style and Develop Exterior of Seat H X X
Determine Anchorage Points I X X X X X X X X X X X
Package Safety Belt Sub-System J X X X X X X X
Comfort Considerations/Evaluations K X X X X X X X
Determine Assembly Process L X X X X
CAE Performance Evaluations M X X X X X X X
Safety System Development N X X X X X X X
Prototype Build Evaluations O X X X X X X X X
Figure 10: New safety belt development process
The DRFT for the safety belt application was realized by modeling sub-system requirements at the beginning of the process, instead of testing the design at the end of the process. This was accomplished by setting up an electronic catalog that contains parametric requirements so that all the organizations and suppliers can start out with the same correct information,
eliminating both outdated information and incorrect
interpretation of regulations.
4.2.B Results
This new process contains 28% fewer instances of potential iteration (21 task interactions above the diagonal for the re-engineered process versus 29 for the original process) based on the specification of the compliance zones early in the process. Implementation of the new development process has reduced the staffing requirements by 90% for the CAD restraints organization without creating additional work for another activity. The original process required dedicated support for the life of the program due to the frequent interaction and iteration. The new process only requires support at the beginning of the program to define the allowable anchorage locations, and at the end, if needed, to satisfy documentation requirements (see Figure 11).
5. SUMMARY AND CONCLUSION
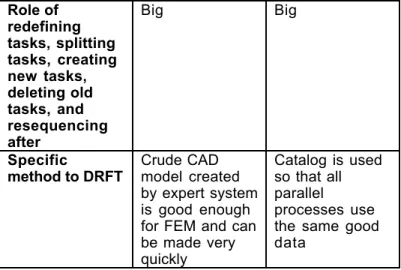
Dramatic improvement of product development processes often requires more than formal rearrangement of the tasks. Gross redefinition is also needed. This requires people who are intimately familiar with the process. In the cases presented in this paper, the same general cause of iteration was found: a process style called "generate and test." The cure was also the same: convert the process so that it starts out with correct or near-correct information or so that any unavoidable iterative loops are as short as possible. Table 4 compares the cases and identifies the small role played by traditional DSM techniques and the large role played by gross process redefinition and the DRFT strategy.
These cases indicate that a more nuance approach to the DSM is useful and may lead to greater process improvements than traditional DSM methods. Traditional methods attack the process by addressing individual tasks more or less as-is. The approach demonstrated here is more of a system-level approach.
Hood Seat-Belt
Goal Generate and
test - DRFT Generate and test - DRFT Process Knowledge Needed
Very much Very much
Cause of iteration in as-is process
Long serial process with FEM test at the end Several parallel processes with error-prone starting point Role of faster individual tasks in speeding up the process Small Small Role of sequencing original tasks Small Small Resource s Requirements Original Process Staffing
Role of redefining tasks, splitting tasks, creating new tasks, deleting old tasks, and resequencing after Big Big Specific method to DRFT Crude CAD model created by expert system is good enough for FEM and can be made very quickly Catalog is used so that all parallel processes use the same good data
Table 4: Comparing the two case studies
(The shaded area represents traditional DSM analysis techniques)
ACKNOWLEDGEMENT
This research has been supported by Ford Motor Company.
REFERENCES
Browning, Tyson R. and Eppinger, Steven D., "A Model for Development Project Cost and Schedule Planning," M.I.T. Sloan School of Management, Cambridge, MA, Working Paper no. 4050, November 1998.
Eppinger, Steven D., Whitney, Daniel E., Smith, Robert and Gebala, David, "A Model-based Method for Organizing Tasks in Product Development," Research in Engineering Design, Vol. 6, No. 1, pp. 1-13, 1994.
Lavine, Jerry, “Parametric Design Constraints Management Using the Design Structure Matrix: Creation of an Elctronic Catalog for Safety Belt System,” MIT SDM Masters Thesis, January 2000.
McCord, Kent R. and Eppinger, Steven D., "Managing the Integration Problem in Concurrent Engineering", M.I.T. Sloan School of Management, Cambridge, MA, Working Paper no.3594,, 1993.
Pimmler, Thomas U. and Eppinger, Steven D.,
"Integration Analysis of Product Decompositions", Proceedings of the ASME Sixth International Conference on Design Theory and Methodology, Minneapolis, MN, Sept., 1994. Also, M.I.T. Sloan School of Management, Cambridge, MA, Working Paper no. 3690-94-MS, May 1994.
Steward, Donald V., "The Design Structure System: A Method for Managing the Design of Complex Systems" IEEE Transactions on Engineering Management, vol. 28, pp. 71-74, 1981.
Whitney, Daniel E., Dong, Qi, Judson, Jared, and Mascoli, Gregory, "Introducing Knowledge-Based Engineering Into an Interconnected Product Development Process", M.I.T. Center for Innovation in Product Development, Cambridge, MA, White Paper Jan. 27, 1999.
Yassine, Ali A., Falkenburg, Donald R. and Chelst, Ken, Engineering Design Management: An Information Structure Approach. International Journal of Production Research, vol. 37, no. 13, 1999. pp. 2957-2975.
Zambito, Tony, “Using the Design Structure Matrix to Structure Automotive Hood System Development,” MIT SDM Masters Thesis, January 2000.