1
Did "Pookie" Get a Green-Collar Job?
A Critical Case Study on the East Bay Green Corridor's Employment Goals, Activities, and Impacts
By
Matthew J. Miller
BA in Urban Studies with Honors Stanford University
Stanford, California (2012)
Submitted to the Department of Urban Studies and Planning In partial fulfillment of the requirements for the degree of
Master in City Planning at the
MASSACHUSETTS INSTITUTE OF TECHNOLOGY
MASSACHUSE TTS INSTITUTE CF TECHNOLOGy
JUN 19 2014
L BRA R S 1
June 2014© 2014 Matthew J. Miller. All Rights Reserved.
The author hereby grants to MIT the permission to reproduce and to distribute publicly paper and electronic copies of the thesis document
in whole or in any medium now known or hereafter created.
Signature redacted
Certified
by
Signature redactE
Department of Urban Studies and Planning (May 21, 2014) Professor Amy K. Glasmeier Department of Urban Studies and Planning
r,% - 4 + Thesis Supervisor
Ij latu 3 IC I
Ca
CUAccepted by
ofessor P. Christopher Zegras Department of Urban Studies and Planning Chair, MCP Committee Author
Did "Pookie" Get a Green-Collar Job?
A Critical Case Study on the East Bay Green Corridor's Employment Goals, Activities, and Impacts
By
Matthew J. Miller
BA in Urban Studies with Honors Stanford University
Stanford, California (2012)
Submitted to the Department of Urban Studies and Planning In partial fulfillment of the requirements for the degree of
Master in City Planning at the
MASSACHUSETTS INSTITUTE OF TECHNOLOGY ABSTRACT
This thesis describes the formation of the East Bay Green Corridor (EBGC), a multi-city partnership for green investment in California, and how it failed to create stable, living wage economic opportunities for those with high employment barriers between 2007 and 2012. By analyzing semi-structured interviews with key informants and green economic development data at regional and urban levels, it provides insight on how EBGC cities tried to influence the distribution of "green-collar" jobs and businesses through various policy experiments.
This study largely attributes the conclusion to the fact that EBGC did not have the capacity to be effective as an organization, which ultimately led to its dissolution in 2013 into an unfunded volunteer project. Using regional analysis, it also finds that the highest years of green employment growth (2007-08) in the California East Bay preceded the existence of EBGC activities. Furthermore, it calls into question the long-tenn economic impacts of EBGC activities by showing that the Great Recession slowed employment growth rates in green sectors more than it did the employment growth rates in non-green sectors.
While this thesis does not critique the concept or possibility of a green-collar economy as other reports have, it suggests a few ways that policymakers interested in green-collar economic development can be grounded and strategic about their approaches to regional partnership and poverty alleviation to realize the desired returns on this type of economic development investment.
Supervisor: Amy Glasmeier
Title: Professor of Economic Geography and Regional Planning Reader: Judith Layzer
Acknowledgements
This thesis is a labor of love that deserves many more acknowledgements than can fit within this page. First, I would like to thank my advisor Amy Glasmeier for taking the time to challenge and understand my vision for this paper. You provided a discipline I seek to emulate in my professional career. I would like to thank Judy Layzer for agreeing to be a reader, providing a sharp eye for clarity, and prodding me to "rise to the challenge" of pulling this paper off. I would also like to thank the MIT Writing and Communication Center for providing feedback on key portions of this thesis (i.e. introduction and abstract), especially Betsy.
Personally, I would also like to thank my parents for encouraging me to keep following the topics that can engage a broad audience. I definitely kept my mother's voice in mind: "make sure it's something you can share with folks who aren't at MIT!" To my friends and housemates Dara Yaskil, Jennifer Ly, Sofia Campos, Nene Igietseme: thank you for keeping my spirits up and my motivation high to keep pushing the status quo. I hope I retained most of that desire to challenge economic development to work in the interests of the economically and socially disenfranchised.
I would also like to thank all of the research participants listed in Appendix A, especially those in Oakland and the East Bay Economic Development Alliance. You all offered lively interpretations of what really happened and what it means for future practice. Also, thank you to Renae Steichen of Collaborative Economics and NextlO for allowing me to use the unique green economic data in this report. I hope my limited interpretations of the data offer meaningful insight and are worth the many e-mails and calls needed to secure it for this study.
TABLE OF CONTENTS
ACKNOWLEDGEMENTS --- 3
PREFACE --- 8
INTRODUCTION--- 9
SECTION 1: OVERVIEW --- 9
SECTION 2: RESEARCH ARGUMENT AND QUESTIONS--- 10
SECTION 3: A ROAD MAP TO THIS THESIS--- 10
SECTION 4: RESEARCH METHODOLOGY --- 11
CHAPTER 1: LITERATURE ON GREEN ECONOMIC DEVELOPMENT AND REGIONAL INNOVATION--- 15
REGIONAL INNOVATION SYSTEMS AND GOVERNANCE --- 15
GREEN REGIONAL INNOVATION AND JOB GROWTH --- 16
THE "GREEN-COLLAR" FRAME, POVERTY, AND HIGH-TECHNOLOGY CLUSTERS --- 18
POLITICAL FRAMING AND SUSTAINABLE DEVELOPMENT--- 20
CHAPTER 2: THE ORIGINS OF THE EAST BAY AS A GREEN TECHNOLOGY REGION-- 21
ECONOMIC RECESSION AS A POLICY BACKDROP--- 21
GREEN TECHNOLOGY AS ECONOMIC DEVELOPMENT IN CALIFORNIA --- 22
THE EAST BAY GREEN TECH CLUSTER: A RESPONSE TO HISTORIC DEVELOPMENT CHALLENGES --- 23
CHAPTER 3: THE EAST BAY GREEN CORRIDOR'S GOALS --- 26
SECTION 1: FORMATION OF THE TEAM--- 26
Toward Goals and Shared Vision --- 27
SECTION 2: THE FOUNDING PARTNERS --- 28
Berkeley --- 28
Oakland --- 29
Emeryville --- --- 29
Richmond --- 29
University Actors: UCB and LBNL --- 30
East Bay EDA --- 31
SECTION 3: EXPANSION OF THE MEMBER CITIES AND PARTNERS --- 32
CHAPTER 4: THE GREEN-COLLAR ACTIVITIES OF EBGC --- 33
SECTION 1: GREEN-COLLAR ACTIVITIES INITIATED BY EBGC ORGANIZATION --- 33
Business Development Activities --- 34
Workforce Development and Education Activities--- 35
"Innovative" Policy Committee --- 36
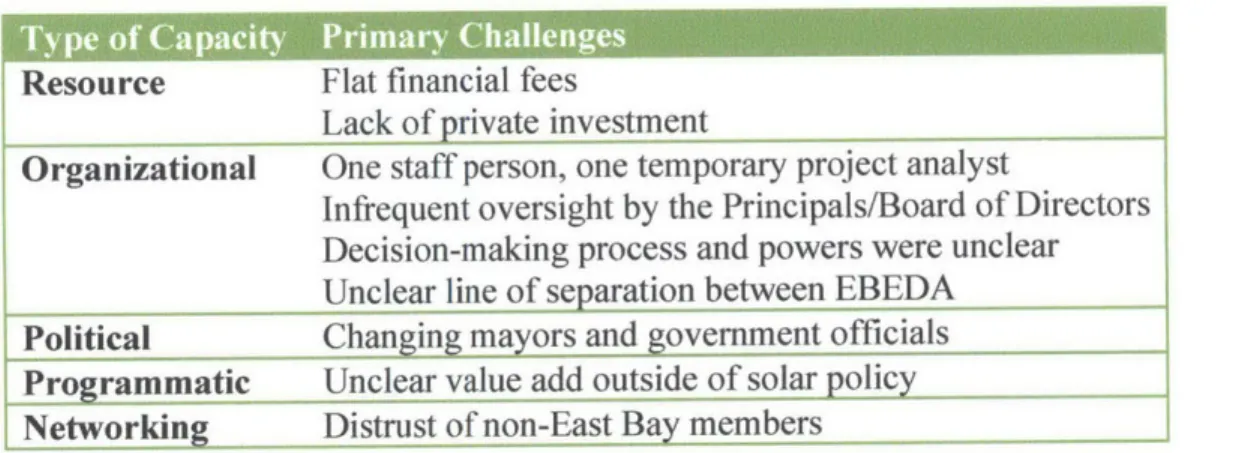
CAPACITY CHALLENGES --- 37 Resource Capacity --- 38 Programmatic Capacity --- 39 Organizational Capacity --- 39 Political Capacity --- 40 Networking Capacity --- 40
Consequences of Lacking Capacity: Dormant Status of EBGC --- 41
SECTION 2: GREEN-COLLAR ACTIVITIES INITIATED BY CITIES--- 41
Section 2.1: Urban Environmental Planning: Spurring Green Economic Demand?--- 41
Climate Action Planning as a Scaffold --- 43
Four Types of CAP-Supported Programs and Policies--- 47
Conclusions --- 47
SECTION 2.2: LABOR POLICIES AND PROGRAMS --- 48
Federal Support for Green Workforce Development--- 48
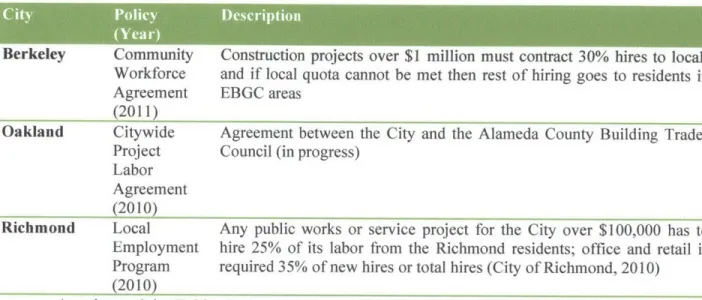
Policy: Project Labor Agreements --- 50
Programs: Green Job Training --- 51
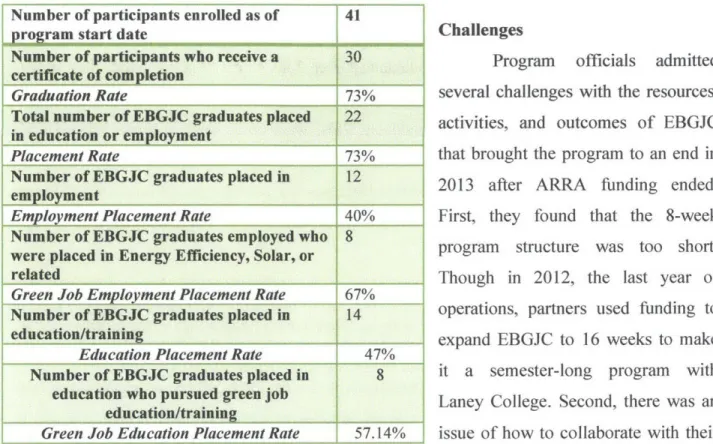
East Bay Green Jobs Corps: Youth Training--- 52
Challenges --- 53
GETS Program: Adult Training--- 55
Lessons Learned --- 56
CONCLUSIONS --- 57
CHAPTER 5: ANALYSIS OF REGIONAL GREEN EMPLOYMENT OUTCOMES --- 58
ANALYTICAL METHOD: COMPARATIVE GROWTH RATE ANALYSIS --- 58
RESULTS --- 59
1. Green Sectors Outperformed Non-Green Sectors in the Decade--- 59
2. Green Employment Grew Slower Within Recessionary Period Than General Economy --- 62
3. Employment Growth is Likely within the Energy Infrastructure Establishments--- 65
CONCLUSIONS --- 65
CHAPTER 6: SUMMARY AND CONCLUSIONS --- 67
SECTION 1: SUMMARY OF FINDINGS --- 67
SECTION 2: CONCLUDING QUESTIONS FOR FUTURE RESEARCH --- 68
What could successful regional governance look like?--- 68
(How) should cities promote green-collarjobs as structural poverty solution?--- 69
APPENDICES --- 76
APPENDIX A: RESEARCH TIMELINE --- 76
LIST OF TABLES
TABLE 1: FIFTEEN SEGMENTS OF THE CORE GREEN ECONOMY (COLLABORATIVE ECONOMICS, CLEANTECH GROUP
L L C )... 1 3
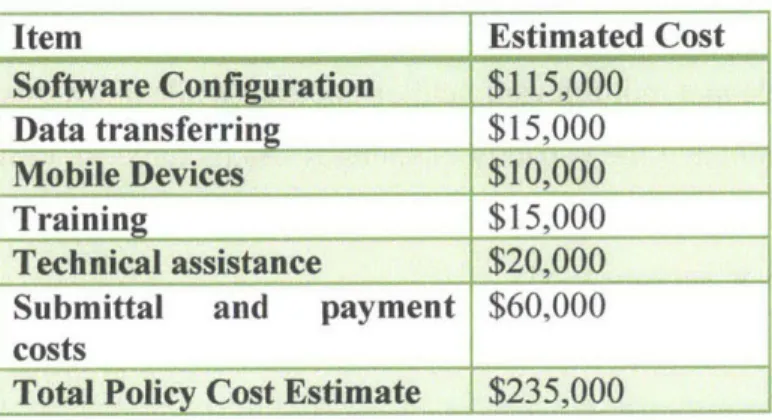
TABLE 2: ESTIMATED AVERAGE COST OF SOLAR PERMITTING REFORMS IN EAST BAY ... 37
TABLE 3: SUMMARY OF THE FIVE TYPES OF CAPACITY CHALLENGES FOR EBGC... 38
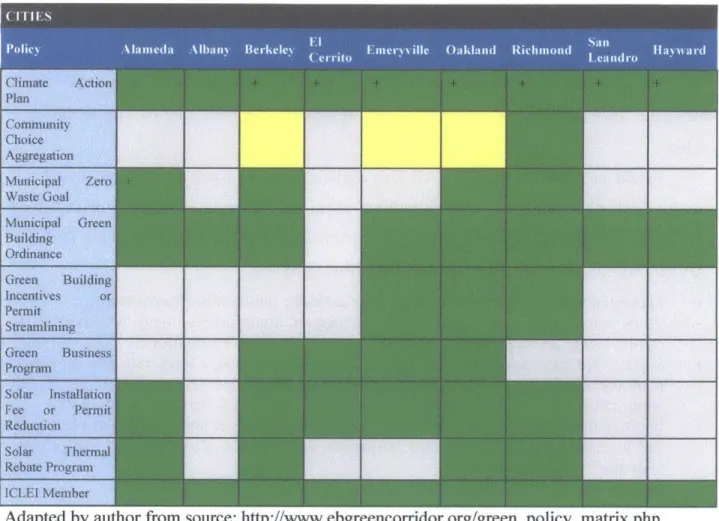
TABLE 4: GREEN POLICY MATRIX WITH INDICATORS OF PROGRESS AND ECONOMIC AIMS ... 43
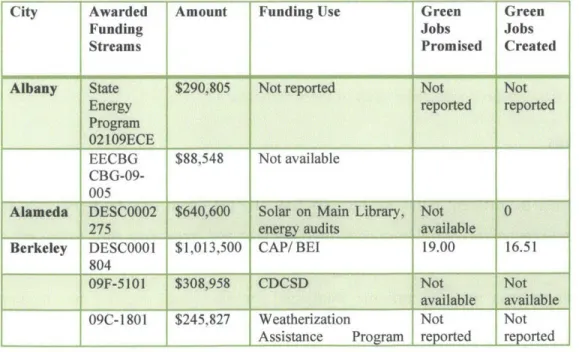
TABLE 5: ESTIMATED FEDERAL/STATE INVESTMENT IN GREEN JOBS PROGRAMS IN EAST BAY... 48
TABLE 6: PROJECT LABOR AGREEMENTS BY CITY ... 51
TABLE 7: REPORTED OUTCOMES FOR THE EBGJC 2010-11... 53
TABLE 8: EMPLOYMENT GROWTH RATES OF OAKLAND-HAYWARD-FREMONT METROPOLITAN DIVISION BY R ECE SSIO N A R Y P ER IO D S... 6 4 T A BLE 9: L IST OF STU DY PA RTICIPAN TS... 77
LIST OF FIGURES AND EQUATIONS
FIGURE 1: SIX SUB-REGIONS OF THE EAST BAY MARKET FOR EDA ... 31
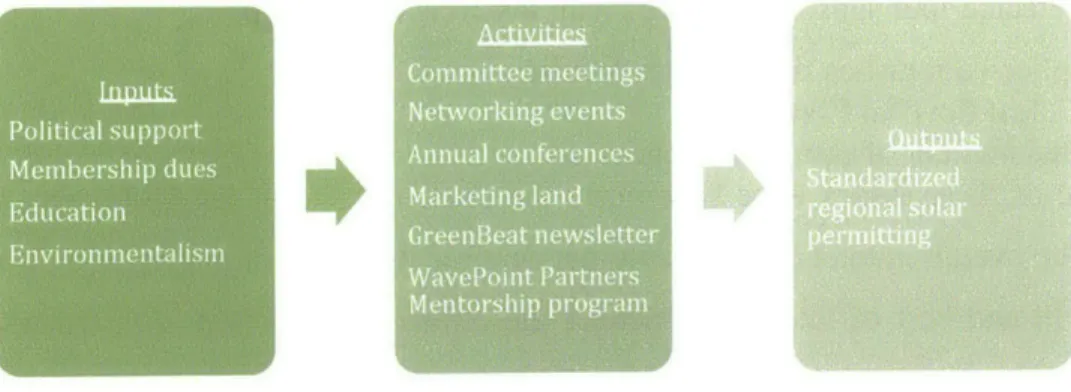
FIGURE 2: PARTIAL LOGIC M ODEL OF EBG C D ESIGN... 33
FIGURE 3: REGIONAL EMPLOYMENT LEVELS IN OAKLAND-FREMONT-HAYWARD METROPOLITAN DIVISION (2002-12) ... . ... . . . ... . . . ... ... ... ... ... 6 0 FIGURE 4: ToP 5 EAST BAY CITIES FOR GREEN JOBS BY YEAR (2002-2012)... 60
FIGURE 5: QUANTITY OF GREEN EMPLOYMENT IN EBGC BY CITY AND TIME... 60
FIGURE 6: MAPS OF PRE-RECESSION AND POST-RECESSION GREEN JOBS DENSITY BY ZIP CODE IN EAST BAY ... 61
FIGURE 7: GREEN JOB GROWTH RATE PRE-EBGC POLICY AND POST-EBGC POLICY... 63
FIGURE 8: GREEN JOB GROWTH RATE IN TOP 5 EAST BAY CITIES WITHIN THE RECESSION ... 63
FIGURE 9: CORE GREEN ESTABLISHMENT COUNT IN TOP 3 EAST BAY CITIES (2012)... 65
Preface
"You cannot green the cities unless you green the ghetto, and you cannot green the ghetto in 2009 without giving Pookie ajob. So that's the new environmental movement: give Pookie ajob! Beat this recession and global warming at the same
time. Beat pollution and poverty at the same time!" -Van Jones, State of the Black Union (2009)
The title of my thesis is adapted from an important moment in Van Jones' remarks at the 2009 State of the Black Union and communicates the central idea I hope to both make explicit and challenge in this thesis: green-collar jobs as a sustainable solution to poverty. The surge of "eco-populism" around green jobs during 2007 to 2010 occurred alongside a formative period in my development as a thinker, student leader, and activist at Stanford University. Seeing the buzz come and go from the stimulus package and the subsequent vilification of this Bay Area leader rising to power and falling back off the national stage for years, gave me pause and caused many vivid debates during my undergraduate years with my peers. Hearing Jones and affiliated nonprofits leaders advocate for environmental and economic policies in the interest of a metaphorical "Cousin Pookie" was an important matter to Black America and to me.
Five years later, I am writing this paper around what really happened during the key investment years after the Recovery Act stimulus in the East Bay, close to my home in Central Valley. It is important to acknowledge that everyone involved in the partnership profiled in this thesis was working in good faith and were generous in discussing the difficulties of their work. If making cities a better place for the socioeconomically challenged - regardless of how we get there - is a rational goal for urban planning, then I hope the findings of this case study helps us acknowledge the critical difference between the plan to versus the path to a sustainable future. Beyond the hard analytical skills that are taught in planning school, making cities a better place for the disadvantaged will require us to exercise characteristics and skills such as patience, reflection, intentionality, and-most of all-love.
Introduction
Section 1: Overview
During the Great Recession between 2007 and 2011, fostering a "green economy" was one of the most promising ideas for providing economic opportunity and addressing climate change. However, it was also one of the most contested. During the 2009-2012 period in which the American Recovery and Reinvestment Act (ARRA) made $500 million available to create green jobs, auditors were critical of the pace in which state and local agencies were spending funds, thus "jeopardizing the employment goals of the green jobs program" (Department of Labor, 2011; California Bureau of State Audits, 2012). Few studies have examined how individual cities or regions handled funding given this lack of state controls.
The East Bay is home to one of the earliest examples of this regional green-collar economy movement in California, which spurred the creation of a partnership-turned-organization called the East Bay Green Corridor (EBGC) in 2007. Thesis examines how multi-city regionalization formed in the East Bay. Four cities formed a pact through EBGC and pursued acquisition of an estimated $23.8 million in federal funds for green jobs related programs, which injected resources into their local economies during the Great Recession. Intended as a support for green technology businesses, the EBGC was framed around economic and social goals, loosely following "Triple Bottom Line" sustainable business principles. Absent prior experience with cross-city cooperation, the members of EBGC also formulated a strategy to support job creation for poor and minority residents, formerly locked out of the new economy due to a lack of skills and work experience. The purpose of this thesis is to position the East Bay region as a critical case of how municipal and nonprofit organizations tried to translate their loosely defined goals of increasing the labor supply in the green economy; unfortunately they did not appear to make a significant impact during the period in which the EBGC was active. Ultimately, this cautionary tale uses the EBGC's experience to pose a set of critical questions around regional partnership and poverty alleviation that could be useful as interested U.S. cities and communities continue to nurture place-based "green-collar" and "green technology" industrial strategies.
Section 2: Research Argument and Questions
To explore this case of green economic development, the thesis asks one major question: Given the high levels of federal investment in green economic development and public speculation about the effectiveness of green-collar programs and policies, how and to what extent did East Bay cities actually use the EBGC as a vehicle to meet their stated "green-collar" goals in the time in which it was active? More specifically, I pursue three sub-questions:
1. Goals: Who and where did the EBGC target green-collar job resources?
2. Activities: How did the EBGC cities tailor programs, policies, and plans to support green-collar jobs?
3. Impacts: What impacts could these programs, policies, and plans had on the rate of green job growth compared to what could be expected in that region?
By pursuing answers to these questions, my case study provides both qualitative and quantitative evidence that these cities acted on unfounded hopes that ultimately resulted in less than expected outcomes.
Section 3: A Road Map to this Thesis
This thesis contains describes the outcomes of the EBGC's green economic development activities in relation to the following broad goals the cities set:
1. Create conditions that support new and emerging green industry
2. Strengthen existing programs promoting technology development and transfer 3. Support employment development opportunities in emerging green industries 4. Build a more cohesive regional identity in energy-related green business sectors
5. Protect our economies from climate change and energy shocks
6. Cooperate in obtaining grants and project funding for green research and entrepreneurship
7. Improve our living environment and quality of life
Overall, the thesis finds that these cities did not produce the collective outcomes they hoped for on the employment development goals. The following six chapters develop this finding.
Chapter One defines what "green technology" is and selectively reviews the literature on regional economic development and green technology industry clusters, especially strategies that purport to reduce poverty and increase green-collar employment.
Chapter Two moves past the general debates and establishes the importance of the East Bay region. The chapter begins by describing the economic conditions of during which this case took place. It also points out the precedents for green technology in state and federal policy. Next, I draw parallels between the excitement around green-collar jobs in the mid 2000s and the
period of biotechnology industry optimism of the 1980s. The chapter concludes by describing the EBGC as a target of an innovation-centric economic development state program.
Chapter Three describes the EBGC and the formation of the organizational partnership among its nine cities and four educational institutions. It briefly describes the parties and their goals based on key interviews and public media.
Chapter Four describes the activities of the EBGC organizational partnership and the capacity challenges that ultimately led the cities to defund it in 2013. Then, it zooms out from describing the activities initiated by EBGC to discussing the activities initiated by the cities prior to and outside of the EBGC. The chapter highlights the proliferation of environmental and labor policy reform. Finally, it provides insights on the labor programs enacted toward "green-collar" employment training with attention to the reported outcomes from each program.
Chapter Five uses data from the Green Economic Database to explore regional green employment trends from 2002 to 2012. The analysis compares the nine-city portion of the region to the larger East Bay Metropolitan Area. In doing this, my analysis shows that job growth preceded the application of federal funds and the creation of the partnership. During the partnership activity period, green job growth was minimal compared to the metropolitan area.
Chapter Six summarizes the findings from the previous five chapters and concludes with some future research questions and high-level recommendations that emerged from data.
Overall, this thesis suggests that a partnership designed to take advantage of a large flow of federal funds failed to utilize a program design capable of delivering on its jobs goal. This finding is the basis for the conclusion the EBGC was an experimental, ineffective vehicle for reaching the "green-collar" goals these cities initially articulated.
Section 4: Research Methodology
This research relied on a data collection process that was mostly aimed toward description and analysis with a slight emphasis on evaluation, using both qualitative and quantitative data. To meet the descriptive research objectives, I conducted semi-structured interviews and analyzed secondary information, policy reports, and newspapers to describe the political and sociological narrative of this case. The interviews requested participation from 18 key informants (i.e. government/policy officials) in all nine cities and five partner organizations about the goals, problems, solutions, and impacts of their membership in the East Bay Green Corridor. I was able to get detailed responses from officials in five of the cities and three of the
five organizations. For secondary information, I collected organizational data (i.e. finances, meeting agendas) provided anonymously and/or published online to piece together the narrative of what policymakers promised to deliver and what actually happened within/outside of the EBGC. Last, I detail how the policy reports, grant contracts, and urban planning strategies (i.e. climate action plans, general plans) of these cities included the "green collar" goals or not.
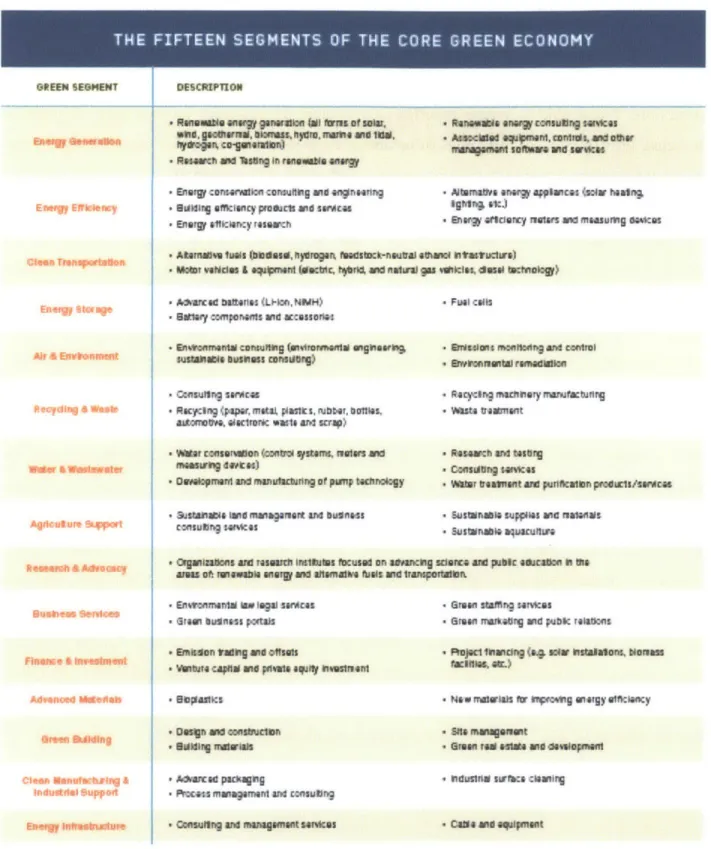
To analyze the economic forces shaping what actually occurred, I performed several steps. First, I collected green economic data from a proprietary marketing data source called the Green Establishments Database (GED). This was created by Collaborative Economics in 2008 and updated annually through the nonprofit Next 10's California Green Innovation Index. The GED accounts for green establishments and jobs using a combination of three elements: 1) business-unit data from the National Establishments Time-Series (NETS) database, 2) a "sophisticated internet search process," and 3) "manual verification" of the business location (Next 10, 2013). They track green companies that fit a "conservative" definition of "all products and services that will experience greater demand as the impacts of climate change increase" which they label as the "Core Green Economy" (Cleantech Group, 2008). Unlike previous studies in the literature that use the North American Industry Classification (NAICS) and Standard Industrial Classification (SIC) codes to track green economic activity, the GED categorizes the establishments into 15 functional "segments" or a general green category. The Core Green economy is broken down into 15 segments which are fully defined in Table 1: energy generation, energy efficiency, clean transportation, energy storage, air and environment, recycling and waste, water and wastewater, agriculture support, research and advocacy, finance and investment, advanced materials, green building, clean manufacturing, energy infrastructure. The GED excludes traditional establishments that are simply incorporating green products; they consider these businesses part the "Adaptive Green Economy," which are not included in this study.
OREEN SEGHENT
Efrm gp E ftk rey
Air -t Evormv
DESCMPTION
* RGneMsa ea 9 rtn " i" fvris or OlA Rwaes an.g ciu td,. gkoMVrnWe, wa., "yro, "ame Ae tI", Aewciidod Op dmeMc
StY"gN, ca-glmsion) inangerWMen otr
* md In11g In r41ah11 W9W
* Engy cornar coasunldig mnd 4f4rlng - Altemavia awrw app
* sadiag effiiency pMOict ad sWecA lgI49 &1c')
* Energy #ilicliry reseamh Envry aft oncy flotau " AtomNSa iuls; Oudasi ydron MudItock-nmt'wai ewcd mItutucwa)
SMOAor VNduu & equ"mnt 0c"rc, tM4 aid nslwal gs q Vikis, deo1 Wtbo.V)
" Aurced baftenihs W-Hain, NUWH) -Fuel calls
SBattey comoneftus and AccessOfs
- £nWOnmn1W consutlibg (olromwiena &ghetkig, . iusions monlotng aMd
uswAov bisimeff cWnstiW g) , Bercanwtal runediio
Ung wvIc4
nrOs, aid o10er
d4 swVIC
cm (scar hetng, ad mUasuMg d.saas
WMI
" Consufnng smviCvit
" RecyciNg 44per, mta, plasitS, rubber, bullies,
at"""i~a, Msclroir wi1e and scrip)
Aglkuu iwprt
6uee Bi9emt
Adem angnas
Cletfi MsnuIczsrg A
0 Energ Ju Wdat inesiaue4AuppMt
* RacycIIl meMIry 1TrWlactulnTg *VA5te MrA4 nt
" W ar conseadon (ntI sysflW, II ters snd * RWsswh V4 to5rg
memsfblgS EN * ConeadUig $Mene
* Owelapmuru and nOwnwutbV4ng Mtpiuilp todf4loIn- gy bromm)ifnt ardS puwlcinAi prcl.W/sariAcAS
" astJ lvit laud manogreiurt and buffiss * SUIMIine suppiea and MEOanS
eosumnag erices * Sustanab quacuns " Ogaoisufiso and tesurdi IrditUiRs %cused on AdlMlnlg $dorce amd pUeC ea4cawon M am
ameas of. mwwlie ei v4ri aid ulleeiiare rna 3142 1ramnpola aW
* En rmninai 1 leIogl snIcas - GmiI ft#fflrg StIC5s
" ireal buanhss pcitals - arman muz*flre g Ind Fuflic ree11 s emkafon tladig WO Otiseli *ujec' 11uclIng 014 maim hISiWlUo, MGrs= * bwttut# cailf ud piWSa e1ily aiNtununt wEilleSa tr
. Ubastics N aw rmlef IM r Opvircig an gy oftmiency
ein aid Cwsbclafn t Sie AMI"aIqu t
Ssaidig nVieMA Oaen rma eele4 u dveidpmeNt
" Alarced paImg
" Px-iss mangernenl and consuling OCcsulrq and Ma ewt w cas
I "dust"a srftca ciakIig
*CaN* amd eRipaMIt
Table 1: Fifteen Segments of the Core Green Economy (Collaborative Economics, Cleantech Group LLC)
Second, rather than regurgitating previously published regional data, my study created new urban statistics on their data. Namely, I extracted the employment and establishment data at the city and zip code level from 2002-2012 on the nine cities. The majority of my analysis used
GED data on the general green category, not by individual green segments. The benefits of using GED - the time series element and a new geographic scale than previously highlighted in literature - outweighed the costs in terms of answering the research question within the time constraints. I was able to create descriptive economic development metrics such as location quotients, growth rates, capture rates of businesses and jobs. However, this study's analysis and conclusions use the job growth rates as a measure of economic productivity.
In addition to collecting and analyzing city data, I also collected program-specific workforce development and labor statistics to measure job creation in the green economy, for whom, and what quality of pay. While I initially attempted to use data sources such as the Bureau of Labor' Workforce Development Local Extraction Tool and the Location Quotient Tools, they did not provide enough detail at the 6-digit NAICS or 8-digit SIC level that other studies have used. It also did not make sense given that I was using the proprietary GED as my major source of green economic statistics. Therefore, I narrowed my measurement to the available 2010-2012 data provided by two certified training programs that would cooperate. To know whether they were "green collar jobs" that met the social standards set out by policymakers and nonprofits (i.e. Ella Baker Center, Apollo Alliance) that helped craft those urban policies, I compared the average prevailing wage of those employed by job placement providers to that of the living wage. I used the Living Wage Calculator from Professor Amy Glasmeier's toolbox housed at MIT. To describe the population being served by these programs in comparison to the larger city makeups, the American Community Census data helped me describe the demographic shifts during 2007 to 2014 when the East Bay Green Corridor organization was most active. I gleaned data on social markers such as race/ethnicity, education, poverty, and unemployment (especially among minorities) within each participating city. Overall, these were used in a descriptive manner, not necessarily evaluative.
Chapter 1: Literature on Green Economic Development and
Regional Innovation
This chapter selectively reviews themes in the existing literature on green economic development as it relates to regional innovation systems, politics, and public policy. First, it defines and characterizes how regional innovation systems work and facilitate technology-based economic activity. Then, it transitions into a discussion about the inadequate existing literature about the East Bay's green establishment performance. Next, it explores the fragmentation between the idea of "green-collar" opportunity, poverty and industrial clustering. Finally, it explains how policy and planning for sustainability are important arenas to explore these political movements around green economic opportunity.
Regional innovation systems and governance
A regional innovation system (RIS) is a set of "complex" and "adaptive" processes to bring innovation to regional markets and societies (Cooke, Gomez, et al. 1998). While there are many definitions of "innovation" in the literature, scholars in economic policy break innovation down into four categories: product innovation, process innovation, marketing innovation, and organizational innovation (OECD, 2005). An RIS involves processes of melding intellectual and physical labor rely on constant interaction to produce learning and knowledge diffusion between an "ecosystem" of actors who make up a "learning region" (Florida, 1998; Saxenian, 1994). Most notably, a RIS relies on universities, governments, institutions, and financial investors (Anselin et al., 1997; Cooke, Gomez Uranga, 1997; Chapple et al., 2010).
Through this mode of economic governance, RIS partnerships often seek to transform old industrial economies into knowledge-intensive, technology driven ones (Florida, 1998). Increasingly, policymakers are targeting clusters as the product of this economic agglomeration and a growingly central geographical manifestation of "putting innovation in place" (Shapira, 2008). For example, under the Obama administration, the U.S. federal government is supporting over 70 regional clusters through the American Recovery and Reinvestment Act (ARRA) funds (Muro, 2013). While there have been critics of the industrial cluster development policy, such as the difficulty in quantifying its benefits (Martin and Sunley, 2003), the literature is clear about clustering benefits to firms and regions. These include benefits such as intensified information networks (Doeringer and Terkla, 1995; Rosenfeld, 1997), knowledge spillovers especially from
universities (Anselin et al., 1997), and increasing returns due to agglomeration (Romer, 1986; Krugman, 1991; Kamath et al., 2012).
Green regional innovation and job growth
Green technology innovation clusters merge two separate concepts - "green technology" and "innovation cluster" - that each warrants some defining before moving into existing arguments about their joint issues. 'Clean' is often used interchangeably with 'green' or 'environmental' technologies in popular media, but the former often encompasses a broader set of economic actors (i.e. natural gas, coal) in environmentally challenged industries supporting technology advances (Pernick et al., 2007). Clean technology or "clean-tech" is taken to mean a 'diverse range of products, services, and solutions that optimize the use of finite and renewable natural resources for long-term commercial and environmental sustainability' (Davies, 2013; Ernst and Young, 2011). However, I will assume the definitions of GED's definitions of green technology rather than imposing an alternative definition not aligned with my data.
The economic performance of the green industrial clusters has mostly been studied from an economic growth perspective: how the cluster leads to increased gross domestic product (GDP) and exports through the expansion of what Porter (1998a) calls "traded industries" (Porter 1998a; North 1955). Karen Chapple et al.'s 2010 study on California's green economic activity in its 34 RIS clusters is an important contribution to dissect carefully. Using National Establishment Time Series (NETS) data from 1990-2008 and survey information from over 650 green businesses, Chapple ranked all 34 California metropolitan regions in terms of their job concentration, growth, and innovation measures. At 30,876 green jobs, the East Bay had the highest 2008 green job location quotient (i.e. the concentration of jobs relative to total jobs share) and the second highest overall number of green jobs; it is unclear what bounds the East Bay region. Furthermore, Chapple calculated a 10.5 location quotient (LQ) in "energy research and services," which is an unconventionally high figure, and a 2.67 Green Job LQ for 2008. For the green innovation metrics, Chapple measured the presence of innovation with five indicators:
1) Patents
2) Venture capital investment
3) Small business innovation research grants' 4) Start-up businesses
Chapple et al. measured this by the distribution of federal Small Business Innovation Research (SBIR) and Small Business Technology Transfer (STTR) grants,
5) Green "Gazelles" 2
With these five metrics combined into a composite score, they ranked the East Bay as the third highest clean-tech RIS, following Los Angeles and Silicon Valley. However, they found that "innovation does not necessarily foster growth" and "no clear link between innovation and job growth" in all of California's green RIS during the period under study.
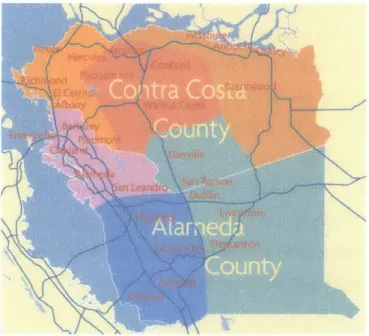
While Chapple's methodological approach is rigorous, the results are not without scrutiny, especially when performing a contemporary urban analysis like this study does. First, due to the economic recession of 2007 until 2011, their conclusions about regional growth may not be indicative of how the East Bay green RIS impacted the labor market in the later years of this study. Furthermore, it is unclear what geographical boundaries they are using to bound the economic outcomes (i.e. combined metro statistical area versus metropolitan statistical area?). Similarly, we do not have a comprehensive list of the cities that count in this regional portrait; these differences are consequential in comparing the urban performance to the region. For example, Richmond is a part of the East Bay corridor but sometimes counts in the Contra Costa County maps, not Alameda. There is some ambiguity about how relevant these figures are today.
While the more current literature consistently ranks the region high in terms of its innovation capacity, there is some variation on how much these innovation-based firms have caused job growth regionally. In 2012, a statewide economic development nonprofit called Nextl0, produced a report on the resilience and growth between 1995-2010 in California's "core green economy" using the GED we rely on in this study. Over this 15-year period, the Bay Area showed a 76% job growth - the second highest percentage out of all 11 regions. But between 2009-2010, it saw a -2% drop in the overall employment from what they quote as 48,700 to 47,800 jobs (Next 10, 2012). While this number is higher than Chapple et al.'s, this study is an incomplete account of the performance of the individual East Bay cities as they were simply aggregated into the larger San Francisco Bay Area's apparent "green growth." But like Chapple, it also does not speak to whether these growth numbers were the targeted or expected outcomes for state or local policymakers in California.
2 Gazelle is a popularized economic development term Chapple et al. used to describe small to medium-sized
The "Green-Collar" Frame, Poverty, and High-Technology Clusters
The scholarship around the transition to a green economy has factions of thinkers within who interpret its goals, definitions, and functions in various ways. Most commonly, scholars define the green economy as a system privileging economic activity that reduces energy consumption and/or improves environmental quality (Chapple 2008; Chapple et al. 2010). However, as early as 2003, Van Jones and other labor movement leaders have inserted social goals to the mantle of a green economy, namely by creating the distinguishing term "green-collar economy" (Jones, 2008). This type of economy is said to provide "well-paid, career track jobs that contribute directly to protecting or enhancing our air, water, and planet." At this level of the concept, it appears to mimic the "Triple Bottom Line" (TBL) framework as a "win-win-win" for corporate investments that help "profits, people, and people" (Slaper 2011; Elkington 1994). Before the TBL, social and economic concerns were already a part of the global discourse on concerns for future generations, as articulated by the 1987 Bruntland Commission (UNWCED 1987). Furthermore, the TBL has also been adapted over the years for non-profit and governmental, which have been merged with both intra-generational and inter-generational equity concerns globally (UNEP, 2009).
But unlike this TBL theory, the green-collar frame is very specific about which types of people green economic activity should help: the poor and/or minorities with employment barriers. The Jones approach cautions, "If a job improves the environment, but doesn't provide a family supporting wage or a career ladder to move low-income workers into higher-skilled occupations, it is not a green-collar job" (Green for All, 2008). Even more, the green-collar frame seems to place specific emphasis on poor people and minorities who have been "locked out of the pollution-based economy of the last century" (Jones, 2008). That is, those who are "structurally" or "chronically" poor, not those who are "episodically" poor for 2 months (U.S. Census Bureau, 2014). Because Chapple et al relied on a more narrow definition of green jobs that is not explicit about the question of poverty alleviation, it is not clear that her study can speak to the ways in which different social groups have experienced the burgeoning 'green' or 'clean economy.' Though they describe job creation in the study, they do not focus on how this job growth develops or includes different social strata of workers.
More recently, Harper-Anderson (2012) explored what "greening the economy" means for African-American workers and entrepreneurs, a social group that has consistently been linked
with higher poverty rates (Partridge and Rickman, 2006). She reviews the existing scholarship showing the unevenness of the ARRA funds, in particular the application of the $150 million provided for the "Pathways Out of Poverty" green jobs training (Gimpel, Lee and Thorpe 2010). Harper-Anderson also points out that African Americans and Latinos make up less than 30% of those working in the green economy (Liu and Keleher 2009) and in certain industries like green construction which makes up 40% of green jobs, African Americans only account for 5% of the workers (Harper-Anderson 2012; U.S. BLS, 2009). She provides five steps "toward a more equitable green economy" that include increased accountability, planning, integration, funding, (Harper-Anderson 2012). However, there is no place-based approach or component that illuminates ways that regional and local government can do this post-ARRA. While Harper provides an example of green resources in NYC's boroughs, it does not refine which sectors these monies impacted nor connect this need for equity into an industrial cluster approach.
Furthermore, there is no guarantee that an economic cluster will reduce the poverty rate. As an exploration of how industrial clusters affect welfare, Fowler and Kleit (2014) tested how the presence of various industrial clusters affects the poverty rate of U.S. metropolitan areas. After running spatial regression analysis, they found that many types of industrial clusters correlate with negative changes in the poverty rate, but sometimes positively (Fowler and Kleit 2014). One issue that they readily admit is that their work cannot speak to the causal relationship between industrial cluster development policies and poverty, only the presence of an "extant cluster" itself. Furthermore, while poverty might reduce in these regional clusters, their model is not saying much about the processes by which these reductions happen and to whom. Michael Porter argued that clusters should build on the strengths of the local market (Porter 1998a), which some believe qualifies him as a strong advocate for poverty reduction (Fowler and Kleit 2014). Yet, in practice, cluster theory has been the justification for policymakers and investors to attract "high-tech, high-wage industries" (Fowler and Kleit, 2014; Allen and Potiowsky 2008; Organisation for Cooperation and Economic Development 1999; Rosenfeld et al. 2003; Trippl and Otto 2009). These types of imported "high tech" industries have not always proven to provide jobs at range of skill levels matching locals, partly due to lack of willingness to invest in skills training (NIST 2013; McGraw-Hill 2012; Morrison et al. 2011). This is cause for critical perspectives on technology-based cluster development strategies that aim to create jobs.
Political framing and sustainable development
Frames are powerful tools in political decision-making because they intentionally distill and depict one's perception of reality. The green or clean economy movement is full of these sociopolitical tools, especially the "green-collar" segment. In his book, the Green-Collar Economy (2008) Van Jones, one of the early architects of the green-collar job movement who emerged from the East Bay, provided a rare insight into the intentional process of creating political slogans. He writes that slogans like "Green Jobs, Not Jails" or "Solar for All" unite social justice and environmentalists in a "politics of hope" through a "Green Growth Alliance" (Jones 2008). Sociologist David Hess validated the presence of these American green economic development coalitions at a state level in his text "Good Green Jobs in a Global Economy" (Hess 2012). Regarding the greening of industrial clusters, Hess argues that the convergence of environmental and industrial policy on green jobs is a developmentalist "frame" that acted as a social movement against neoliberal, laissez faire approaches to the economy. In essence, by supporting individual companies and intervening in markets, states and regions competed in ways that diverged from the "hands-off' economic stance.
However, much more of the popular literature preceding the formation of East Bay's clean technology clusters supports neoliberal approaches to clean technology as an incremental "sustainability transition" strategy (Lawhon and Murphy, 2012). Well-known figures such as Amory Lovins of Rocky Mountain Institute and former Vice President Al Gore promote "natural" and/or "sustainable capitalism" as their preferred frame to unite private and public interests (Hawken, 1999). In fact, Jones dismisses anti-growth environmental arguments (i.e. "steady state economy") as an impractical radical stance compared to eco-capitalism (Jones, 2008). Within this contest of economic sustainability values, it is unclear which parties actually gained the most in this East Bay coalition at urban and community scales. What is clear in the literature is that the "green-collar" frame was an intentional fabrication deployed by a set of actors (i.e. Apollo Alliance) to promote a political and economic movement in cities and regions, which will be especially relevant in understanding who threaded this political frame in
Chapter 2: The Origins of the East Bay as a Green Technology
Region
This chapter provides context on clean-tech based economic development in four sections. First, it describes the state and regional economic conditions surrounding the East Bay metropolitan area before the Green Corridor emerged. Second, it will briefly list some factors leading up to the focus on the policy and market origins of clean technology as an economic development target in California. Then, it will introduce a crude sketch of the East Bay in relation to its metropolitan division and its unique development challenges. Last, it will describe the major business formations in the East Bay clean-tech cluster that serves as the subject for the rest of the thesis.
Economic Recession as a Policy Backdrop
Before 2007, the U.S. economy was thriving by most accounts, especially the housing market, which was expanding along with financial markets to support the demand. In California's San Francisco Bay Area, having nearly recovered from the "Dot.Com" bubble bursting in 2000, housing prices were rising and adding pressure on families to relocate to the periphery cities of the Valley while financiers offered the means (Cox 2014). Given the popularized nature of energy efficiency and residential energy production (i.e. solar), the housing market conditions were also relevant for the market prospects of this sector. Starting in late 2006, housing and financial markets began to deteriorate due to speculative behaviors and activities, namely subprime mortgage lending and "shadow banking" practices (U.S. Financial Crisis Inquiry Commission, 2011). The economy shed 8.1 million jobs between late 2007 and 2012 and over $11 trillion in household wealth in what became known as the Great Recession, largest one since the Great Depression after World War II (Davis 2009). Thus, in addition to "bailing out" a few large financial institutions and companies, the economic crisis created urgency at the federal and state level to take bold actions to help retain (if not create) jobs for Americans. Nearly immediately after President Barack Obama was elected in in 2008, the federal government and Congress responded by creating the American Recovery and Reinvestment Act (ARRA), in which states were the beneficiaries in February 2009. States and cities were allowed to apply for competitive and formula funding based on certain conditions. California was the recipient of
$34.5 billion in awarded funding, the largest of any state in the U.S. (Recovery.Gov, Accessed
Even after the crisis, economic and workforce development practice in California is still deeply affected by conditions set in motion from the Great Recession. Notably, in June 2011, Governor Jerry Brown and the Senate voted to "dissolve" the redevelopment agencies in California and redirect the billions toward public education and safety (Van Der Meer, 2013). Nationally, the majority of jobs that have constituted the "recovery" have not been the better-paying jobs with $14-$21 hourly wages in industries like manufacturing or construction; rather, they have been lower paying jobs in food and retail (National Employment Law Project 2012). These aftershocks have affected sub-populations, namely minorities and the poor, in more negative ways. For instance, nearly all of the gains in economic wealth in Black communities
from 1980 and onward were "wiped out" (Trice, 2012; National Urban League, 2012). The average white family earning $632,000 compared to $98,000 in black families and $110,000 for Latino/Hispanic families (Lowrey 2013; McKearn, Ratcliffe, et al. 2013). These primed any promising solution as worth exploring to fare off the effects of the crisis.
Green Technology as Economic Development in California
To understand how this green technology became a target of economic development investment at federal, state, and local levels, this section will separately describe milestone policies and market changes that led up to the mid-2000s period of this study.
On environmental sustainability, California is widely recognized as a leading environmental and energy policymaking state in the U.S. Even before the contemporary environmental movement began with the publication of Rachel Carson's Silent Spring in 1962, California lawmakers had instituted key environmental health regulations that formed the contemporary basis of clean-tech demand. For example, in 1947, the State authorized the creation of "air pollution control districts" in every county, which preceded the 1955 National Pollution Control Act (Tang et al, Accessed 2014; Green Innovation Index, 2013). A similar early adopter pattern emerged with the Bureau of Air Sanitation formed in 1955 which was combined by Governor Reagan in 1967 to become the California Air Resources Board (CARB, Accessed 2014); because this preceded the Federal Air Quality Act of 1967 and California's "unique need for more stringent controls," it can set its own standards that other states are allowed to follow. Many point to the OPEC Energy Crisis of 1973 over "peak oil production" as a national moment where consciousness around environmentalism, energy, and economic security converged (Macalister, 2011). However, the most recent and relevant shift toward
energy security in California came from 2000 electricity crisis, where Enron manipulated its prices for hundreds of thousands of customers (Egan, 2005; Sweeney, 2002). While the state's
1998 deregulation of the electricity utilities market allowed Enron to do this, it also gave rise to renewable energy investments by the state, which I cover after explaining the technological origins of green technology.
On technology, the idea of "high tech" regions was an economic movement that consumed much of the literature in the 1980s and beyond. Markusen, Hall, and Glasmeier defined this term in 1986 to be three elements: 1) the "perceived degree" of technical product sophistication, 2) the rate of growth in employment within the sector, 3) research and development expenditures as a percentage of sales (or "intensity"). As far back as the 1970s, California was a leading "high tech" state in absolute terms. According to Glasmeier (1986b), it had over 641,000 jobs in 1977, almost double of its second place state of Illinois. In 1981, the State of California projected an 18% annual growth rate of high technology industries from 1980 to 1990, which take the employment of key sectors in these industries to over 1.06 million jobs. In particular, the biotechnology, photovoltaic, and instruments industries hold relevance for the San Francisco and East Bay regions. But more recently, green technology in California has taken on an energy-centric focus in the way it is promoted by the state as a response to climate change. For examples, the 2002 establishment of the California Renewables Portfolio Standard and the 2006 California Global Warming Solutions Act created a statewide mandate for transitions to renewable forms of energy production, upwards of 33% by 2020 (Energy Commission, 2013). As an investment area, green technology garnered $11.6 billion in 2011 and 2012 in the U.S. (Clean Edge 2014). Even the California Public Employees Retirement System (CalPERS) created a fund that invested $900 million in clean-tech - which they reported an unfortunate negative 9.5% return during economic downturn (Walters 2013). Overall, despite these risks and constant shifts in technological advancement, state and federal policies have both cultivated and responded to consumer demand to pursue green technology at the urban and regional level. The East Bay Green Tech Cluster: A Response to Historic Development Challenges
The East Bay is a region in located in Northern California spanning from Richmond in lower Contra Costa County to Livermore in southeast Alameda County that has historically struggled to develop its (technology-based) economy. While innovation around the silicon computer chip in San Jose, CA led to the global Internet boom (and busted bubble) of the 1990s
to 2000s in Santa Clara's Silicon Valley, the East Bay had little equivalent economic development movement and it has been competing to create one for decades. Despite being the home of world-class research institution, the University of California at Berkeley and several national labs, over the years, the East Bay has developed an inferiority complex with the San Francisco and the Silicon Valley metropolitan areas. San Jose, the home of the Silicon Valley, passed up the Oakland MSA population in 1970 and has remained there since (CA REAP, 2014). In the recent past, Alameda County and Contra Costa County have had more higher percentage of people living below the poverty line: 12.0% and 10.2% respectively from 2008-12 (U.S. Census Bureau, 2012). They have also more minorities in its anchor cities like Oakland and Richmond. With the rising in gentrification pushing minorities to the more affordable Central Valley to the east of the East Bay, there has been more abandonment and attempts to revitalize troubled areas like West Oakland and North Richmond with contested concepts of sustainable development by city governments (Cox 2014; Mendoza 2014).
Preceding the rise of the Internet boom, there was the promise of biotechnology as the "next industrial frontier" (Hall et al 1988). With the success of California-based company (now giant) Genentech Inc. in the late 1980s, statements emerged such as, "Many communities believe that biotechnology represents the same type of high tech industry that microelectronics was in the recent past" (Blakeley et al 1988) and that "[biotech] belongs with supercomputers, superconductors, magnetic-levitation transportation systems, robotics, and space exploration" (Hall et al 1988). In 1982, the Oakland area was home to 21 biotech plants, the second-highest number in the Bay Area after San Francisco, the leading city in the country at the time (Glasmeier 1986). Ultimately, these bets in small, seemingly overnight biotech start-ups did not produce the widespread, commercially viable products hoped for (Pisano 2006), which sent many venture capitalists toward the Internet boom across the Bay to earn quicker returns on their investments (Rushkoff 2009). But the East Bay has not stopped promoting biotechnology as the basis of a contemporary green technology movement (Shiva 2013), particularly as biofuel companies such as Amyris Biotechnologies, LLC have successfully spawned and grown. In 2010, the State of California began the Innovation Hub (iHub) program to explicitly facilitate the strengths of its regions. In 2012, the East Bay Green Corridor gained official designation as part of that effort to market and organize its innovation system around clean-tech. This effort will consume the next two chapters of this thesis.
Chapter 3: The East Bay Green Corridor's Goals
This chapter is primarily meant to introduce and describe the life cycle of the East Bay Green Corridor (EBGC) as an organizational partnership between nine cities and four institutional partners, rather than just as a geographical site of clean-tech economic development. In five sections, this chapter explains the dominant goals, identities, and activities that shaped the EBGC from inception to dormancy between December 2007 and August 2013. In Section 1, 1 present the series of events that activated the interests of the East Bay partners and the principles that united them into the EBGC. In section 2, I describe the founding circle of "players" in terms of their stated principles and how they explained the importance of the partnership to the media and to their respective cities. In the section 3, I describe the expansion of the Corridor in 2009 to include new cities and organizations that the founding circle invited. In section 4, I attempt to explain the three thematic activities that the EBGC itself was doing. Lastly, I present the five types of capacity challenges that key informants shared as reasons for the demise of EBGC. In doing this, I narrate how this regional partnership interacted with workforce development, urban environmental policy, and business development.
Section 1: Formation of the Team
In 2006, oil company British Petroleum (BP) announced that it would invest in renewable energy research. With a $500 million grant distributed over 10 years to the recipient institution, University of California at Berkeley (UCB), BP made national waves on how this investment would further their "triple bottom line" ethic. To be sure, this was not the first time a corporation had given money to a university for supporting their business interests. But a multinational corporation supporting research in a seemingly rival "gazelle" industry was astounding; it would lead to the formation of the Joint Bio-Energy Institute (JBEI). Key informants say that it was this event that led the Chancellor of UCB, Professor of Physics Robert ("Bob") Birgeneau to begin strategizing with the cities. "We met for dinner at Chancellor Birgeneau's house," recounted one official, "where he convened all the local mayors of the four major cities to discuss what the implications for local economic development could mean" (Key Informant #1, 2014). Richmond's Gayle McLaughlin, Oakland's Ron Dellums, Berkeley's Tom Bates, and Emeryville's Nora Davis (along with their staff) broke bread together in late 2006. What made this unique from most partnerships on innovation, however, was the inclusion of the Lawrence
Berkeley National Laboratory's Director Steven Chu - later to become the one-time Energy Secretary under President Obama.
Fast forward one year later to December 3, 2007.
"The Silicon Valley of the green economy is going to be here in the East Bay," predicted Mayor Tom Bates at a media event at SunPower Incorporated's location in Richmond. It is unknown what was exactly discussed on that influential evening a year prior. Whatever the case, it was strong enough to bond these municipal governmental and educational leaders into a multi-year agreement. They would become the strategic leaders, or "the Principals," of what became the East Bay Green Corridor (EBGC or "Corridor" for short). He added that "putting our cities' chauvinism aside and working together" would facilitate this because "we're stronger when we
unite." The basis of the union will be discussed next. Toward Goals and Shared Vision
Signed on December 3, 2007, the city officials of the East Bay Green Corridor committed to a "statement of working principles" to guide their "cooperative vision." They include:
1. Create conditions that support new and emerging green industry
2. Strengthen existing programs promoting technology development and transfer 3. Support employment development opportunities in emerging green industries 4. Build a more cohesive regional identity in energy-related green business sectors
5. Protect our economies from climate change and energy shocks
6. Cooperate in obtaining grants and project funding for green research and entrepreneurship
7. Improve our living environment and quality of life
The process by which these goals were set was unclear. According to an official who was present for the initial dinner in 2006, "the mayors got to talking but it still wasn't clear what we were agreeing about" (Key Informant #10, personal communication, March 12, 2014). So in actuality, they left it up to their staff that served on the Steering Committee to set the rules for the fledgling regional organization. So as admirable and specific as they are, these goals should be not viewed as the most stable commitments given the turnover in government staff and limited input. This ambiguity of purpose came from a plurality of regional identities and subjectivities, a consistent theme that carried throughout the articulated programs. For example, when one reviews the list of grants provided to EBGC partners, only two actually propose concrete performance goals.
"There was this air of legitimacy," explained a staff official as to why the four cities had a confidence that they were going to "catch the green wave" (Key Informant #1, 2014). What was fueling this risky, entrepreneurial hope? One must scan the literature in the preceding years to understand the unrelenting intellectual energy for all things "green" or "clean." Optimistic books were emerging that hyped an emergent "energy revolution" as "bigger than the Internet" (Vaitheeswaran 2003) in similar ways as biotechnology had been in the 1980s. Groups such as the United Steelworkers and Sierra Club were organizing new coalitions such as the "Blue-Green Alliance" that placed their faith in an oncoming "green growth" that would create new blue-collar jobs. In the East Bay, an activist named Van Jones was one of the earliest to unite environmental ethics with socioeconomics under banners such as "Green Jobs, Not Jails" and "Asthma-Free Cities." Riding the wave of these catchy terms promising economic transformation, Jones would later become a Special Advisor on Green Jobs to President Obama. But beyond optimism, practically speaking, the Partnership had no dedicated staff person in 2007; Section 4 will cover how they went about changing that. Overall, these goals were a product of almost one year of private negotiations among the staff of the four founding cities. Section 2: The Founding Partners
Berkeley
Berkeley was an initiator of the EBGC partnership and took on much of the leadership responsibility. The Chairperson, Tom Bates was elected to the Mayor Office's initially in 2002 with a heap of Berkeley-specific credentials, including being a 1961 alumnus of UCB and the husband of former Berkeley mayor Loni Hancock (Bates for Mayor, 2012). However, Bates also was no stranger to state politics as he served for over 20 years as an Assemblyman. In a scan of his recent campaign platforms, Bates promises to address social concerns around homelessness while expanding economic opportunity and efficiency through government. Demographically, a majority of Berkeley residents are between the ages of 18-64 years old and White with an average home value of $780,000; this is much wealthier than other cities in the region. Out of the nearly 16,000 firms in the city, Berkeley's two primary economic actors are UC Berkeley, which employs 14,475 people, and Lawrence Berkeley National Lab at 4,000 employees. Of course, these are also the two primary institutional partners in the EBGC.