The Development of the Production System Design Decomposition Framework
by
Kristina Michelle Kuest
B.S., Manufacturing Engineering (1995) Boston University
Submitted to the Department of Mechanical Engineering in Partial Fulfillment of the Requirements for the Degree of
Master of Science in Mechanical Engineering at the
Massachusetts Institute of Technology June 1999
@ 1999 Massachusetts Institute of All rights reserved
Technology
i t
Signature of Author ... .4 my V.I.u.r; - .
Department of Mechanical Engineering May 7, 1999
C ertified by ...
David S. Cochran Assistant Professor of Mechanical Engineering Thesis Supervisor
Accepted by ... Ain A. Sonin Chairman, Department Committee on Graduate Students
THE DEVELOPMENT OF THE PRODUCTION SYSTEM DESIGN DECOMPOSITION FRAMEWORK
by
KRISTINA MICHELLE KUEST
Submitted to the Department of Mechanical Engineering on May 24, 1999 in partial fulfillment of the
Requirements for the Degree of Master of Science in Mechanical Engineering
ABSTRACT
The design of a production system can be complicated and convoluted without a guideline to follow. The interrelationships between different design aspects affect the system design as a whole. Without a methodology for production system design, the system may not perform as designers anticipate. It is essential to determine the fundamental components of a production system and explore the relationships between these elements; otherwise, the system design may not fulfill its objectives. The decomposition framework enables the design of the system, as well as its deployment. This framework also enables system designers to regard elements of design at a single glance and predict the
outcome of system changes, which is particularly valuable in existing production systems.
The decomposition framework consists of the decomposition tree, the PSD design matrix, the PSD evaluation tool, system flowchart of implementation, and FR/DP examples. The methodology supporting the decomposition is axiomatic
design. System requirements are determined and translated into a set of
function requirements (FR's). Corresponding design parameters (DP's) specify the manner in which these requirements are fulfilled. The relationships and dependencies of these FR's and DP's are expressed in a heirarchy of design matrices. These matrices can be combined into an aggregate matrix, the PSD design matrix. This information can be translated into a flowchart depicting order of implementation of design parameters. The evaluation tool assists in
evaluating design and operation, identifying shortcomings of both new and existing designs. Examples provide designers with a source of ideas for their own systems. These tools are the basis of the production system design framework.
Thesis Supervisor: David S. Cochran
Acknowledgments
The support of many individuals have made this work possible. I am indebted to each of them for their support in attaining my foremost goal. First, I would like to thank Prof. Cochran for the opportunities that he has given me. I have benefited greatly from both his experience and knowledge and have appreciated his time and guidance. I also thank the International Motor Vehicle Program (IMVP) for sponsoring my research.
I thank the members of the Production System Design Lab (PSD) for all of their assistance in the development of the framework examined in this thesis. Their ideas, insights, and positive thinking were invaluable in the creation of this framework. In particular, I would like to thank Andrew Wang for reviewing this
thesis and providing valuable comments.
I want to thank my family for supporting me throughout this endeavor and being patient enough to see its fruition. I appreciate the encouragement from my friends throughout my pursuit of this degree. I would also like to thank my friend Kelly Kocinski for her masterful English skills and patience to read an
engineering thesis. I especially thank Nicholas Mistry for all of the support and the countless hours that he has helped to put this thesis together. Without his assistance, this work would not have been possible.
Table of Contents
ABSTRACT ... 3 ACKNOW LEDGMENTS... 5 TABLE OF CONTENTS ... 5 CHAPTER 1 INTRODUCTION...11 SECTION 1.1 BACKGROUND ... 11SECTION 1.2 BENEFITS OF DECOMPOSITION FRAMEWORK ... 12
SECTION 1.3 OUTLINE OF THESIS ... 13
CHAPTER 2 THE DESIGN DECOMPOSITION FRAMEW ORK...15
SECTION 2.1 INTRODUCTION ... 15
SECTION 2.2 AXIOMATIC DESIGN ... 16
SECTION 2.3 THE PRODUCTION SYSTEM DECOMPOSITION ... 21
SECTION 2.4 THE PSD MATRIX... 21
SECTION 2.5 THE DESIGN EVALUATION TOOL ... 22
SECTION 2.6 THE SYSTEM DESIGN FLOWCHART AND DEPLOYMENT STEPS... 23
SECTION 2.7 EXAMPLES ... 24
SECTION 2.8 THE USEFULNESS OF THE FRAMEWORK ... 24
SECTION 2.9 DIFFERENT TYPES OF PRODUCTION...26
SECTION 2.10 KAIZEN (CONTINUOUS IMPROVEMENT) ... 27
CHAPTER 3 HIGH LEVEL DP'S (LEVEL 1, LEVEL 2, LEVEL 3)... 29
SECTION 3.1 INTRODUCTION ... 29
SECTION 3.2 DECOMPOSITION OF LEVEL ONE... 29
SECTION 3.3 DECOMPOSITION OF LEVEL TWO ... 33
SECTION 3.4 DECOMPOSING TO LEVEL THREE ... 39
Section 3.4. 1 Decomposition of FR/DPI1 ... 40
Section 3.4.2 Design matrix of FR/DPI11 - 113 ... 46
Section 3.4.3 Decomposition of FR/DP12 ... 46
Section 3.4.4 Design Matrix for the FR/DP121 - 123 Level...48
CHAPTER 4 THE QUALITY BRANCH OF THE DECOMPOSITION TREE...49
SECTION 4.2 THE QUALITY BRANCH- THE DECOMPOSITION OF DP-1 11 ... 49
Section 4.2. 1 Formulation of the Top Level Quality FR's ... 50
Section 4.2.2 FR/DP Relationships for Top Level of Quality ... 53
Section 4.2.3 Design M atrix for Top Level... 57
SECTION 4.3 DECOMPOSITION OF LEVEL Two OF QUALITY...58
Section 4.3.1 Formulation of the Second Level Quality FR's...58
Section 4.3.2 FR/DP Relationships of the Second Level of Quality...59
Section 4.3.3 Design Matrix of the Second Level of Quality...62
SECTION 4.4 DECOMPOSITION OF LEVEL 6 OF QUALITY ... 62
Section 4.4. 1 Formulation of the Third Level Quality FR's ... 63
Section 4.4.2 FR/DP Relationships of the Third Level of Quality...64
Design Matrix of the Third Level of Quality... 68
CHAPTER 5 THE IDENTIFYING AND RESOLVING PROBLEMS BRANCH OF THE DECO M POSITIO N TREE ... 69
S ECTION 5.1 INTRODUCTION ... 69
SECTION 5.2 THE FORMATION OF THE IDENTIFYING AND RESOLVING PROBLEMS BRANCH...70
SECTION 5.3 FORMULATION OF THE IRP's TOP LEVEL FR'S ... 70
SECTION 5.4 THE FORMULATION OF THE IRP'S SECOND LEVEL FR/DP'S...71
Section 5.4. 1 FR/DP Relationships of the IRP's Second Level ... 72
Section 5.4.2 Design Matrix of the IRP's Second Level ... 75
SECTION 5.5 THE DECOMPOSITION OF DP-R11 ... 76
Section 5.5.1 FR/DP Relationships of R 11 - R113... 76
Section 5.5.2 Design Matrix for FR/DP R 111 - R 113 ... 79
Section 5.5.3 FR/DP Relationships of R121 - R123... 80
Section 5.5.4 Design Matrix of FR/DP R121 - R123... 82
CHAPTER 6 THE PREDICTABLE OUTPUT BRANCH OF THE DECOMPOSITION TREE..83
S ECTION 6.1 INTRODUCTION ... 83
SECTION 6.2 THE FORMATION OF THE PREDICTABLE OUTPUT BRANCH...83
Section 6.2. 1 Design Matrix for the Decomposition of DPI 12...84
SECTION 6.3 DECOMPOSITION OF THE SECOND LEVEL OF THE PREDICTABLE OUTPUT BRANCH ... 85
Section 6.3.1 FR/DP Relationships of the Second Level of the PO Branch...86
Section 6.3.2 Design Matrix of Second Level of the PO Branch...99
SECTION 6.4 DECOMPOSITION OF THE THIRD LEVEL OF THE PREDICTABLE OUTPUT BRANCH...100
Section 6.4.1 FR/DP Relationships of the Third Level of the PO Branch...100
CHA PTER 7 DELAY REDUCTIONS...105
SECTION 7.1 INTRODUCTION ... 105
SECTION 7.2 DESIGN MATRIX: THE INTERRELATION OF DELAYS...105
SECTION 7.3 RUN SIZE DELAY ... 106
Section 7.3.1 Decomposition of DP-T1 ... 109
Section 7.3.2 Design Matrix of FR/DP T1I- T12...114
SECTION 7.4 PROCESS DELAY ... 114
Section 7.4.1 Decomposition of DP-T2 ... 116
Section 7.4.1.1 FR/DP Relationships for Level Two of Process Delay ... 117
Section 7.4.1.2 Design Matrix for the Second Level of Process Delay ... 120
Section 7.4.2 Decomposition of DP-T22...120
Section 7.4.2.1 Design Matrix for FR/DP T221 - T223...125
Section 7.4.3 Decomposition of DP-T23...126
Section 7.4.3.1 Design Matrix for FR/DP T231 - T232...127
SECTION 7.5 LOT DELAY ... 128
SECTION 7.6 TRANSPORTATION DELAY ... 132
SECTION 7.7 SYSTEMATIC OPERATIONAL DELAYS ... 135
Section 7.7.1 Decomposition of DP-T5 ... 136
Section 7.7.1.1 Design Matrix for FR/DP T51 - T53...139
CHA PTER 8 THE DIRECT LABOR BRANCH ... 141
SECTION 8.1 INTRODUCTION ... 141
SECTION 8.2 FORMULATION OF DIRECT LABOR TOP LEVEL FR'S...141
Section 8.2.1 Design Matrix for Top Level Direct Labor...145
SECTION 8.3 DECOMPOSITION OF DP-D1...145
Section 8.3.1 Design Matrix for FR/DP D11 - D 12...149
SECTION 8.4 DECOMPOSITION OF DP-D2...150
Section 8.4.1 Design Matrix for FR/DP D21 - D23...154
CHAPTER 9 THE INDIRECT LABOR BRANCH OF THE DECOMPOSITION TREE ... 155
SECTION 9.1 INTRODUCTION ... 155
SECTION 9.2 THE INDIRECT LABOR BRANCH- THE DECOMPOSITION OF DP-122...155
Section 9.2. 1 FR/DP Relationships ... 156
Section 9.2.2 Design Matrix for FR/DP /I - 12... 158
CHA PTER 10 THE DESIGN MATRIX...159
SECTION 10.1 INTRODUCTION ... .. 159
CHAPTER 11 SYSTEM DESIGN FLOWCHART AND DEPLOYMENT STEPS...165
S ECTIO N 11.1 INTRO DUCTIO N ... 16 5 SECTION 11.2 DEVELOPMENT OF THE FLOWCHART ... 165
S ECTION 11.3 D EPLOYM ENT STEPS...167
CHAPTER 12 PRODUCTION SYSTEM DESIGN EVALUATION TOOL ... 169
S ECTIO N 12 .1 INTRO DUCTIO N ... 169
SECTION 12.2 USING THE DESIGN EVALUATION TOOL ... 169
CHAPTER 13 EXAMPLES OF THE APPLICATION OF THE FRAMEWORK ... 173
S ECTIO N 13.1 INTRO DUCTIO N ... 173
SECTION 13.2 EXAM PLE OF FR/DP-T4...173
SECTION 13.3 EXAM PLE OF FR/DP-T21 ... 174
S ECTION 13.4 EXAM PLE OF FR/D P-13 ... 174
SECTION 13.5 EXAMPLE OF FR/DP-T221 AND FR/DP-1 11 ... 175
SECTION 13.6 EXAMPLE OF FR/DP-T222...176
SECTION 13.7 DP'S THAT AFFECT MACHINE DESIGN ... 177
CHAPTER 14 CONCLUSIONS AND FUTURE WORK...179
APPENDIX A - PSD DECOMPOSITION CHART VER. 5.0...181
APPENDIX B - PSD DESIGN MATRIX VER. 5.0 ... 189
APPENDIX C - PSD SYSTEM DESIGN FLOWCHART VER. 5.0...191
APPENDIX D - PSD DESIGN EVALUATION TOOL VER. 5.0...193
APPENDIX E - GLOSSARY ... 195
Chapter 1
Introduction
Section 1.1 Background
The complexity of the design and deployment of production systems requires a full understanding of system elements and the relationships between them. The production system must be able to satisfy its customers while maintaining a satisfactory profit level. Today's market demands high quality products with little lead time. Product lifecycles are becoming increasingly shorter and volumes can fluctuate dramatically. Competitive companies must cut costs and provide better service than their competitors. In order to satisfy these requirements, the design of the production system must be responsive to these attributes. Designers must change their development techniques from a nonstructured system to a highly organized system.
Many designers hear buzz words and try to implement them into the system, but without the full knowledge of how these concepts work. This action can lead to
disastrous results. Tolstoy writes in What is Art?, "As happens with everything, the more vague and confused the concept conveyed by a word, the greater is the aplomb and assurance with which people use the word, pretending that what is understood by this word is so simple and clear that it is not even worth talking about what it actually means." This comment can be translated from any field-from literature to engineering. Concepts like JIT and kanban can decimate a system if not used properly.
The interrelations between design objectives must be considered throughout the design process. Many aspects of production are tied together. For example, if manual work is being eliminated by automation, there will be a subsequent
increase in the direct labor to maintain and program these machines. Another example is that a reliable information system is a prerequisite to reliable worker
output. If the workers do not know the part types and the quantities that they are supposed to produce, they will not be able to satisfy the requirements.
Applying a solution for one manufacturing system to another will fail unless both systems are fully understood since each has its own system requirements. The functional requirements of one system may not be the same as those of another. The objectives of each system must be clearly understood; all customers,
internal and external, must be satisfied to maintain a competitive system. The deployment of a design must be organized and carefully planned. The
Decomposition Framework provides a methodology for the design and deployment of production systems.
Section 1.2 Benefits of Decomposition Framework
The decomposition framework draws upon the structure of axiomatic design and the roots of the Toyota Production System to provide a means for systematically designed production systems. Axiomatic design provides a methodical approach to design, while the Toyota Production System employs creative solutions to production problems, such as jidoka and Just In Time production (JIT).
The decomposition framework also provides a methodology for the deployment of the production system. Processes, workers, transportation devices, and
inventory must be considered in the proper sequence to eliminate system redesign due to design conflicts. The entire system must be considered as a whole instead of a group of independent entities; otherwise, production resources
could interfere. An example of this concept applies to the flow of parts through the system. If one machine produces at a greater rate than others, the machine may be either be starved for parts (if a slower machine precedes it) or
overproduce an excess of work-in-process inventory (if it has sufficient resources available to constantly produce). The capacity of the system should match the
capacity of the individual processes. Thus, the capacity must be decided prior the selection of processes. The system design flowchart illustrates the order that the DP's must be fulfilled. Deployment steps provide a basis to implementing
new designs. The entire framework consists of the decomposition, design matrix, system design flow chart, diagnostic, and examples relating to the decomposition.
This framework has many benefits associated with employing it. This
methodology can be used for design, deployment, and diagnosis of the system. All attributes of the manufacturing system and their interrelations can be
explained. Design tasks can be separated because the dependencies of these tasks are known. The framework is suitable for any industry and any product because it concentrates on the elemental characteristics of production systems. Areas for system improvement can be easily pinpointed using the components of this framework, specifically the design evaluation tool. Machines can be
designed with the entire system in mind, not just the operation itself, by
identifying attributes of equipment that require a system's focus. The framework can adjust to the changing needs of the organization due to internal and external influences; the company must be more robust to changes in the marketplace as well as changes within the production system itself.
Section 1.3 Outline of Thesis
This thesis consists of five main sections. The first section, Chapters 3 through 9 discusses the production system decomposition. It details the development of each pairing of functional requirements and design parameters. Each
relationship is discussed as well as the dependence between these relationships.
The next section, Chapter 10, concerns the development of the PSD matrix. An aggregate matrix has been developed to show the interrelation of every
functional requirement and design parameter. This tool proves that the decomposition can generate good designs as determined by the concepts of Axiomatic Design.
Following this section is Chapter 11- the system design flowchart. This tool shows the proper sequence of implementing design parameters. It is effective for planning the deployment of a system.
Chapter 12 discusses the section on the design evaluation tool. The effectiveness of a production sysand its ability to satisfy the goals of the
functional requirements can be ascertained using this simple chart. Records of the results of improvements can be maintained. Areas that require attention are
easily identified.
The last section, Chapters 13 and 14, provides examples of using the framework and proposes future work. Supplementary examples provide insight to the effectiveness of the framework. Individual case studies can be used to illustrate the concepts behind the decomposition framework. Discussion of future projects
Chapter 2
The Design
Decomposition
Framework
Section 2.1 Introduction
Production systems are highly complex entities of many interdependent relationships of customer requirements, functional requirements, design parameters, and process variables. The design of these systems requires knowledge of the requirements and the constraints of the system such as expected production volume and customer lead time. Yet, all of production systems have common design elements. The design decomposition framework identifies these similarities and illustrates a method of structuring the system. This framework identifies design objectives and determines the order of the design sequence. This framework illustrates the relationships between high and low level objectives of general designs. The framework is equipped with tools to guide the deployment of the design. There is also a device for assessing the level of success that the design meets the functional requirements.
The framework is grounded in Axiomatic Design, which is the basis for manufacturing system design and implementation-path dependency [Suh,
Cochran, Lima, 1998]. The goals of the design are clearly identified as well as the method by which they will be satisfied. The framework enables the
communication of these elements to everyone in the design stage. A common methodology fosters a better environment for designers; there is a singular set of consistent practices in the design. Haphazard designs are avoided in this
structured manner, as well as confusion about what is demanded of each designer. Concurrent design is feasible because of the separation and sequencing of tasks.
The framework consists of the following five elements: the Production System Design (PSD) Decomposition, the PSD Matrix, the PSD Flowchart and
Deployment Steps for Implementation, the PSD Evaluation Tool, and the PSD
FR/DP Examples. These components are shown in Figure 2-1.
Figure 2-1: The Production System Design and Deployment Framework
Design
Design Decomp
Deployment
Design and Deployment Framework
Design Evaluation
H:1 Tool
osition Design Matrix
Examples
Examples
System Design Flowchart
Deployment Steps
0. Determmen who the customers ar I Fmoellsbasedoncustomiertakttime 2. Single-minute diangeo -rtAmie
3 Predidable Quahty and Time output
4 Leke Mfg tnh anmbly Cllsy
5 Link Cells 'i6PISystem
6. Lnk Sler ht rit il ysr
fhtrpabiliy)
The design process consists of four distinct aspects: problem definition, creative process, analytical process, and ultimate check. [Suh, 1990, p. 6] It is essential to know what is ultimately expected of the product/process; therefore, a
comprehensive problem definition is necessary to ensure that all aspects of the problem are addressed. The creative process involves the brainstorming of new ideas and the reuse of old designs (previously thought to be applicable or not) to solve the problems posed. The analytical process assesses the criteria of the design; specifically, whether or not the design in question is feasible and optimal
from the set of proposed designs. A final check is always needed to verify the design's capability of satisfying its goals. Oftentimes, this four-part process is recursive; it may require several repetitions through the four steps to reach a final design.
Axiomatic design is a methodology that provides structure to the design process, ensuring that the end result manifests in a complete realization of the design
objectives. Its rigorous form eliminates designs based on pure hunches that can yield to solutions that are ill-fitting, incomplete, or excessive. Suh considers the fundamental goal of Axiomatic Design to be the creation of a science base of
design and a theoretical foundation based on systematic thought processes. [Suh, 1998]
Design is comprised of four domains: customer domain, functional domain, physical domain, and process domain [Suh, 1998, p. 15]. These are illustrated in Figure 2-2 below. The customer requirements such as functionality, facilitated repairability, etc. are specified in the customer domain or attributes (CA's).
Constraints for the design are set by the customer at the onset for items such as investment and unit cost. The customer prerequisites form the functional
requirements (FR's). The FR's answer the question, "What should this design achieve?" The physical domain is comprised of design parameters (DP's) that specify the manner in which the FR's will be fulfilled. These DP's answer the question, "How will this be done?" The details of the processing, including
Figure 2-2: The Domains of the Design and Their Interrelations
{CA})F}{P {V}
Mapping Mapping Mapping
Customer Functional Physical Process
Domain Domain Domain Domain
Axiomatic design has two central axioms [Suh, 1990, p. 47-48]: Axiom 1 The Independence Axiom
Maintain the independence of FR's.
Alternate Statement 1: An optimal design always maintains the independence of FR's.
Alternate Statement 2: In an acceptable design, the specific DP can be adjusted to satisfy its corresponding FR without affection other functional requirements.
Axiom 2 The Information Axiom
Minimize the information content of the design.
Alternate Statement: The best design is a functionally
uncoupled design that has the minimum information content. The first axiom states that the satisfying of one FR should not impact the
feasibility of another FR; this is the idea of independence. If one FR infringes upon another, one or both of the FR's should be reformulated to eliminate the dependency. The second axiom stipulates the design should be as decoupled as possible to increase the possibility of the success of the design.
One important point to stress is that the Independence Axiom is associated with functional independence, not physical independence. By considering the
implications of the two axioms, it can be inferred that a multi-functioned part would minimize information content provided that independence of functions
long as the functions remain independent, should reduce complexity." [Suh, 1990, p. 50] This fulfills Corollary 3 of the Axiomatic Design Theory: integrate design features in a single physical part if FR's can be independently satisfied in the proposed solution [Suh, 1990].
Developing a design decomposition requires a mapping between FR's and DP's. The highest level FR is established and a corresponding DP is chosen. There is not one unique DP for any FR which implies that there can be more than one feasible method of satisfying the FR. If the DP chosen needs more information in
order to be fulfilled, it can be decomposed into two or more FR's. This iterative process repeats until there is sufficient information for the design to be deployed. Figure 2-3 illustrates the design decomposition.
Figure 2-3: Zig-Zagging Technique of Decomposition
The order of the sub-FR's is determined by the Design Matrix (DM) for that level. The DM shows the dependence of the DP's to the FR's. It is written in the form {FR}= [DM]{DP}. If there is a FR/DP dependent relationship, a one (1) is placed
in the matrix to represent it. If the FR/DP pair are independent, then a zero (0) is placed in the matrix. The diagonal elements of the matrix should be one's (1's).
If a specific relationship between the FR and DP is known, it can replace the one (1) in the matrix. The completed matrix shows the state of the
design-uncoupled, decoupled or coupled.
An uncoupled design is one whose design matrix has all elements equal to zero except the diagonal elements. This design is considered to be the best design solution when possible because of the complete independence of the FR/DP pairs. The order of implementation of the DP's is evident; since there is no inter-relationship between the pairs, each DP can be performed concurrently.
A decoupled design has a matrix that is either upper or lower triangular. This design is considered to be an acceptable design solution; however, it is path dependent. This means that the order of implementation of the DP's is established by the design relationships. The DP's that affects the most FR's should be performed first and fashion starting with the first (DP1) and ending with the last (DPn) where n is the total number of DP's.
A coupled design matrix is comprised of many non-zero elements. This design is an unacceptable type of design and must not be implemented. In a coupled design, the adjustment of one DP could impair the satisfying of another FR. If this design could ever be successful, it would be highly iterative and unstable if the DP's were altered by variance in the system. Some coupled designs can be
resolved into decoupled designs by changing the order of the FR/DP's if the resulting matrix would be lower triangular. By reformulating the DP's, sometimes the dependence will be eliminated and the overall design can be acceptable. Most often, a coupled design is not desirable and must be redesigned.
The Production System Decomposition
The decomposition spans six levels, starting with the highest level functional requirements and ending with the lowest. Using axiomatic design, the DP's are selected to satisfy the FR's. The first three levels of the decomposition are considered to be the high level objectives. At the fourth level, the tree splits into six main branches: quality; identifying and resolving problems; predictable output; delay reduction; direct labor; and indirect labor. A compressed version of the decomposition is shown in Figure 2-4; a larger version of it is in Appendix A.
Chapters 3 through 9 detail this decomposition.
Figure 2-4: The Production System Decomposition
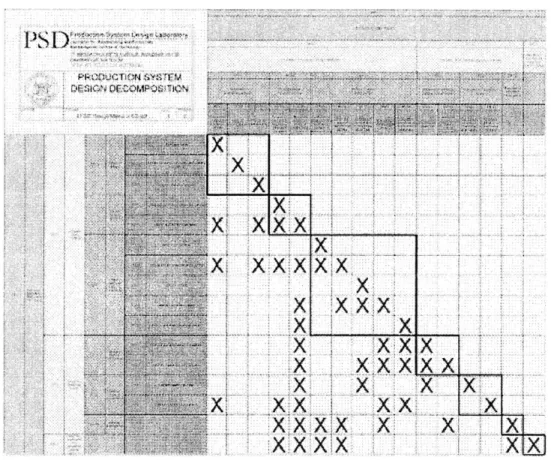
Section 2.4 The PSD Matrix
The purpose of the design matrix is to illustrate the dependent relationships of the FR's and DP's across the many levels of the decomposition. The matrix
shown relates all FR's and DP's through level four. The resulting matrix is decoupled with path dependencies. The PSD matrix proves that the design is a
decoupled design as prescribed in the rules of axiomatic design. A larger matrix with all levels represented could be developed, but it would be more specific. The PSD matrix represents the generic decomposition. A smaller version of the matrix is shown in the figure below and a larger version of it is in Appendix B.
Figure 2-5: The PSD Matrix
- I .
K -X
x xx x
e 4 xxxx
xxxx
x j~ x
x
x
Section 2.5 The Design Evaluation Tool
The design evaluation tool provides the means of assessing the success of a
design. This tool is valuable for evaluating new designs and providing a road
map for the improvement of existing manufacturing systems. Each DP is scaled
relative to the achievement of an FR. A small version of this chart is shown
below and a larger one is found in Appendix D.
Figure 2-6: Design Evaluation Tool [Cochran, Wang, 1999]
PSD Evaluation Tool v5.0
D.S. Cochran, A. Wang
Copyright MIT 1999 All rights reserved
Section 2.6 The System Design Flowchart and Deployment Steps
The system design flowchart, as depicted in Figure 2-7, shows the order of implementation of the DP's based on the fact that the PSD design is represented by a decoupled, and therefore, path dependent design. Activities that can be performed concurrently are easily identifiable as are those that must be
performed sequentially. All of the DP's are shown in the flowchart; therefore, a team of designers can divide the development tasks. Redundant work as well as rework due to conflicting designs of the system is avoided . A larger scale version of this flowchart is in Appendix C.
The deployment steps for implementation convey the basic path to a lean
production system. These seven steps as well as the flowchart are discussed in Chapter 11.
2 3 :7
5
--Figure 2-7: The System Design Flowchart [Cochran et al, 1999]
Section 2.7 Examples
Having a knowledge base of examples assists designers in finding creative ways to solve their problems. Examples from across industries as seemingly diverse
as automotive and aircraft illustrate the universal applications of this framework. Examples are scattered throughout discussion of various aspects of the
framework, as well as in Chapter 13.
Section 2.8 The Usefulness of the Framework
There are many benefits of using the PSD framework. Elements of the
production system and the relationships between them can be understood more fully. The framework can be applied to a multitude of production system types and different industries. This framework advocates lean thinking but does not prescribe a singular method to production; it is sensitive to both product and process. The framework is flexible to changes in the market; the DP's can adjust to a revised set of FR's. Because the interdependent relations have been
established, the effect on the system of changing any DP can ascertained immediately. The evaluation tool enables an assessment of total system
performance, instead of just segments of it. This tool can be used to assess the performance of both greenfield and brownfield production systems. Machine design, and other requirements, are linked to the system design [Cochran, 1999].
The previous version of the framework does not attain the level of detail that this version has. Version 4-2 [Cochran et al., 1998] was more qualitative; it lacks version 5's [Cochran et al, 1999] more quantitative approach to system design. The high level FR/DP's have been changed in the new version. For example, the previous chart's top level DP is a Lean Production System. This DP was
determined not to embrace the ideal that this chart be relevant to any type of production. Also, it was found that these high level FR/DP's did not capture the long range aspects of the production system. The investment branch has been eliminated because of the chart's universal applicability to any type of production. The investment structure for production depends on the product being produced, the reliability of its market, and the lifecycle of the production system itself.
There is more of a distinction between the effects of design issues on mean throughput time and throughput time variance in the new format. The new
version stresses the differences between the types of delay in the system; whereas, the older version talked about them with relation to mix and balance
issues. Even though both methods are valid, having the decomposition in terms of delays can be more pertinent on the shop floor level.
The format of the new version combines the FR decomposition with the DP decomposition into one flowchart. This technique faciliates the use of the chart; the reader does not have to zig-zag between the two flow charts because all of the information is contained in one chart. The notation of the chart has also been changed; the location of a FR/DP pair can easily be identified by its suffix. For example, FR-Q12 is in the second level of the quality branch. FR's and DP's that
refer to balancing are denoted with a B within a square. FR's and DP's that designate leveling are denoted similarly with a L within a square. The "i" refers to additional information for the complete understanding of the DP's.
Different Types of Production
As previously mentioned, the PSD framework is proposed to represent the system design relationships necessary for discrete-part production of any part type. It is proposed that the framework also applies to discrete part products independent of volume [Cochran, 1999]. Job shop, departmental, transfer lines, and linked-cell production are among these types. The framework advocates lean production principles that stray from traditional mass production
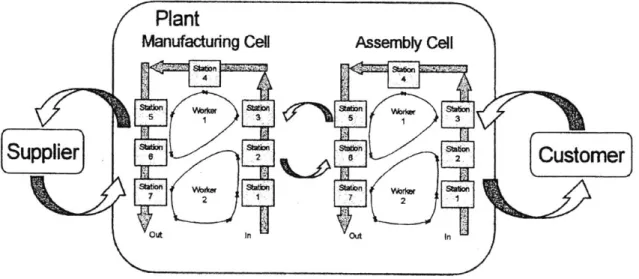
approaches. Production should be streamlined with all waste eliminated. Operational and investment costs should be at a minimum with the highest possible quality. This make-to-order production stresses flexibility in volume and product mix, as well as the responsiveness and on-time delivery to the customer. The performance of the system is valued over the performance of a single area. Figure 2-8 illustrates a schematic of the lean, linked-cell manufacturing system.
Figure 2-8: Schematic of a Lean Manufacturing System [Cochran, 1998]
Plant
Manufacturing Cell Assembly Cell
Supplier ]
2Customer
A typical mass production system produces in batches, according to a demand forecast. This make-to-schedule system has low levels of flexibility in product
mix and volume. It is associated with high levels of inventory- both finished goods and work-in-process (WIP). Typically, mass production has a functional
layout with categories of machines grouped together. Machine productivity is stressed over individual worker productivity. High-speed, monolith machines are prevalent, turning out parts faster than are required by the downstream customer. Traceability of errors is difficult and defect rates are usually high. Workers are bound to machines, generally performing repetitive tasks. Optimization of departments without regard to the impact it has on the system is common.
Figure 2-9: Example of a Mass Production System [Cochran, 1998]
Components Plant Vehicle Assembly
Machining ~ ~ C = 1&1 sec~,=5-6 e
"Super Machining" _High Sped d ... E r
in Job Shop Layout Assy
Turning Broach Straighten Wash High Speed
Dept. Dept.w ept. Dept. Aesca o
Heat T. Grind High Speedn
utsidiv e nts iembly s
Machining - In cT., = so-60 sec
Departmental Layout
Section 2.10 Kaizen (Continuous Improvement)
After setting up a production system, it is arrogant to think that the first way is the best way. Since the market fluctuates, the production system cannot remain stagnate. To remain competitive, it is essential to always to strive for
improvement. With experience comes knowledge; as time progresses, workers
can provide insight to improvements in the system. These insights lead to changes, which enable the system to become more productive, more humane, and more predictable. Quality, throughput time mean and variance, and waste in
both direct and indirect labor can be improved by incremental changes in the system. It is critical to value everyone's opinion and implement improvements as they arise.
When changes are made, they can affect more than one activity. For example, reducing the worker's manual cycle time of a particular operation might cause overproduction. Because the decomposition identifies this potential problem, it can be averted. The worker can be reallocated to another task where he can create value.
Kaizen has been cited to improve systems radically over time. In one case, kaizen activities led to a productivity improvement of over 990 percent [Womack, Jones, 1996]. Even though the figure sounds sensational, similar figures have been reported elsewhere. Truly, it is amazing what these continuous
improvements can do.
Kaizen can affect every activity in the production system. Figure 2-10 below illustrates the many aspects that kaizen embraces. Quality circles can capitalize on several workers' knowledge and talents and can facilitate brainstorming for improvements.
Figure 2-10: The Kaizen Umbrella [Imai, 1986, p. 4]
Customer orientation
TQC (total quality control)
Robotics
Oc circles
Suggestion system Automation
Discipline in the workplace TPM
(total productive maintenance)
* Kamban * Quality improvement * Just-in-time * Zero defects * Small-group activities * Cooperative labor-management relations Productivity improvement * New-product development
Chapter 3
High
Level DP's (Level 1, Level
2, Level 3)
Section 3.1 Introduction
The top level FR/DP's are the roots of an expansive decomposition tree. They form the basis for the design of the entire system. They are relatively
generalized because the decomposition is applicable to all production systems. This chapter discusses at length these FR/DP relationships and the matrices that
make the implementation order path dependent. These upper level FR/DP's are shown in Appendix A.
Section 3.2 Decomposition of Level One
The decomposition starts with definition of the customer domain. The
stakeholders (stockholders, customers, community, employees, and suppliers) have primary objectives that must be satisfied. The stockholders want a prescribed profit margin to be met and a particular value for their return on investment. The customer requires a useful product at a reasonable price with predictable delivery and quality, as well as sufficient capacity to accommodate flexibility in desired order volume and product variety. The community wants a responsible corporation that considers its effects on people and the environment. Employees want a workplace that values their contributions. Suppliers need sufficient communication with the management to prepare for the
accommodation of the orders. These issues are considered to be the primary considerations in the customer domain and are shown in Figure 3-1.
Figure 3-1: Stakeholders of a Manufacturing System [Cochran, Lima, 1998]
The next step is the formulation of the central FR, the main goal that is to be achieved. The main objective of a business is to realize its self-prescribed investment goals. This translates into the functional domain as FR1, maximize long-term return on investment. The other previously mentioned customer attributes are also critically important, but if the corporation cannot survive in the market, it cannot satisfy any of these requirements.
To determine the corresponding DP, we must ask, "How do we want to achieve this FR?" The intent of this decomposition is to have a manufacturing system that maximizes the long-term return on investment. A manufacturing system consists of the equipment, materials, and people required to perform value-added actions to raw materials and component parts, and is characterized by quantitative parameters such as throughput time, percent on-time delivery, and percent defective finished goods [Black, 1991]. The production system is the structure that supports the manufacturing system, including operations such as marketing and engineering. The relationship between the manufacturing and
apropos to consider the design parameter to be the production system design; however, the scope of this decomposition does not cover certain aspects like marketing and other support functions. This decomposition centers upon activities on the shop floor and the information system required. The DP1, manufacturing system design, emphasizes that the structure of the system should not be left to chance or to evolve based on accounting measures.
"[Firms'] strategies must be clearly focused and their operations tightly organized. Anything less is tantamount to a concession of defeat." [Hopp, Spearman, 1996, p. 15] The relationship between FR1 and DP1 is shown in Figure 3-3.
Figure 3-2: Manufacturing and Production Systems [Cochran, Lima, 1998]
It is important to note that there are many other available DP's that satisfy our main FR; it is conceivable to choose DP's that achieve FR1 in other ways, such as investing in the stock market or in other industries. Choosing a manufacturing system is the choice of the corporate management. The manufacturing system chosen might be not have the highest Return on Investment (ROI) in the
traditional sense, but when part of a corporate strategy such as capturing market share, it could be the most beneficial. Other business strategies that employ production systems that do not yield the highest profits are related to the
replacement part sales market. Base product production might not result in large profits; however, the spare part market may be highly lucrative. Examples of these industries include razors and jet engines.
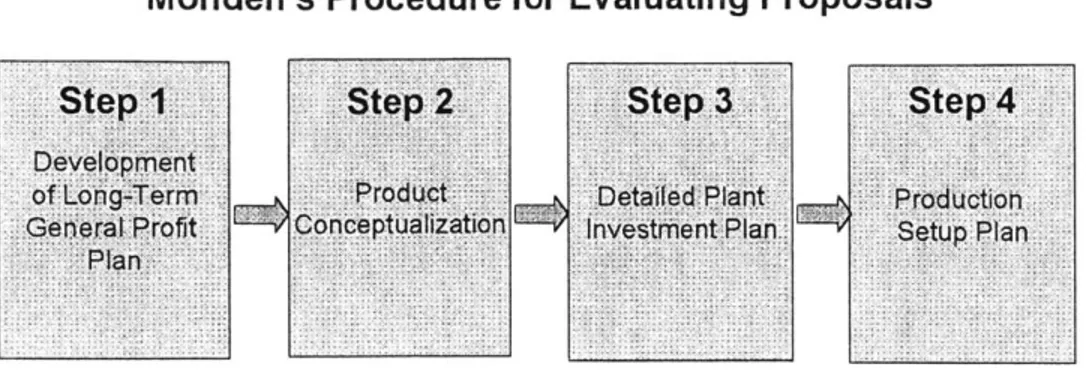
Yasuhiro Monden (1994) has developed a four-step method of evaluating manufacturing system proposals. The first step is the development of a long-term general profit plan which has capital expenditures broken down annually. Guidelines are developed for investments of each product line. In the second step, the product conceptualization step, target costing is performed by establishing a sales price, volume of products, and level of plant investment capital. Step three is the establishment of a detailed plant investment plan. The last step is production setup which consists of all the prototyping, setup of
equipment, and supplier selection. Although his method is sound, it does not necessarily ensure that all of the guidelines are met. Instead of asking, "What do we want?" and "What do we need?" it centers more on "What can we afford?" Thus, the approach does not promote the same level of creative thinking that finds ways of making the fantastic affordable.
Figure 3-4: Alternate Methods of Evaluating Proposals
Monden's Procedure for Evaluating Proposals Stepi
of Lon-Te&rmt
G e a I r'o f)ti a ice z-u -ata
Step 3
Section 3.3 Decomposition of Level Two
The first step forming Level Two is decomposing DP1, manufacturing system design, into sub-FR's. These FR's are as follows: FR1 1: Maximize sales
revenue; FR12: Minimize production costs; and FR13: Minimize investment over production system lifecycle. DP's are chosen for each of these FR's and these relationships are illustrated in Figure 3-5.
Figure 3-5: Top level decomposition
DPI Manufacturing System Design DPII Production to maximize customer DP12 Elimination of non-value adding sources DP13 Investment based on a long term system Step'k4 Stup P, an.
The three FR's chosen are associated with maximizing the cost-effectiveness of the system design. The system will satisfy DP1 with respect to FR1 by
maximizing the profits of the system by increasing sales and decreasing costs. Again, this is dependent on the corporate strategy. For example, if the
manufacturing system is designed for products that have short lives with similar subsequent generations, flexibility, which might incur higher investment costs, would be a priority. The value of flexibility could over-shadow slightly higher production costs. It is paramount to always keep the contents of the customer domain in mind when selecting a system.
The decomposition of FR1 1 results in DP1 1: Production to maximize customer satisfaction. Increasing sales revenue can be achieved in many ways including increasing sales price, increasing market share, and producing multi-function parts. The selected DP focuses on fulfilling the customer's criterion for a product. By successfully implementing the Customer Domain into the design of the
system, satisfaction will be maximized. This result stresses the importance of a thorough assessment of the customer wants. "The utility of an object, like its value, inheres not in the object itself but the regard a person has for it."
[Thuesen, Fabrycky, 1993] If customers are not satisfied, there will be no return business and negative word-of-mouth could eliminate new clientele.
Decomposing FR12 leads to DP12: Elimination of non-value added sources of cost. Over-design has to be eliminated; product design must void superfluous product features that do not add value to the customer and drive up the
production cost. To make operations as profitable as possible, it is necessary to strip away all forms of waste, such as waste from overproduction, waiting,
excessive transportation, unnecessary processing, inventory, wasted motion, and defects. [Shingo, 1989] Figure 3-6 shows the relationship between waste and value. Costs associated with administrative operations must also be minimized since they add no value to the system itself.
Figure 3-6: The Relationship Between Waste and Value [Cochran, Weideman, 1998]
The decomposition of FR13: Minimize investment over production system lifecycle results in DP13: Investment based on a long-term system strategy. When designing a new production system, investment decisions are made after many of the system decisions have been resolved. This is not always practiced because of long lead times associated with equipment purchase. It is important to identify the factors that affect the investment decisions and fully contemplate them before committing to the purchase of system components. Also critical is the definition of value in the accounting department. The least expensive option
might not be the best; it could lack valuable flexibility and growth potential. The "real" system value of all proposals should be ascertained.
"Investment based on a long term strategy" refers to the need to consider the cost over the life of the production system instead of just the initial cost. Life cycle cost is all recurring and nonrecurring costs that are encountered during the life cycle [Thuesen, Fabrycky, 1993, p. 28]. Depreciation of the system should
be examined as well as reusability of equipment. "Make or buy" strategies, as well as product lifetimes, should be weighed at this level.
The implementation of this DP is highly dependent on the corporate strategy. For example, a product can be introduced into a manufacturing system with a short product-life before the next generation is released. The initial investment for the first product might not produce a profit, but the subsequent version of the part might have a large profit margin, due to a large established market and the reusability of the machines. In many cases, the cost associated with adding simple features to a previously designed product is lower than the cost of the initial design due to the learning factor. The sunk cost of the first generation is
irretrievable; therefore, it is best to make the system as flexible as possible.
Due to fluctuations in the market, many corporate policies value flexibility.
Flexibility ensures that the customer domain, a dynamic entity, is satisfied. There are four types of flexibility: ability to accommodate short-term volume changes; the flexibility of product variety; accommodation of capacity increments at the
lowest possible cost; and adaptability for future products.
One method that embraces the flexibility philosophy is the cellular manufacturing system. Cells can be operated at different takt times to enable short-term
volume fluctuation. Figure 3-7 illustrates the ability of cells to meet volume fluctuation. They are composed of nonspecific, right-sized, easily rearrangeable machinery that can be utilized in the production of new products. These
machines can be reconfigured easily to increase product variety. Cells can be added or subtracted to accommodate the need for capacity increments.
Figure 3-7: Example of Cell Design to Meet Volume Fluctuation in Throughput Time [Cochran, Lima, 1998]
One loop... CT= I 7 seconds
Other corporate strategies do not embrace the idea of flexibility. In certain cases, a high volume process with few product changes over a long product lifecycle would not need to invest in a production system with flexibility. This situation is a risk that they are willing to incur because they are extremely confident that the market will remain stable and that they will not need to update their products.
Each business strategy must determine its key factor, then design the systems accordingly.
One guideline that is true regardless of design strategy is to avoid complicated systems that incur large costs, if possible. It is better to rearrange machines and
change operating procedures than to develop highly specialized machinery to perform the difficult tasks. Whenever considering automation, the manual operations should be optimized first and if those improvements are not
substantial enough, then automation can be considered. The development of mechanization is facilitated by making the processing as ergonomically sound as possible. "If it is waste, do not automate it; if it is automation, do not waste it, "is
the correct approach to automation. Suzaki (1987) advocates the creative use of automation; if it is used in the same manner as the competition, there is no gain in capacity. Small improvements like automatic loading can yield large returns.
Another guideline is to carefully research the market forecast for the products to be manufactured and plan for capacity requirements accordingly. With the
volatile nature of today's market, it is essential to be responsive to market drivers. Capacity can vary seasonally and with time as the product's life increases. The system should have the flexibility to increase its capacity incrementally at the lowest cost. When considering a manufacturing system, it is important to see where its successful operation limits are and if necessary, to have a backup plan when the forecast does not match the actual demand.
Because of the many different investment strategies possible, it is not possible to further decompose DP13 simply. The set of possible investment strategies does
not have common key characteristics that could be examined through
decomposition. If a more specific strategy were to be presented, decomposition could proceed, but then the capability to be applicable to all strategies would be jeopardized.
The design matrix at level two is shown in Equation 3-1. This decoupled matrix is path dependent; the order of implementation is DP1 1, DP1 2, and DP1 3. The dependence stems from the interdependence of the DP's. DP1 1: Production to maximize customer satisfaction affects all of the FR's because it is related to the production costs and the investment costs. Figure 3-8 shows a relations diagram that illustrates the association of manufacturing techniques and waste
elimination. DP12: Elimination of non-value adding sources of cost is related to investment strategies that add cost to compensate for future (uncertain) capacity requirements; therefore, there is an X in the A32position.
Equation 3-1
IFR11rX
FR12= X FR13 LXFigure 3-8: Techniques and Their Relationship Towards Eliminating Waste [Suzaki, 1993, p. 379]
Section 3.4 Decomposing to Level Three
The third level of the decomposition formulates the roots for the branches of the tree: quality, identifying and resolving problems, predictable output, delay
reduction, direct labor, and indirect labor. These FR/DP relationships shape the focus of the rest of the tree; production philosophies are shaped here.
0 x x 0 DP111 0 DP12 X DP13
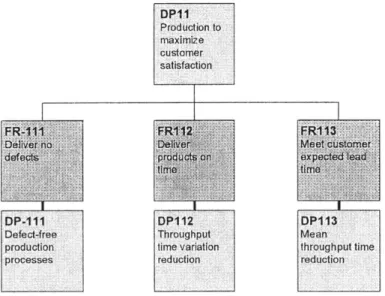
Section 3.4.1 Decomposition of FR/DP1 1
One of the DP's being decomposed from level two is DP1 1: Production to maximize customer satisfaction. Customer expectations include defect-free products (FR111), on time products (FR112), and responsive lead times (FRI 13). These criteria are the external quality of a product, an assessment based on customer opinion rather than the manufacturing definition of quality. This external quality must be translated into internal quality to insure that the items in the customer domain are fulfilled. These FR's are shown in Figure 3-9. All of these FR's are associated with aspects of quality and time.
Figure 3-9: Decomposition of FR/DPi 1
DP1 1 Production to maximize customer satisfaction Bali DP-111 Defect-free production processes DP112 Throughput time variation reduction Meet comr DP113 Mean throughput time reduction
FR1 11: Deliver no defects implies that defects might be produced, but they will not be shipped to the customer. Thus, the system can either make perfect quality parts all the time or have quality checks throughout the system to catch the defective parts. Repair loops should not be allowed in the system; they take up floorspace and convey the philosophy that production of defects is to be expected.
There are two types of inspections: vertical and horizontal. Vertical source inspections attempt to regulate upstream processes when they are the root of the defect. Horizontal source inspection is the detection of defect sources within the process at hand. The lean technique of manufacturing advocates the elimination of waste; therefore, the lean system should attempt to attain Zero Defects. The slogan of the shop floor should be "make one, check one, pass one."
An acceptable quality level is a commitment before we start the job that we will produce imperfect material" [Crosby, 1980, p. 146] By performing one-hundred percent inspection of the finished goods at a final inspection point, we are escalating costs by having dedicated quality personnel, reducing the accountability of the worker for his errors, and increasing the risk of defects passing into the hands of the customer since there is only a minimal number of personnel checking the quality levels. As time interval from the commission of defect occurs, the cost associated with it increased as shown in Figure 3-10.
In-line inspections, self-inspection and successive inspection, can be implemented; however, they have their limitations. Self-inspection can be maleffected by operator judgement and pride. Successive checks are dependent upon the alertness of the workers, willingness to identify errors (potentially damaging operator relationships in the line), or interpretation of standards. Detecting defects should not be solely an operator task; the system should prevent these defects. Thus, measures should be implemented at the onset that enable Zero
Defects and erase the mentality that defects are to be expected. The way this is accomplished is by DP-1 11: Defect-free production processes.
Figure 3-10: Identifying Defects at the Source Lowers Costs [Suzaki, 1987, p 99]
Defects Own Next End of Final End user's
Found at: Process Process Line Inspection hand
Cost to
the Company:
Impact to 0 Very 9 Minor * Rework 0 Significant 0 Warranty cost
the Company: minor delay rework
* Reschedule * Delay in e Administrative
of work delivery cost
* Additional e Reputation
inspection
* Loss of market
share
Customers value on-time delivery now more than ever. With many companies employing Just in Time (JIT) techniques to their production, it is essential to maintain deliveries according to the customer's schedule. The order should not be accepted if the delivery due date is unreasonable because the customer will not be satisfied. Therefore, it is essential to fulfill FR1 12: Deliver products on time in order to be competitive. The foremost reason that delivery dates are missed is variation in throughput time. Throughput time is the duration between receipt of order and shipment of finished goods. If the system were completely predictable, the delivery date would always be known and achievable. Changes in the amount of variation in the system can result in the shifting of the mean throughput time. This relationship is shown in Figure 3-11. The selected DP: Throughput time variation reduction targets the effect of variation on the system.
Figure 3-11: The Relationship between Variation and Mean of Throughput Time
ilX2 X3
Tmin Tmin Tm
As the variance in throughput time changes, so does the mean.
Customer Lead Time is defined as the time interval between the placement of the order and receipt of finished goods. FR1 13: Meet customer expected lead time requires that the production system be responsive to the needs of the customer. Today's customer is reducing the inventory in his own system; he needs a supplier that can meet his order requirements, even if there is not much notice. Therefore, meeting delivery deadlines is not sufficient; lead times must be minimized to satisfy even the shortest-notice orders.
In order to meet the customer expected lead time, DP1 13, mean throughput time reduction, is chosen. It ensures that the average time in which the customer receives his shipment occurs on-time or within the acceptable on-time window. First, it is essential to minimize the administrative lead time. This is not in the scope of this decomposition, but it is important not to neglect this important step. There are two central methods to reduce the production system lead time,
Figure 3-12: Reduction of Throughput Time
Time
L Customer expected lead
time
Administrative lead time Manufacturing response time
Manufacturing throughput time
Customer expected lead time can be met by either:
- Decreasing manufacturing response time by adding finished goods inventory
- Decreasing manufacturing throughput time and make-to-order
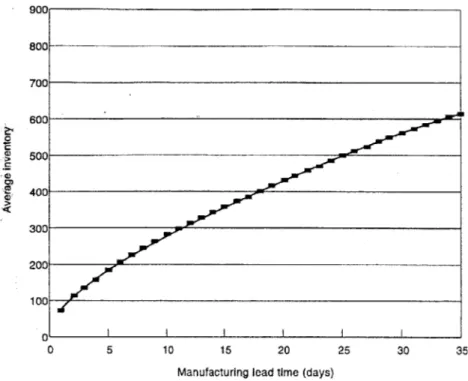
One of these options is to decrease the manufacturing response time by maintaining a finished goods inventory. This alternative is counter to the lean approach to manufacturing and requires a demand forecast, which is unstable. This make-to-stock technique requires a level of finished goods for most of its product line, which is associated with a holding cost. Figure 3-13 shows that manufacturing lead time (the time for one part to pass through the manufacturing system) increases as the average inventory level increases. Defect-detection can be impaired if there is a large level of WIP in the section. The consolidated
item number system involves an inventory of intermediate-level parts that require only small procedures to be completed. An example of this is the Ethan Allen
Furniture Company, which maintains a level of inventory of unfinished furniture that requires only a painting operation [Vollman, Berry, Whybark, 1997, p. 209].
A similar method is assemble-to-order which involves a certain level of
Figure 3-13: Average Finished-Goods Inventory versus Manufacturing Lead Time 900 800 700 600 00 400 00 200 100 0 0 5 10 15 20 25 30 35
Manufacturing lead time (days)
Source: S. N. Chapman, "Schedule Stability and the Implementation of Just-in-Time," Production and Inventory Management 31, no. 3 (1990) [Vollman, 1997p.491]
The other option is to decrease the manufacturing throughput time and employ a make-to-order system. This approach embraces lean thinking and embraces Just In Time (JIT) concepts. The ideal is to approach zero lead time which is one of the "seven zeros", the goals of JIT system. [Edwards, 1983] This is only
feasible if the production system is stable and predictable. When variations occur in the system, the system will not meet its target production time. All factors that cause delays in the system must be minimized. If defects are made,
the time and money spent on producing that part is lost; rework, when possible, adds cost and time to the system that cannot be compensated. Production delays, including delays due to run size, process, lot, transportation, and systematic operational delays, must be reduced as much as possible.
Design matrix of FR/DP 111 - 113
The design matrix for FR/DP1 11-113 is decoupled as seen in Equation 3-2. When defects are produced, the throughput time is increased, which is related to FR1 12. If these defects occur in a stochastic manner, the variation of throughput time is affected (FR112). Thus, DP-1 11 influences all of these FR's. DP1 12 and DP1 13 do not have any relationship with quality since they both deal with time which has no impact on quality (just because something is on-time does not mean that it is of high quality); therefore, DP11 and DP12 are associated with FR1 1. If all variation is eliminated, there is a constant minimum throughput time.
FRI111 X 0 0 DP111
Equation 3-2 FR112 X X 0 DP112
LFR113
LX
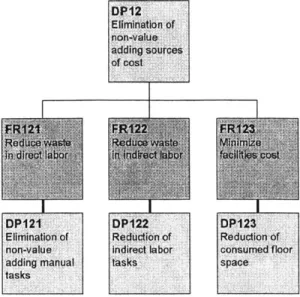
X X DP113Section 3.4.3 Decomposition of FR/DP12
In order to eliminate of non-value adding sources of cost (DP12), we must reduce waste in direct labor (FR121), reduce waste in indirect labor (FR122), and
minimize facilities costs (FR1 23). The other forms of waste that incur cost are being discussed in previous branches of the tree; therefore, it would be
redundant to visit them again under this branch. Figure 3-14 shows the decomposition through this level.
![Figure 3-1: Stakeholders of a Manufacturing System [Cochran, Lima, 1998]](https://thumb-eu.123doks.com/thumbv2/123doknet/14744461.577698/30.918.207.721.192.499/figure-stakeholders-manufacturing-cochran-lima.webp)
![Figure 3-7: Example of Cell Design to Meet Volume Fluctuation in Throughput Time [Cochran, Lima, 1998]](https://thumb-eu.123doks.com/thumbv2/123doknet/14744461.577698/37.918.224.699.190.515/figure-example-cell-design-volume-fluctuation-throughput-cochran.webp)
![Figure 4-7: PDCA Cycle [Imai, 1997]](https://thumb-eu.123doks.com/thumbv2/123doknet/14744461.577698/56.918.275.690.579.1000/figure-pdca-cycle-imai.webp)