HAL Id: hal-02592011
https://hal.inrae.fr/hal-02592011
Submitted on 15 May 2020
HAL is a multi-disciplinary open access archive for the deposit and dissemination of sci-entific research documents, whether they are pub-lished or not. The documents may come from teaching and research institutions in France or abroad, or from public or private research centers.
L’archive ouverte pluridisciplinaire HAL, est destinée au dépôt et à la diffusion de documents scientifiques de niveau recherche, publiés ou non, émanant des établissements d’enseignement et de recherche français ou étrangers, des laboratoires publics ou privés.
Water value and demand for multiple uses in the rural
areas of South Africa: The case of Ga-Sekororo
P. Kanyoka
To cite this version:
P. Kanyoka. Water value and demand for multiple uses in the rural areas of South Africa: The case of Ga-Sekororo. Environmental Sciences. 2008. �hal-02592011�
!"
" # $
%
&
'
$
(
$
)
* )+
,
(
-.
/001
CemOA : archive ouverte d'Irstea / CemagrefI, Phillipa Kanyoka declare that the thesis/ dissertation, which I hereby submit for the degree MSc: Agricultural Economics at the University of Pretoria, is my own work and has not been previously submitted by me for a degree at this or any other tertiary institution. Signature: P.Kanyoka Date: 15/07/08 CemOA : archive ouverte d'Irstea / Cemagref
(
To my daughter and my husband, Celine and Wellington, who endured times of loneliness during the tiring moments of preparation of this document.
CemOA
: archive
ouverte
d'Irstea
2
$
As in any task, I am indebted to a number of people who improved this thesis in many different ways. Firstly I would like to thank my supervisors Dr Stefano Farolfi and Dr Sylvie Morardet for their valuable comments and guidance on this thesis. I know as supervisors, you had to forgo other obligations to attend to this thesis.
Special thanks to International Water Management Institute (IWMI) and the Franco0 South African SAFeWater ARISE project who through Dr Morardet and Dr Farolfi funded this work. Without their support this work would not have been possible. I also want to acknowledge and thank the Collaborative Masters Program in Agricultural and Applied Economics (CMAAE) for their financial support.
I would like to extend my sincere and heartfelt gratitude to Dr Lindiwe Majele Sibanda, the Chief Executive Officer of FANRPAN (and the FANRPAN team) for providing mentorship during my internship and throughout my MSc program.
I would like to extend my gratitude to Amy Sullivan for helping with planning the focus group discussions. Thanks to Barbara van Koppen for her comments and logistical support during the field work. I also wish to express my gratitude to Bafana Ngwenya (IWMI) and Christian Cheron (IWMI) for their assistance especially during the field work. No words can best express my gratitude to the households in Sekororo0 Letsoalo area, World Vision office (Kodumela) for their assistance and cooperation in the field work. I would like to thank the enumerators (MSc student from University of Limpopo) who assisted in data collection.
My friends – Sinqobile and Sisa Chumi, Leah Ndanga, Dabson and Onita Kanyoka 0 I thank you very much for your invaluable support (especially by taking care of my daughter when I went to do my field work and other social support you offered) which made the task of completing my studies ever more manageable. To my brothers and sister; Dabson, Innocent, Brian and Rose Kanyoka, thanks for your love and support. Lastly, I would like to thank Wellington Jogo for taking his time to comment on my work as well as taking care of our daughter during the course of this work
May the good Lord bless you all! Phillipa Kanyoka CemOA : archive ouverte d'Irstea / Cemagref
( $ : MSc Agric
( : Agricultural Economics, Extension and Rural Development 3 : Dr Stefano Farolfi
4 3 : Dr Sylvie Morardet
The provision of free basic water for domestic uses and a more equal distribution of water for productive uses are seen as important instruments to redress inequities from the past and eradicate poverty in South Africa (SA). Although the government committed itself to providing free basic water for all, this result is still far to be reached, particularly in rural areas. Financing of multiple use water services was identified as an important ingredient to insure improved access to water for rural poor in SA and at the same time allow productive uses and broaden livelihood options. Recent evidence indicated the potential contribution that productive uses of domestic water might make to food security and poverty reduction in rural areas of SA. Following the principles of integrated water resource management (IWRM), efficient, equitable and sustainable investment in improved water services should be demand driven, that is, it should be based on a thorough understanding of effective demand by consumers for multiple use water services. The assessment of demand for improved water services provides the basis for micro level analysis of consumer benefits from multiple water uses. Such studies are not common in SA’s rural areas, where most of the economic analyses focus on either domestic or irrigation water demand. This study attempts to fill this gap by assessing the household demand for multiple use water services in Sekororo0Letsoalo area in the Limpopo Province. Choice modelling is the approach used to identify the attributes determining demand for water services and quantify their respective importance. Households are presented with alternative sets of water services, corresponding to different levels of the attributes. In this study, the following attributes were used: water quantity, water quality, frequency of water supply, price of water, productive uses of water, and source of water. Choice modelling allows estimating the relative importance of these attributes for various strata of the studied population, and ultimately provides a measure of the willingness to pay for different aspects of water demand (attributes), including productive water uses. Results show that households in rural areas are willing to pay for water services improvements. Due to the poor quality of present water services in the area, users are primarily concerned with basic domestic uses and demand for non domestic water uses is low. Only households already relatively well served are interested in engaging in multiple water uses.
CemOA
: archive
ouverte
d'Irstea
! " 1.0 Introduction ... 1 1.1 Research Questions ... 4 1.2 Research Objectives ... 4 1.3 Research Hypothesis ... 5 # $ % & ' ( ' 2.0 Background of the study site... 9
2.1 Socio demographic characteristics of the study area ... 10
2.2 Infrastructure and water access ... 15
) &* + &* 3.0 Introduction ... 20
3.1 Review of empirical literature on demand for domestic water services ... 20
3.1.1 Travel cost method (TCM)... 21
3.1.2 Contingent valuation method (CVM) ... 22
3.1.3 Choice modelling (CM) ... 27
3.2. Determinants of water demand ... 30
3.3 Conclusion... 32
# )# , ! )# 4.0 Introduction ... 34
4.1.1 Comparative advantages of CM and CVM approaches ... 34
4.1.2 Theoretical base of CM: the random utility theory ... 35
4.2 Empirical Framework... 37
4.2.1 Choice of the econometric model... 37
4.2.2 Characterisation of household water sources and uses and livelihood typologies ... 38
4.3 Data sources and data collection techniques ... 39
4.3.1 Secondary data ... 40
4.3.2 Focus group discussions... 40
4.3.3 Choice experiment design ... 44
4.3.4 Household Survey ... 47 - -CemOA : archive ouverte d'Irstea / Cemagref
. / /
-5.0 Introduction ... 51
5.1 Household Characteristics... 51
5.2 Characterisation of water uses and users... 63
5.3 Summary of findings... 83
0 1-. ( 1-6.0 Introduction ... 85
6.1 Conditional Logit Model (CLM) Results... 85
6.1.1 Preferences for water services of households with and without private tap .... 87
6.1.2 Preferences for water services of households with and without private taps... 88
6.1.3 Household’s water consumption and preferences for water services ... 91
6.1.4 Household’s income and preferences for water services ... 94
6.2 Determinants of household water services choice ... 95
6.3 Summary of results... 98
% '' / ! ( 2 + '' 7.0 Introduction ... 99
7.1 Summary of findings... 99
7.2 Conclusions, Policy Insights and Recommendations... 101
7.3 Areas for Further Research ... 102
+ *# 3 4 ( * & 3 & 3 & -)35 ( 1 CemOA : archive ouverte d'Irstea / Cemagref
3
Table 1. 1 Linkages between research objectives, research questions, hypotheses and
analytical tools used ... 6
Table 2. 1: Population of the 14 villages in 2002 and distance from the mountains ... 12
Table 2. 2 : Employment status of potentially active population in wards 1 to 5 of Maruleng municipality ... 12
Table 2. 3: Distribution of employed people per industrial sector in wards 1 to 5 of Maruleng Municipality... 13
Table 2. 4: Distribution of households on the basis of main sources of income in Kodumela and Enable ADP areas ... 14
Table 2. 5: Distribution of households per class of annual income in wards 1 to 5 of Maruleng Municipality... 15
Table 2. 6.: Distribution of households per class of annual income in Kodumela and Enable ADP areas... 15
Table 2. 7: Distribution of households per ward and access to water services in the study area ... 17
Table 2. 8: Multiple uses of water in Kodumela and Enable ADP areas ... 19
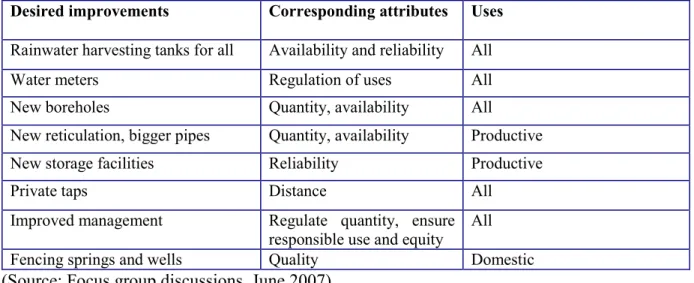
Table 4. 1 Summary of desired improvement and attributes of water services in Sekororo0 Letsoalo area ... 43
Table 4. 2: Attributes and levels used in the Sekororo0Letsoalo choice modelling study46 Table 4. 3: Characteristics of selected villages ... 48
Table 4. 4: Sample stratification ... 48
Table 4. 5: Size of the sample and representativeness of the mother population ... 50
Table 5.1: Mean household size in the study area... 52
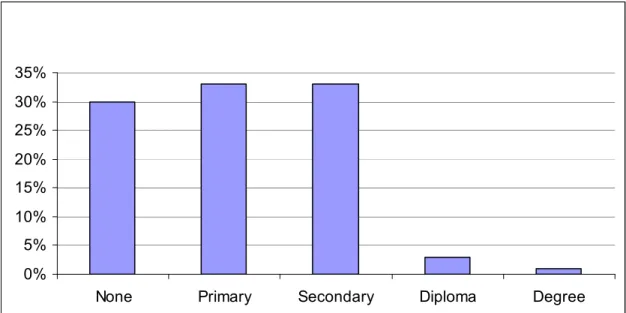
Table 5.2: Gender and position in the household of the respondent ... 53
Table 5.3: Occupation of the household head ... 54
Table 5.4: Distribution of households per class of monthly income (in Rands) from Census (2001) and Malatji and Nyalungu surveys (2005)... 56
Table 5.5: Distribution of monthly household income in Sekororo0Letsoalo area ... 56
Table 5.6: Distribution of monthly household income across sources per income classes in Sekororo0Letsoalo area ... 57 Table 5.7: Distribution of annual household income across sources per income classes . 58
CemOA
: archive
ouverte
d'Irstea
Table 5.8: Distribution of household income and poverty across villages in Sekororo0
Letsoalo area ... 60
Table 5.9: Number of water services across villages ... 65
Table 5.10: Number of surveyed household per water sources and village... 66
Table 5.11: Distribution of surveyed households per frequency of water supply and village ... 67
Table 5.12: Distribution of surveyed households per frequency of filling containers with water ... 68
Table 5.13: Distribution of surveyed household per daily household water consumption and per village ... 69
Table 5.14: Proportion of surveyed households with irrigation plots or communal gardens by village ... 75
Table 5.15: Proportion of surveyed households paying for maintenance of water system by village ... 75
Table 5.16: Average payment for private connection to public water network for connected households... 76
Table 5.17: Date of construction of main water infrastructures in sampled villages... 78
Table 5.18: Descriptive Statistics for monthly electricity bill (in Rands)... 81
Table 5.19: Correlation matrix ... 83
Table 6. 1: Comparison of households with and without private taps ... 87
Table 6.2: CLM Results of Stratum 1. Households without private taps... 89
Table 6.3: CLM Results of Stratum 2. Households with private taps... 89
Table 6.4: Sub0stratum 1a. Households without private tap and lower water consumption ... 92
Table 6.5: Sub0stratum 1b. Households without private tap and higher water consumption ... 92
Table 6.6: Sub0Stratum 2a. Households with private tap and lower water consumption . 93 Table 6.7: Sub0stratum 2b. Households with private tap and higher water consumption 93 Table 6.8: Water source and socio0economic factors for poor and non poor households 94 Table 6.9: Sub0stratum 1c. Households without private tap and lower income... 95
Table 6.10: Sub0stratum 1d. Households without private tap and higher income ... 95
Table 6.11: Importance of water service attributes across household strata based on water source (proportion of households in each stratum considering the attribute as important) ... 97
Table 6.12: Importance of water service attributes across villages (proportion of households in each village considering the attribute as important) ... 97
Table 6. 13: Importance of water services attributes across gender (proportion of respondents considering the attribute as important)... 98
CemOA
: archive
ouverte
d'Irstea
3
& $
Figure 2. 1: Geographical location of the study site ... 10 Figure 2. 2: Number of households with and without private tap per ward in the study
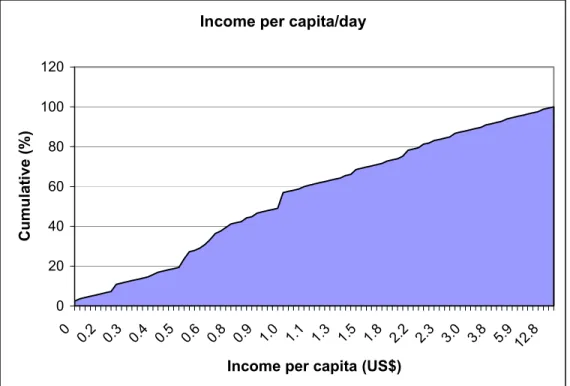
area in 2001 ... 18 Figure 5. 1: Distribution of interviewed household head per education level ... 53 Figure 5. 2: Distribution of households per class of monthly income in Sekororo0Letsoalo area ... 55 Figure 5. 3a: Cumulative distribution of households per income per capita per day... 59 Table 5.3b: Lorenz curve showing distribution of income across households…………..59 Figure 5. 4: Distribution of household by status of income earner ... 61 Figure 5. 5: Distribution of households per status of members collecting water... 62 Figure 5. 6: Proportion of households with and without private taps in Sekororo0Letsoalo area ... 63 Figure 5. 7: Distribution of surveyed households per number of water sources... 64 Figure 5. 8: Sources of water for households in Sekororo0Letsoalo area. ... 65 Figure 5. 9: Distribution of surveyed households per daily household water consumption ... 69 Figure 5. 10: Cumulative distribution of surveyed households by per capita daily water consumption ... 70 Figure 5. 11: Distribution of surveyed households according to their perception about water quality... 71 Figure 5. 12: Proportion of surveyed households using water for non domestic uses
(Multiple uses) per village 72
Figure 5. 13: Proportion of surveyed households using water for multiple uses according to their frequency of water supply... 72 Figure 5. 14: Proportion of surveyed households using water for multiple uses according to their household daily water consumption ... 73 Figure 5. 15: Proportion of surveyed households per types of productive uses of water and villages... 74 Figure 5. 16: Households using water for multiple uses by water consumption ... 74 Figure 5. 17: Cumulative distribution of surveyed households according to amount paid for connection to the DWAF/Municipal water network ... 78 Figure 5. 18: Proportion of surveyed households privately connected to the
DWAF/Municipal network per period of connection ... 79
CemOA
: archive
ouverte
d'Irstea
4
5
$
1.0
Introduction
South Africa is a semi arid country with a mean annual rainfall of about 500mm, which is only 60% of the world average (Schulze et al., 1997). The rainfall is poorly distributed spatially and temporarily. About 65% of the country receives rainfall below 500mm and droughts are a major threat in most parts of the country (DWAF, 2005). Over most of the country the average annual potential evaporation exceeds annual rainfall, which limits available surface water resources. These climate characteristics coupled with poor groundwater resources limit the supply of water resources in South Africa.
Water scarcity is considered to be a major constraint to socio0economic development in South Africa (DWAF, 2003). In most parts of the country water resources are already fully utilized or overdrawn. The agricultural sector is the highest consumer of water accounting for about 62 % of the total water consumed while domestic and industry water use account for 6% and 32% respectively (AQUASTAT, 2005).
Following the principles of integrated water resource management (IWRM), the efficient and equitable allocation of the water resource involves important trade0offs between different potential users and their rights. At the projected population growth and economic development rates, it is unlikely that the projected demand for water resources will be met by 2009 and there will be increased competition among water users for the scarce resource. High pollution levels of surface and groundwater resources due to industrial effluents, domestic and commercial sewerage and agricultural runoff have worsened this situation (WSDP, 2003).
CemOA
: archive
ouverte
d'Irstea
The domestic water sector in South Africa is characterised by significant inequities in terms of access to water inherited from the apartheid era policies of ‘separate development’. However, after end of apartheid, several institutional and policy reforms were undertaken to address the inequalities. The Water Services Act of 1997 and the National Water Act of 1998 provide the legislative framework for water services and water resource management respectively (Republic of South Africa, 1997; Republic of South Africa, 1998). Since 1994, the national government has been committed to its Reconstruction and Development goals, one of which was to improve basic water services as well as to improve levels of services over time. The Water Services Act decentralized the provision of water and sanitation services for domestic purposes to local governments with financial and technical support from provincial and national governments. Also, under this Act, provision of free basic water and sanitation services for all end users is compulsory.
The provision of free basic water and a more equal distribution of water for productive uses (i.e. irrigation, mining, and industry) are seen as important instruments to redress inequities from the past and eradicate poverty in SA (Republic of South Africa, 1997). At present, the government has committed itself to ensuring that all people will have free access to at least 25 litres per capita per day of clean water (DWAF, 2005). However, the provision of free access to basic water services for all the users is still a major challenge for the water sector (DWAF, 2003). At the same time, the SA public sector is investing in infrastructures and management skills aimed at providing higher levels of water services, particularly in less advantaged areas. This effort proved to be more difficult for rural municipalities located in former homelands, due to inadequacy of human capital to plan, manage and control the water service infrastructure and lack of appropriate financial means.
Free provision of water above the basic level is not without risk, as, if not carefully controlled and managed, it would place unsustainable demands on the financial resources of local and central governments. An option to make financially viable the increased and improved water services in rural areas could come from the partial coverage of the
CemOA
: archive
ouverte
d'Irstea
investment and operating costs determined by these services through the introduction of user fees. In fact, the raising of revenue from consumers is central to cost recovery of current investments and future up0scaling of water services (Goldblatt, 1999).
Financing of multiple use water services has been identified as an important ingredient for ensuring improved access to water for rural poor and at the same time accommodating for productive uses and broaden livelihood options for the poor in South Africa (Lefebvre et al., 2005; Hope et al., 2003, Van Koppen et al., 2006). Recent evidence has indicated the potential contribution that productive uses of domestic water might make to food security and poverty reduction in rural areas of South Africa (see Pérez de Mendiguren Castresana 2004; Hope et al., 2003; Hope and Garrod, 2004). Efficient, equitable and sustainable investments in improved domestic water services should be demand driven, that is, they should be based on a thorough understanding of effective demand by consumers for multiple use water services (both domestic and productive uses) (Whittington et al., 1998). The assessment of demand for improved domestic water services provides the basis for micro level analysis of consumer benefits from multiple water uses. Such studies are not common in South Africa’s rural areas and most of the studies to date focus on either domestic water uses (e.g. Banda et al., 2006) or irrigation water use (Nieuwoudt et al., 2004). This study attempts to fill this gap by assessing the household demand for multiple use water services in Sekororo0Letsoalo area (Maruleng municipality, Limpopo province), located in the Olifants River Basin. This site has been chosen for this research because it is the site of a project on Multiple Use Water Services (MUS) led by the International Water Management Institute (IWMI).
This study aims at describing water users and uses in Sekororo0 Letsoalo area. A choice modelling (CM) approach (or Choice Experiments, as the method will alternatively be named later on in this thesis) is applied to elicit determinants of water demand for households and to estimate the relative importance of several attributes (characteristics) of water services and possible uses for different groups of local households. The CM approach is used to assess the trade0offs among different attributes across households as
CemOA
: archive
ouverte
d'Irstea
well as to estimate local households’ willingness to pay (WTP) for these water service improvements.
1.1 Research Questions
The research questions which this study tries to answer are as follows:
1) What are the current main uses of water and water services in the area and do these vary across household types?
2) What are the preferences of rural households in terms of water uses?
3) Are rural households willing to pay for services that cater for their multiple water uses? How much are they willing to pay?
4) What are the determinants of the households’ water demand?
1.2 Research Objectives
The broad objective of the study is to assess the demand for improved domestic water services and hence provide the basis for micro level analysis of consumer benefits from multiple water uses in rural areas of South Africa (Sekororo0Letsoalo as the case study).
The specific objectives are as follows:
1) To identify the different water sources, uses and therefore build a typology of water0related livelihood activities and a typology of households based on these activities;
2) To identify the water services improvements desired by the households;
3) To assess households’ willingness to pay for improved water services, including services for multiple water uses;
4) To assess the determinants of household willingness to pay for improved water services. CemOA : archive ouverte d'Irstea / Cemagref
1.3 Research Hypothesis
1) Rural households use domestic water for multiple uses (domestic and productive uses). The pattern of access to and uses of domestic water is influenced by socio0 economic characteristics of households (livelihood activities, family size, gender, age of household head, income) and local circumstances (Hope et al., 2003). 2) Households desire improved water services which cater for their domestic and
productive uses.
3) Rural households are willing to pay for improved water availability and accessibility that respond to their multiple uses. This therefore means that part of the cost of the service can be recovered through water user fees (Banda et al., 2007).
4) A household’s willingness to pay (WTP) for an improvement in water services is a function of the proposed changes in the attributes of the services, and of all other factors which influence the household’s valuation of that change (including household’s characteristics) (Whittington, 2002).
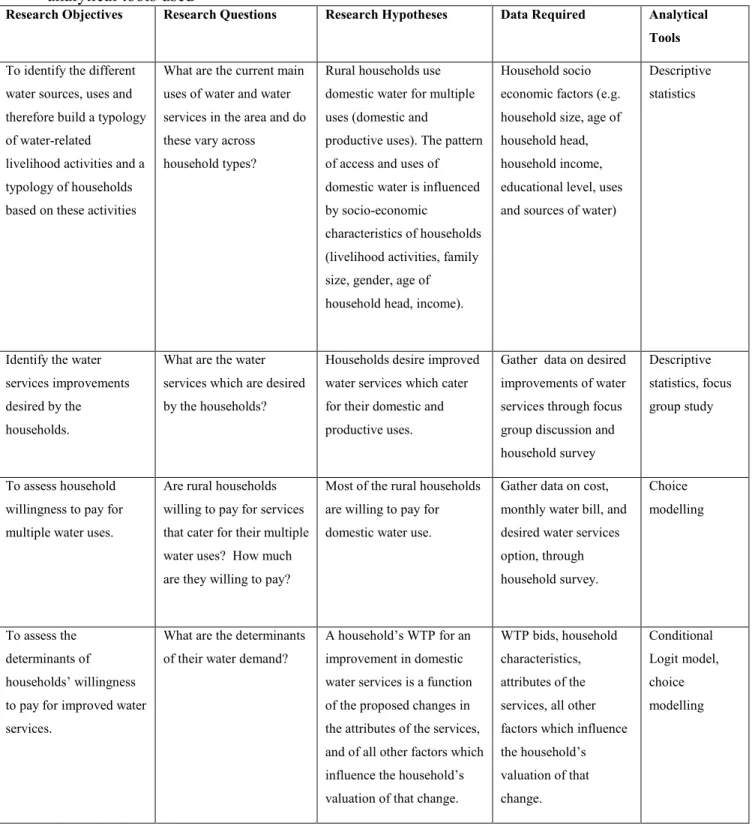
Table 1.1 presents the linkages between research objectives, research questions and hypothesis, data requirements and analytical approaches used in this study.
CemOA
: archive
ouverte
d'Irstea
Table 1. 1 Linkages between research objectives, research questions, hypotheses and analytical tools used
, 6 7 , 8 , 9 ( ,
To identify the different water sources, uses and therefore build a typology of water0related
livelihood activities and a typology of households based on these activities
What are the current main uses of water and water services in the area and do these vary across
household types?
Rural households use domestic water for multiple uses (domestic and
productive uses). The pattern of access and uses of domestic water is influenced by socio0economic
characteristics of households (livelihood activities, family size, gender, age of household head, income).
Household socio economic factors (e.g. household size, age of household head, household income, educational level, uses and sources of water)
Descriptive statistics
Identify the water services improvements desired by the households.
What are the water services which are desired by the households?
Households desire improved water services which cater for their domestic and productive uses.
Gather data on desired improvements of water services through focus group discussion and household survey
Descriptive statistics, focus group study
To assess household willingness to pay for multiple water uses.
Are rural households willing to pay for services that cater for their multiple water uses? How much are they willing to pay?
Most of the rural households are willing to pay for domestic water use.
Gather data on cost, monthly water bill, and desired water services option, through household survey. Choice modelling To assess the determinants of households’ willingness to pay for improved water services.
What are the determinants of their water demand?
A household’s WTP for an improvement in domestic water services is a function of the proposed changes in the attributes of the services, and of all other factors which influence the household’s valuation of that change.
WTP bids, household characteristics, attributes of the services, all other factors which influence the household’s valuation of that change. Conditional Logit model, choice modelling CemOA : archive ouverte d'Irstea / Cemagref
1.4
Organisation of the thesis
Chapter two describes the study site, the Sekororo0Letsoalo area in Maruleng municipality, Limpopo province of South Africa. The household demography and the socio economic factors of the population are explored and a typology of water uses and users is proposed.
Chapter three reviews the theoretical and empirical literature related to water demand valuation for domestic and productive uses. This chapter focuses on studies that were done in developing countries to value water and assess determinants of domestic water demand. This section also reviews studies that used choice experiment to value other environmental goods. The objective of literature review is to identify determinants of water demand and approaches that can be used for the study.
Chapter four presents the methods and procedures used for this research. It describes how the choice experiment was designed using the results of a focus group study and secondary data. The sampling procedure and data collection method are also presented, as well as the data requirements, sources of data and data limitations.
Chapter five is the first analytical chapter which main objective is to assess the household demographics and typology of water uses and users. Frequencies, cross tabulations, Chi0 square test, t tests and ANOVA were used to compare socio0economic variables and water services across sampled households and villages.
Chapter six presents the determinants of water services desired by interviewed households across strata, villages and several strata and sub0strata of households (strata of households are defined using the connection to a piped system; the level of income and the level of water consumption). This section models the household preferences for water services using a Conditional Logit Model (CLM).
CemOA
: archive
ouverte
d'Irstea
Chapter seven gives a summary of findings, policy insights and conclusions from the study. CemOA : archive ouverte d'Irstea / Cemagref
4
/
(
2.0 Background of the study site
This study was carried out in Sekororo0Letsoalo area, located within the quaternary catchment B72A of the Olifants River Basin, which is about 60km from Tzaneen in the Limpopo province. This area is part of the Sekororo tribal authority and Letsoalo tribal authority and is located in Maruleng Local Municipality, Mopani District Municipality (Fig. 2.1). Several research projects are currently going on in the area including two IWMI0led projects on “Models for Implementing Multiple use Water Supply Systems for Enhanced Land and Water Productivity, Rural Livelihoods and Gender Equity” and “The Challenge of Integrated Water Resource Management for Improved Rural Livelihoods: Managing Risk, Mitigating Drought and Improving Water Productivity in the Water Scarce Limpopo Basin” (Multiple Use Systems and Waternet projects in short). This study is part of the Multiple Use Systems (MUS) project. The MUS project focuses on developing tested tools and guidelines for multiple0use water services delivery as an effective way to use water for poverty alleviation and gender equity. It adopted a participatory, integrated and poverty reduction focused approach in poor rural and peri0 urban areas. One of the main assumptions of this project is that provision of water for multiple uses will increase poor people‘s ability and willingness to pay for water services and hence improve recovery of costs of the service from users (van Koppen et al., 2006).
CemOA
: archive
ouverte
d'Irstea
Figure 2. 1: Geographical location of the study site
Source: Maruleng Municipality WSDP, 2003
2.1 Socio demographic characteristics of the study area
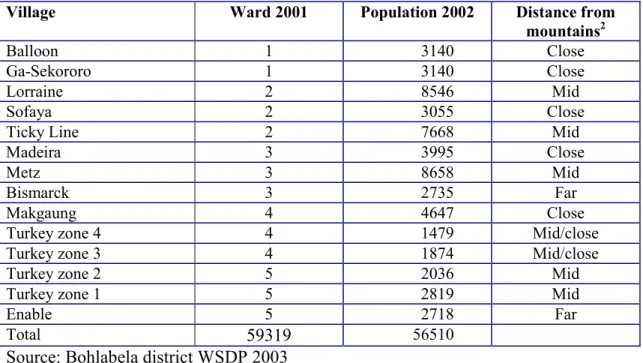
The study area is composed of 14 villages located in the B72A quaternary catchment: Balloon, Bismarck, Enable, Ga0Sekororo (which includes Moshate and Mahlomelong), Lorraine, Madeira, Makgaung, Metz, Sofaya, Ticky Line (also called Hlohlokwe), and Turkey zones 104. According to Bohlabela district Water Services Development Plan (WSDP) the total population of these 14 villages was 56510 inhabitants in 2002 (Bohlabela district WSDP, 2003). Villages have different access to water resources
CemOA
: archive
ouverte
d'Irstea
depending on the distance from the mountains1. Information of distance from the mountain was used as the basis for selection of villages where primary data would be collected (Table 2.1).
The illages fall into wards 1, 2, 3, 4 and 5 of Maruleng municipality (Census 2001 boundaries). Wards 1, 2 and 5 are partly included in B72A. Wards 1 and 2 include some commercial farms; ward 5 includes commercial farms, private game reserves and part of other quaternary catchments. Ward 3 and 4 are completely included into B72A. The total population of these 5 wards was 59319 inhabitants in 2001. In order to select villages from which the sample was selected, it was necessary to stratify households based on water access and distance from the mountain. We assumed that the level of present water services is a determinant of water services demand. From previous studies in the area we also know that access to water services vary across households. The only reliable and exhaustive information available on access to water services in the area is at ward level (Census 2001). Household information on water access is not available at village level. Therefore, we had to allocate the villages into their respective wards. It was quite difficult to identify which ward the villages belong to because ward boundaries have changed between 2001 and the last municipal elections of 2005/06. For this study the following distribution was assumed (see Table 2.1).
1Distance from the mountain is important as this affects household water access. This is mainly because of differential rainfall and numerous streams and springs on the slopes of the mountains, which dry up further downstream. CemOA : archive ouverte d'Irstea / Cemagref
Table 2. 1: Population of the 14 villages in 2002 and distance from the mountains : $ /005 /00/ ( / Balloon 1 3140 Close Ga0Sekororo 1 3140 Close Lorraine 2 8546 Mid Sofaya 2 3055 Close
Ticky Line 2 7668 Mid
Madeira 3 3995 Close
Metz 3 8658 Mid
Bismarck 3 2735 Far
Makgaung 4 4647 Close
Turkey zone 4 4 1479 Mid/close
Turkey zone 3 4 1874 Mid/close
Turkey zone 2 5 2036 Mid
Turkey zone 1 5 2819 Mid
Enable 5 2718 Far
Total 59319 56510
Source: Bohlabela district WSDP 2003
Results of Census 2001 show that 55% of the population is female and over 70% of the population are below the age of 40 (Census 2001). Table 2.2 shows that the dependency ratio is high as 62% of the population is not economically active. 89% of the population earn less than R19200 per year3and 76% of the population is considered very poor on the basis of household monthly income4(Table 2.5).
Table 2. 2 : Employment status of potentially active population in wards 1 to 5 of Maruleng municipality
) Wards 105
Number of people % of people aged 15 to
64
employed 4116 13%
unemployed 7596 24%
labour force 11712 38%
not economically active 19410 62%
unemployment rate 65%
Source: Census, 2001
2 Water flows from the mountains and villages which are close have better water access 3 €1=R10 in 2002
4 Households that have a monthly income of R800 or less are considered very poor
CemOA
: archive
ouverte
d'Irstea
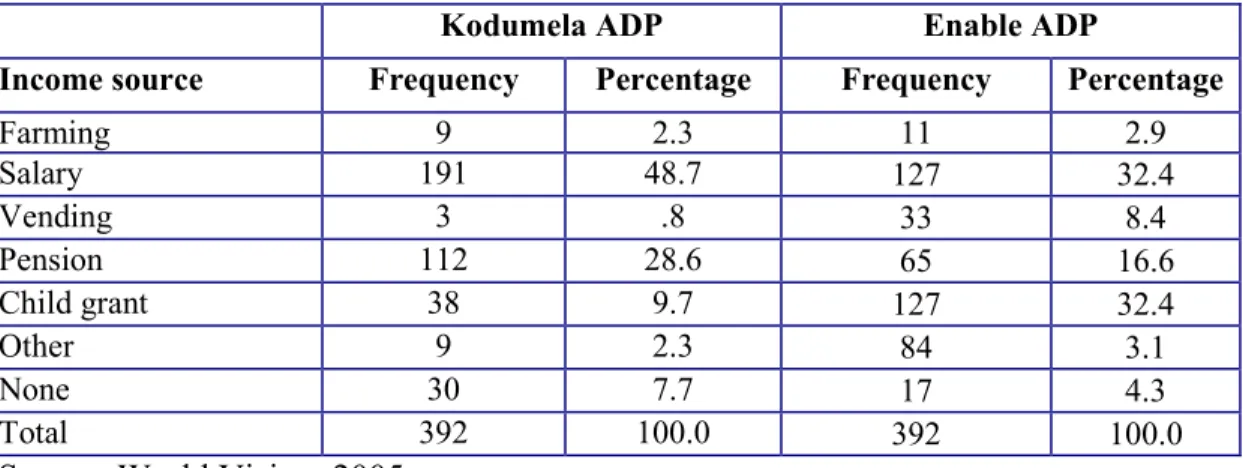
Table 2.3 shows the proportion of people employed in various sectors based on Census, 2001. The Table shows that a significant proportion of the population rely on pensions and social grants; agricultural/ forestry/fishing sector is an important source of employment as it employs 28% of the labour force. Results from census (2001) are consistent with those from two World Vision (a non governmental organization) studies in the area5which showed that 39% of the sampled population rely on pensions and child grants whilst only 49% depend on regular salaries and less than 3% get an income from agriculture. At least 4 % of the local households are reported to have no source of income at all (see Table 2.4).
Table 2. 3: Distribution of employed people per industrial sector in wards 1 to 5 of Maruleng Municipality $ Agriculture/Forestry/Fishing 28% Community/Social/Personal 34% Construction 7% Electricity/Gas/Water 1% Financial/Insurance/Real Estate/Business 3% Manufacturing 3% Mining/Quarrying 1% Private Households 7% Transport/Storage/Communication 4% Undetermined 5% Wholesale/Retail 8% Total 100% Source: Census, 2001
5 These studies included some villages which are not in the study area and considered household main source of income only. One of the studies (Enable ADP) covers 4 villages; Enable, Turkey, Worcester and Butswana and the other study (Kodumela ADP) covers 6 villages; Sofaya, Turkey, Makgaung, Moshate, Madeira and Metz.
CemOA
: archive
ouverte
d'Irstea
Table 2. 4: Distribution of households on the basis of main sources of income in Kodumela and Enable ADP areas
( ) ( ; & $ & $ Farming 9 2.3 11 2.9 Salary 191 48.7 127 32.4 Vending 3 .8 33 8.4 Pension 112 28.6 65 16.6 Child grant 38 9.7 127 32.4 Other 9 2.3 84 3.1 None 30 7.7 17 4.3 Total 392 100.0 392 100.0
Source: World Vision, 2005
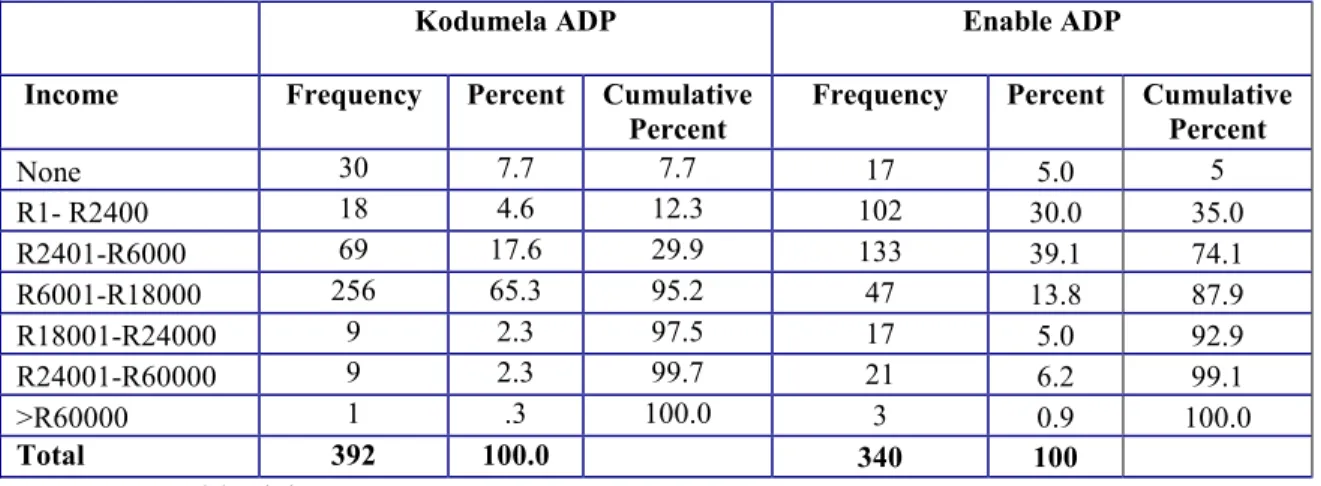
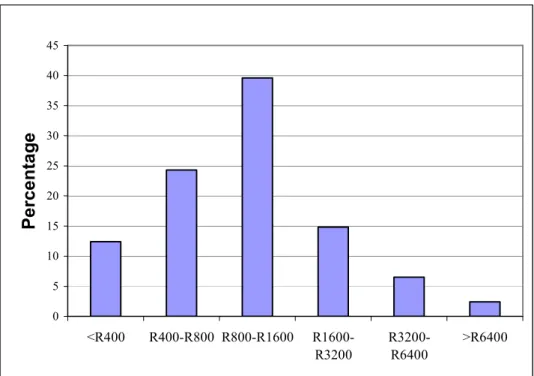
Household incomes in wards 1 to 5 are very low. Table 2.5 presents the distribution of households according to their level of annual incomes in wards 1 to 5. 41% of households reported that they do not earn any income. The second income class in terms of number of households is between R4 800 and R9 600, with 24% of households. Only 5% of the households has income above R 38 400 a year. The findings by World Vision (2005) are consistent with Census (2001) results, as it shows that most households earn between R60000R18000 (see Table 2.6). The two sources mainly differ on the percentage of households without any income, as World Vision study found that less than 10% of households have no source of income. This difference could be due to the difference of dates of survey (2001 for Census and 2005 for World Vision) and the way in which income information was collected in both studies: the Census calculated the household annual income by adding the individual monthly income of all members of the household collected in ranges; therefore the accuracy of this variable is unknown; conversely, World Vision study asked directly about the household income.
CemOA
: archive
ouverte
d'Irstea
Table 2. 5: Distribution of households per class of annual income in wards 1 to 5 of Maruleng Municipality ' < 4 $ None 4944 41% 41% R1 0 4800 1323 11% 52% R4801 0 9600 2859 24% 76% R9601 0 19200 1503 13% 89% R19201 0 38400 708 6% 95% >R38400 624 5% 100% Total 11961 100% 100%
Source: Census 2001, own calculations
Table 2. 6: Distribution of households per class of annual income in Kodumela and Enable ADP areas
( ) ( ; & 4 & 4 None 30 7.7 7.7 17 5.0 5 R10 R2400 18 4.6 12.3 102 30.0 35.0 R24010R6000 69 17.6 29.9 133 39.1 74.1 R60010R18000 256 65.3 95.2 47 13.8 87.9 R180010R24000 9 2.3 97.5 17 5.0 92.9 R240010R60000 9 2.3 99.7 21 6.2 99.1 >R60000 1 .3 100.0 3 0.9 100.0 =>/ 500"0 =?0 500
Source: World Vision, 2005
2.2 Infrastructure and water access
Although 85% of the total population in South Africa has access to tap water, there is great variation in access to water across districts and rural and urban areas. In some rural areas, approximately 30% or less have access to tap water (Stevens, 2007). In the former homeland areas of the Olifants River basin,45% of the population has water access which is below the RDP standard 6(Lefebvre, 2005). As is the case in many former homelands in South Africa, infrastructure development in Sekororo0Letsoalo area is very low and
6
A household is said to have poor water access when it is 200m or more away from the nearest source of piped water. CemOA : archive ouverte d'Irstea / Cemagref
water and sanitation services are very poor. In 2002, it was reported that 73 percent of the population consume up to10 litres of water per capita per day (Maruleng Municipality, 2002; Panesar, 2006). In addition, only 10 percent of its population is considered to have reliable access to water (Panesar, 2006).
Most of the infrastructure (which comprises weirs on streams or boreholes, reservoirs and reticulation systems supplying communal standpipes) was built during the apartheid by the former homeland government in the mid0eighties. Since 1994, the water supply schemes have been managed by DWAF, but only few improvements have been made. Efforts to improve water services have been limited mainly by the scarcity of local water resources, which are not sufficient to supply all the households, and the lack of proper planning and management of infrastructure (which is very old) due to shortage of human and financial capital in the local and district municipalities. Domestic water supply schemes are in the process of being transferred by DWAF to the District Municipality and they are in need of rehabilitation. The present water supply project from Mopani District municipality intends to source water from the Blyde River.
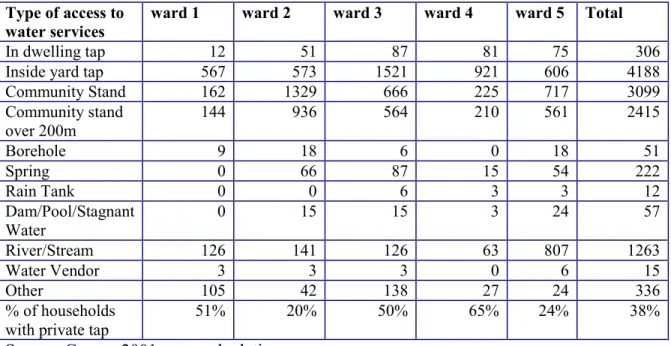
Table 2.7 presents the distribution of households per type of water access in the study area. Households in the area depend on diverse sources of water including in0dwelling tap, inside yard tap, community stand, borehole, spring, rain tank, river/stream, water vendor and stagnant water (like dams and pools). 38% of households have private taps connected to public water network. Yard taps are sometimes treated as community resources as some households in the vicinity collect water from these. In Sekororo0 Letsoalo area there are mainly public standpoints where households collect water, but water supply from this source is very low and sometimes the standpipes are broken, such that households have to depend on other sources like rivers and ponds. 46% of households collect water from community stands. 53% of those who collect water from community stands are located more than 200m away from the stand (Census 2001).
CemOA
: archive
ouverte
d'Irstea
Table 2. 7: Distribution of households per ward and access to water services in the study area
2
2 5 2 / 2 = 2 ? 2 @
In dwelling tap 12 51 87 81 75 306
Inside yard tap 567 573 1521 921 606 4188
Community Stand 162 1329 666 225 717 3099 Community stand over 200m 144 936 564 210 561 2415 Borehole 9 18 6 0 18 51 Spring 0 66 87 15 54 222 Rain Tank 0 0 6 3 3 12 Dam/Pool/Stagnant Water 0 15 15 3 24 57 River/Stream 126 141 126 63 807 1263 Water Vendor 3 3 3 0 6 15 Other 105 42 138 27 24 336 % of households with private tap
51% 20% 50% 65% 24% 38%
Source: Census 2001, own calculations
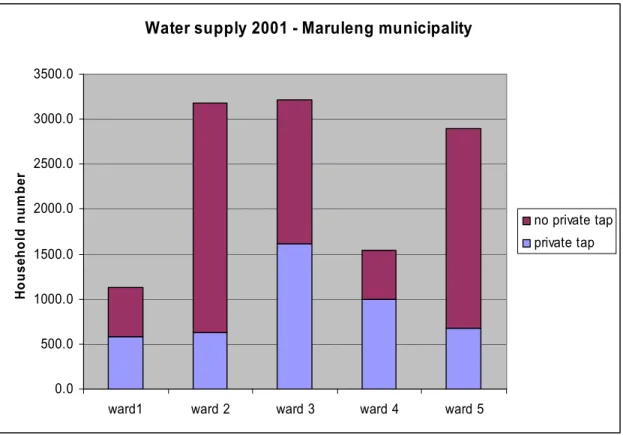
Water sources vary markedly across wards. Figure 2.3 shows the proportion of households with private taps in the study area. Most households (65%) in ward 4 have access to private taps whilst only 20% of households in ward 2 have access to private taps. In wards 1 and 3 at least 50% of the population have access to private taps. In ward 1 springs, rain tanks, dams and stagnant water are not used as sources of water. In ward 4 boreholes and water vendors are not used as sources of water. 60% of the households in ward 2 collect water from public standpipes and for 70% of these households the standpipe is more than 200m away from the homestead (see Table 2.7 and fig. 2.2).
Figure. 2.2 shows that in all wards a significant number of households have no access to private taps. Wards 3 and 4 have the best access to private taps whilst ward 2 has the worst. CemOA : archive ouverte d'Irstea / Cemagref
Figure 2. 2: Number of households with and without private tap per ward in the study area in 2001
Source: Census 2001
The World Vision survey (2005) shows that in Kodumela ADP 63.5% of the 768 households interviewed had access to a private tap (18.1% in house and 45.4% in yard) while no households had access to a private tap in Enable ADP (except maybe for 7.1% who had access to a borehole, but it is not specified whether the borehole is public or private). These results are consistent with Census (2001) even if some small discrepancies can be noted.
Households use water for productive purposes such as gardening, farming and livestock watering. The World Vision study (2005) showed that in Kodumela area about 43% of the households are involved in communal farming and 31% are engaged in community gardening, and 19.1% have their own backyard garden. 63% of the households reported that they have livestock (for Enable ADP the corresponding Figures are 41.8%, 30.1%, 20.7% and 63%) (Table 2.8). CemOA : archive ouverte d'Irstea / Cemagref
Table 2. 8: Multiple uses of water in Kodumela and Enable ADP areas ) ( 2 ' ' Communal farming 167 43% 164 41.8 Community gardening 121 31% 118 30.1 Livestock ownership 247 63% 247 63.0
(Source: World Vision, 2005)
The high prevalence of poverty, high population density, high unemployment and poor access to water services as well as the multiple sources and uses of water in the study area are representative of the situation found in many former homelands in South Africa, making it an interesting site for this study.
CemOA
: archive
ouverte
d'Irstea
4
=
3
,
2
3.0 Introduction
This chapter presents an empirical review of studies carried out related to water demand valuation for domestic and productive uses. The objective of the literature review is to identify what has been done so far, how it has been done (methodological approaches) and the results and conclusions obtained. The literature review is important for identifying the gaps in knowledge. This section also reviews methodologies used by other scholars which can be adapted for this study. The literature review informs working hypothesis of the study.
3.1 Review of empirical literature on demand for domestic water
services
Several studies have been done to assess households’ demand for domestic water services and the determinants of water demand in developing countries. These studies follow three main approaches: travel cost method (TCM), contingent valuation method (CVM), and choice modelling (CM). The TCM is a direct (revealed preference) approach of valuing non market environmental goods (Tietenberg, 2003). This method has been widely used to estimate value of recreational sites based on the monetary value and time that is spent to enjoy the site. In the case of valuation of water services in the absence of market, the value of water is taken to be equivalent to the value of time spent collecting water from the water source. One of the major shortcomings of the revealed preference method such as the travel cost method is that it does not take into account the non use values of a resource.
Contingent Valuation Method (CVM) is a stated preference method (direct method) of
CemOA
: archive
ouverte
d'Irstea
estimating the value of a non marketed or non priced environmental good (or service). In this approach the respondent is asked how much s/he is willing to pay for a particular good or how much is willing to accept for the loss of a good or service given a hypothetical market for the good or service. One of the shortcomings of CVM is that it can not be used to assess trade0off of various attributes of water services.
Choice modelling (CM– or choice experiment) is a stated preference method, a generalization of the contingent valuation method in that a respondent is given a menu of cases from which to choose (Adamowicz et al., 1998). Cases (or policy scenarios) proposed to respondents differ from one another along several attributes, which can take different levels. Choice modelling is very attractive because it relies on the same random utility model structure as the contingent valuation method (Bennet and Blamey, 2000). The service levels and attributes can be collected by pre0testing of the questionnaire, secondary data and focus group discussions. Although this method has been used in very few studies, its flexibility in estimating impacts in terms of economic welfare from changing the provision of public goods has led to its popularity (Bennett et al., 2001). The other merit of the CM approach is that results of the choice experiment illustrate trade0offs between attributes and prices making it easy to estimate values of services.
In the following sub0sections, we review studies that have been done to assess determinants of water services demand. First, we review those studies which used travel cost method (TCM), followed by those which used contingent valuation method (CVM) and lastly those that used the choice modelling (CM).
="5"5
# 4!%
Whittington et al., 1990 carried out a study in Kenya using the TCM approach, to determine the value of time spent hauling water. The results show that the value of time on water collection is high, and almost the same as the wage for unskilled labour. Households in the study area collected water from one source hence the travel cost method was appropriate for this study. Households were grouped according to their
CemOA
: archive
ouverte
d'Irstea
sources of water: collecting from an open well, buying from a kiosk and buying from a vendor. Results revealed that households buying water from vendors placed a high value on water collection and were spending about 8% of their income on water. A conditional multinomial logit model (CLM) was estimated to examine determinants of choice of water source. Explanatory variables for this model were money spent on water, time of water collection, a dummy for household perception for taste of water, household income, number of women in the household and years of formal education for the household heads. All the variables were significant with the exception of perception of water taste and education years. Authors concluded that benefits of improved water services are higher than those which are actually realised by households.
Mazvimavi and Mmopelwa, (2006) conducted a study to assess WTP for improved safe water in Okavango, North West Botswana. The travel cost method was used to estimate the value of water, whilst a contingent valuation survey was used to determine how much the households were willing to pay for improved water quantity and quality. The study showed that opportunity cost of time spent collecting water can be used to ascertain the value of water. The study concluded that most of the households were willing to pay for improved access to water but quite a significant number of households were not willing to pay either because of poverty or they felt that water should be provided by the government for free. Of those who were willing to pay, some were willing to pay in kind (payment in the form of cattle, goats or agricultural produce). The study also revealed that the water had multiple uses such that there were some problems of excessive use and pollution of water.
="5"/ 4
$
#4:!%
Contingent Valuation Method (CVM) has become a major tool for estimating the value of natural resources like water especially in developing countries (Whittington, 1998 and Merret, 2002). Over the last two decades a flurry of CVM studies have been undertaken to assess effective demand of water and sanitation services among rural households in developing countries. The studies which used CVM are as follow.
CemOA
: archive
ouverte
d'Irstea
Whittington et al. (1990) analyzed determinants of water demand in Southern Haiti. A contingent valuation approach was used to determine how much households were willing to pay for public and private taps using a bidding game technique. Descriptive analysis was carried out to assess the proportion of income that household would be willing to pay for domestic water. To assess the determinants of household WTP two ordered probit models were applied, one for public taps and the other for private tap connection. In each of the two probit models the dependent variable was the probability that the household’s WTP for a public (or private) tap falls within a particular interval. The regressors in the two probit models were: household wealth, household remittances (foreign income) (dummy), occupation index (dummy), household education level, distance from existing water source, quality index of existing source and sex of respondent (dummy). The results showed that household wealth, household education, and distance from existing water source and water quality were significant determinants of household willingness to pay for public and private taps.
Whittington et al. (1998) carried out a study to assess household demand for improved water and sanitation services in Lugazi, Uganda. Rapid appraisal techniques were used to collect information about the current water sources in the area. Questionnaires were administered but at the same time a number of other methods of collecting data which include observation, were also used. The appraisal showed that around 25% of the households purchased all their water from vendors implying that the households were willing to pay for water services. A contingent valuation survey was applied to solicit for households’ willingness to pay for public and private tap water. Results of the contingent valuation study confirmed that most households were willing to pay for full costs of water from public taps and only a few can afford to pay for private connection even when offered at less than full recovery cost. A probit model was used to assess the determinants of willingness to pay for improved water services. The dependant variable in the probit model was a dummy variable: willingness to pay for public taps. The explanatory variables which were hypothesized to affect household willingness to pay for public taps were: monthly price of using the public tap, wealth group of the respondent, years of
CemOA
: archive
ouverte
d'Irstea
education of respondent, number of children in the respondent’s household, household purchases of water from vendors (dummy), gender of respondent and tenure of house. The probit analysis revealed that the monthly price of public tap offered, wealth and household purchase of water from vendors were the key determinants of willingness to pay for public taps.
Goldblatt (1999) examined effective demand for improved water supplies in two informal settlements in Johannesburg, South Africa. The main objective of the study was to assess the potential for cost recovery from consumers to raise revenue to improve supply of domestic water services. A contingent valuation method was used to solicit household willingness to pay for private piped water connections using a bidding game technique. The CVM survey was in the form of a structured questionnaire soliciting for basic socio0 economic characteristics of the household, household water use and practices. To assess the potential for cost0recovery they compare WTP bids with operating and maintenance costs of improved water services. The study concluded that the amount households were willing to pay was not sufficient to cover capital costs for individual household connection but enough to cover the costs at limited consumption level like public standpipes.
Raje et al. (2002) examined household willingness to pay for municipal water in Mumbai, India. The objective of the study was to ascertain whether consumers would accept an increase in water charges. A contingent valuation method was used to assess households’ WTP more for water services. The level of satisfaction with current water services was assessed using a Likert’s scale7 and results revealed that majority of people were satisfied with the present service. A binomial logit model was applied to examine factors influencing household willingness to pay for municipal water. The dependent variable was willingness to pay for improved water services (dummy), whilst explanatory variables were the level of satisfaction with current water service, faith in the service provider and affordability. Affordability and belief (faith) in the management of the
7
This scale ranges from 1 to 5. 1 is the least desirable level of satisfaction and 5 would be the best level of satisfaction CemOA : archive ouverte d'Irstea / Cemagref
project operations and utilization of funds were found to be the key determinants of WTP more for improved water services.
Ntengwe (2004) carried out a study in Kitwe and Lusaka, Zambia to determine the linkages between awareness of water issues, ability to pay for water, affordability of water services and cost recovery. The sample was subdivided into five groups depending on the availability of water. Awareness on water issues was measured before and after seminars on water awareness. A contingent valuation survey was conducted to solicit information about WTP for water. Least squares and ANOVA were used to develop the regressions and analysis of data. Cost recovery was also measured by recording the amount paid by each consumer for water services. The findings of this study revealed that WTP alone does not result in cost recovery (the amount that people were willing to pay was less than the full cost of the service) and that awareness enhances the potential for full cost recovery. Affordability and water quality also increased WTP and cost recovery.
Mbata (2006) carried out a study to identify the determinants of WTP for private water connection in Kanye, Botswana. A contingent valuation survey was used where iterative bidding gave information on households’ WTP for private tap water. To assess the factors affecting households’ willingness to pay for water services, the author applied a multiple linear regression. The dependant variable in the regression model is WTP bid by household, whilst the explanatory variables were household income, household size, and education level of the respondent, age of respondent, distance from existing water source, employment status of household, gender of respondent and incidence of water borne diseases. Results of econometric analysis showed that household income, household size, education of respondent, distance from existing water source, employment and awareness were significant determinants of household WTP for tap water.
Pattanayak et al. (2006) conducted a study to determine households’ WTP for improved water services offered by the private sector in South West Sri Lanka. A contingent valuation survey was done to solicit for data on households’ socio economic factors and WTP of a household for improved water and sanitation services. A multiple linear
CemOA
: archive
ouverte
d'Irstea
regression model was used to assess the determinants of water demand. Scenario simulations were done to predict how improved water services would affect water use and these were also compared to the current water services. The study concluded that poverty and costs of water are the main significant factors which affect demand. Other factors which also significantly affect water demand are household location, household access to alternative water source and households’ perceptions of current water services.
Farolfi et al. (2006) used the contingent valuation method to analyse household willingness to pay for an improvement in domestic water quantity and quality in rural areas of Swaziland. The CVM revealed that households in rural areas were more willing to pay for water quantity and quality compared to urban households. To ascertain the factors influencing household willingness to pay for water quality and quantity two Tobit regression models were estimated, one for the water quality and the other for water quantity. The dependant variable for the model was the probability that the households were willing to pay for higher quality (or higher quantity). The variables: household income, water consumption, source of water, age of household head, gender of household head, collection time were found to be significant determinants of household WTP for improved water quantity. The variables that were found to determine WTP for quality were similar to those of the preceding model except that collection time was replaced by practice of taking avoidance measures against waterborne diseases.
Banda et al. (2007) also applied the contingent valuation approach to examine the determinants of water quantity and quality in Steelport Sub0basin in South Africa. One of their findings was that a higher proportion of households (62%) were willing to pay for improved quantity compared to improvements in water quality (41%). A Tobit model was applied to assess factors influencing the probability that a household is willing to pay for both improved quantity and quality. For the first regression, the dependant variable was a dummy: willing to pay for improved quality or not. The explanatory variables in the first regression were availability of water, household income, whether or not the household has a tap (dummy), water used per capita and age. The results of the first step regression model revealed that availability of water, households’ access to a tap and
CemOA
: archive
ouverte
d'Irstea
water per capita were significant determinants of willingness to pay for water quantity. The dependent variable in the second step regression model was the amount of money the household is willing to pay for improved quality. The regressors in the second step regression model were household income, household’s monthly water consumption and water use quality ranking. All the ascertained explanatory variables were found to be significant determinants of WTP for water quantity and water quality.
="5"= 4
$ #4!%
Blamey et al. (1999) applied choice modelling to assess the value of water in communities with different water supply options in the Australian Capital Territory. Due to the increased pressure on water resources, there was need for policy intervention in the form of increasing water supply, reducing demand or a combination of the two. Each community was presented with five different options from which they had to select their most preferred choice of water service. The attributes of water supply were water quality, quality of the environment, cost, aquatic environment, maintenance of habitat for animals and nature and style of the urban environment characterized by areas of grass and trees. The results of the conditional logit model show that there is a negative relationship between household water cost and water use. The households’ decisions about water supply option tend to depend on water supply as well as the price of water. The status quo was the least preferred option and this implies that the households preferred an improvement in water supply. The households were willing to pay for improvement in water services as well as conservation of species and the environment.
Hope and Garrod (2004) applied choice experiments in a rural area in Limpopo province, South Africa to examine the preferences of households for changes in domestic water services. The attributes for this study were domestic water source, quality, quantity, possibility of irrigating a kitchen garden in the dry season and dry season river failure. A multinomial logit was the econometric method applied to assess the household preferences. The results showed that largest welfare gains occur when the households upgrade from use of groundwater to house tap. Improvement in water quantity would
CemOA
: archive
ouverte
d'Irstea
result in higher utility increase compared to improvement in quality for the rural households in this area. Welfare estimate from irrigating kitchen garden crops in the dry season suggests a low adoption rate that may limit poverty reduction impacts. This study revealed that convenience of a water source (that is reduced collection time, less physical effort) significantly affects the household water supply choices.
Yang et al. (2006) examined factors that influence the demand for alternative water supply and sanitation services in Negombo, Sri Lanka. Conjoint survey (choice modelling), where the respondent was presented with four choices of water service options and their attributes and a respondent had to select one they prefer. Respondents had to choose from the following options: private tap, mini grid, public stand posts or opt out (choosing the current water source which is non piped water). Econometric models which were used were conditional and mixed logit models. Explanatory variables (which were mainly attributes of the water service) proposed were: monthly water bill, volume of water per day, hours of water supply2, safety of tap water and different levels for water safety and water sources. The rest of explanatory variables were interactions8 between these attributes and whether the household was poor or not; this was done to test if there were significant differences between the poor and non poor households. Identification of the level of poverty was made on the basis of the monthly per capita consumption. This data was classified and the bottom two deciles of the distribution were taken to be the poor. The study revealed that consumption charges, volume of water, safety of water, hours of supply were key determinants of the choice of water source. It was also clear that although private taps and mini grid are preferred to public taps; most households prefer the status quo (non piped water). The interaction terms showed that consumption charges significantly affected the poor more than the non poor; and the poor are less satisfied with the status quo and this implies that poor households are more price0 sensitive.
Snowball et al. (2007) applied choice modelling to elicit the household’s willingness to
8
Interaction term of poverty and other attributes implies multiplying an attribute by the dummy for household poverty. CemOA : archive ouverte d'Irstea / Cemagref
pay for improvement in water attributes in the middle income urban area of South Africa. The attributes that were identified for this experiment were bacteria, water discoloration, water pressure, interruption of water supply, frequency of water meter problems and monthly water bill for water. The conditional logit model (CLM) and the Heteroscedastic Extreme Value model (HEV) were used to estimate the determinants of water service choice. All the attributes had the expected signs and only water pressure and frequency of water meter problems were not significant. The most important determinants of water demand were water quality (water discoloration and bacteria count) and interruption to water supply.
Nam and Son (2005) carried out a study to assess the willingness to pay for improved water services and the consumers’ preferences for water services of households in Ho Chi Minh City, Vietnam. The study used both contingent valuation and choice modelling and compared the welfare estimates from both methods. Choice modelling was also used to investigate the attributes of water supply (water quality, water pressure and price) which were important to respondents. For the contingent valuation survey, households were divided into two strata: households which have access to piped water and households without piped water. Both groups were asked questions to derive willingness to pay for improved attributes of water service. Choice modelling was conducted only for households without piped water. These households were presented with four choices (including the status quo) of improved water projects defined by water quality, pressure, and prices. Results of the CVM show that households’ WTP estimates were higher than the current water bills. The median WTP of non piped households was double the average monthly water costs thus higher than that for piped households. Choice modelling results show that for non0piped households, water quality is a much more important attribute than water pressure.
CemOA
: archive
ouverte
d'Irstea
3.2. Determinants of water demand
A number of determinants of household preferences for water services were identified from literature. These determinants are discussed below:
(i) Water source
Households could be willing to move from one water source to a better one. Households generally prefer to have water sources which are closer to their homes and reliable. Most households might prefer to have private taps so as to ensure that they have convenience (Banda et al., 2006; Hope and Garrod, 2004; Farolfi et al., 2006; Hope, 2006; Yang et al., 2007).
(ii) Water quality
Quality of water affects households WTP for water service improvement. There is a negative relationship between current water quality and WTP for water improvement. Households which have poor water quality are more WTP for water service improvements compared to households who have better water quality (Banda, 2004; Hope and Garrod, 2004). Most households prefer to have clean and purified water for domestic uses like cooking. Households are also concerned about having water which is not contaminated by bacteria, has a good smell and taste, is clear and not muddy. There is a positive relationship between WTP for water service improvements and incidence of water borne diseases and other water related health problems (Whittington et al., 1990; Mbata, 2006).
(iii) Possibility of using water for productive uses
Use of water for productive uses affects households’ WTP for water service improvements. Using water for productive purposes like irrigating the garden, livestock watering, brick making, beer making means that the household can generate money from these uses. Generally, households should prefer to have water for multiple uses like garden irrigation as this improves their livelihood and ability to pay for water services (Van Koppen et al., 2006).
CemOA
: archive
ouverte
d'Irstea
(iv) Confidence in the service provider
Confidence with the service provider increases household WTP for water services. If the households do not have faith in the way water service is being managed they might not be willing to pay for water service (Raje et a.l, 2002; Ntengwe, 2004; Davis, 2004).
(v) Price of water
The demand curve for water is downward slopping, household monthly water bill is expected to have a negative relationship with WTP for water service improvements (Raje et al., 2002; Yang et al., 2006; Snowball et al., 2007).
(vi) Household water consumption
There is a negative relationship between current household water consumption and WTP for improved water service (quantity). Households which already have enough water have no incentive to pay more for improvement in quantity because when household has enough water, they become more worried about higher level service like water quality and taste (Banda et al., 2006; Hope and Garrod, 2004; Hope, 2006; Farolfi et al., 2006; Yang et al., 2006; Pattanayak et al., 2006).
(vii) Distance from existing sources or collection time
There is a positive relationship between water collection time in the present situation (distance to the water source) and WTP for water services improvement. Households who are far from the source of water may want a more easily accessible source (Whittington et al., 1990; Calkins et al., 2002; Farolfi et al., 2006; Banda et al., 2007).
(viii) Frequency of supply of water
The current frequency of supply of water (hours of water supply per day) have a negative relationship with WTP for water services improvement. This suggests that the more reliable the current water supply is, the less the households are WTP for water service improvement. This water frequency of supply is related to the type of water source (Yang et al., 2006). CemOA : archive ouverte d'Irstea / Cemagref